AI Agent performance monitoring means tracking how an AI Agent handles real customer conversations after launch. It shows how many issues the AI Agent resolves on its own, when it hands conversations off to human agents, and whether it used the right knowledge and tools to respond. Testing before launch tells you whether an AI Agent is ready to go live. Monitoring tells you how it performs once real customers start using it.
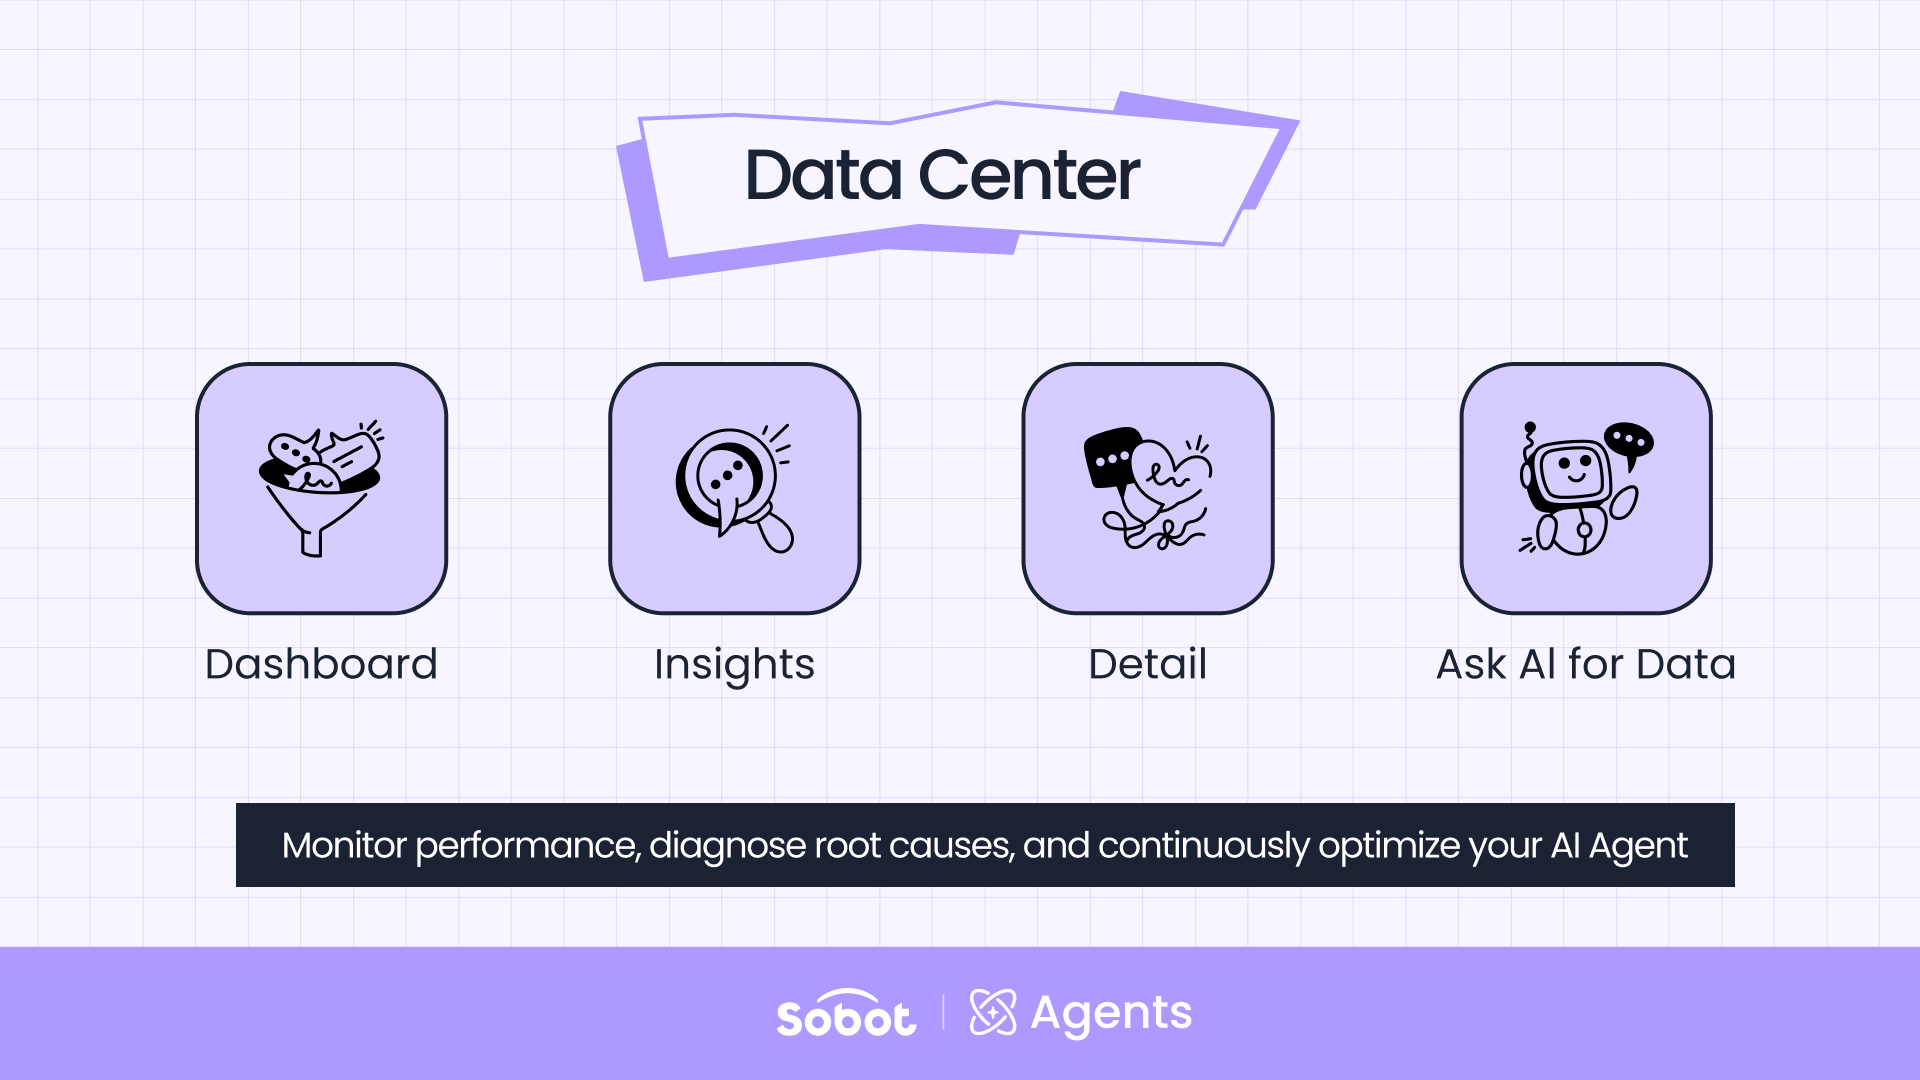
In Sobot AI Agents, this happens in the Data Center. The Dashboard shows what happened, Insights shows where the problem is likely to be, and Detail takes you into the individual conversation. “Ask AI for Data” in AI Studio lets your team ask about these metrics in plain language instead of searching through reports.
What Does AI Agent Performance Monitoring Track in Sobot AI Agents?
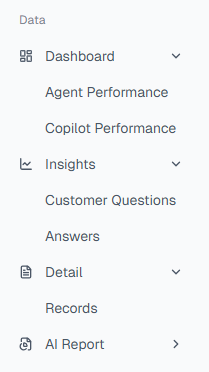
The Sobot AI Agents Data Center organizes AI Agent performance data into three layers, each answering a different question. Used in order, they take you from a result, to its likely cause, to the conversation where it happened.
| Layer | Question it answers | What it shows |
| Dashboard | What happened? | Conversation volume, how many conversations the AI Agent handled on its own, handoffs to human agents, resolution, and customer satisfaction |
| Insights | Where is the problem likely to be? | What customers are asking about, which questions the AI Agent rarely handles on its own, and whether its answers drew on Knowledge, Workflows, Tools, or Skills |
| Detail | What exactly happened in the conversation? | How the customer phrased the question, how the AI Agent replied, the routing path it followed, and whether the issue was resolved or handed off |
Conversation Metrics in the AI Agent Conversation Dashboard
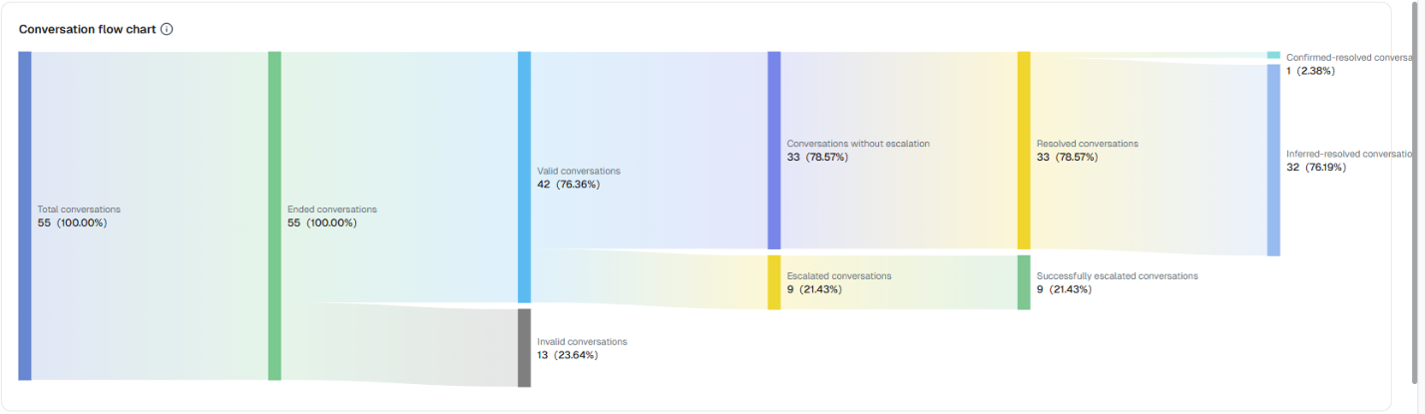
The AI Agent Conversation Dashboard shows how many conversations the AI Agent received, how many it handled on its own, how many were handed off to human agents, how many issues were resolved, and how satisfied customers were. Its conversation flow chart follows conversations from total, to ended, to valid, through to handoffs and resolution.
You can view the data by conversation start time, AI Agent, and conversation status, and filter further by business type, channel type, or inquiry channel.
Copilot Metrics for Human Agents Using an AI Assistant
Alongside AI Agents that serve customers on their own, the Data Center includes a copilot conversation dashboard. It shows how human agents use the AI assistant while they serve customers. The dashboard tracks assisted conversations, the number of human agents using the AI assistant, how many questions they asked it, answer messages, adopted answers, adoption rate, and average questions per agent.
Together, these metrics answer two questions: are human agents actually using the AI assistant, and are its answers being adopted?
Case Study: How to Diagnose a Rising Handoff Rate in an AI Agent
No single metric tells you whether an AI Agent is performing well. High conversation volume doesn’t mean customers’ problems are being solved. A low handoff rate doesn’t prove customers got the answers they needed. And a drop in satisfaction tells you something went wrong — but not why.
Take an after-sales AI Agent whose handoff rate has started to climb. Any of these could be behind it:
- Customers have suddenly started asking about a new product fault.
- The knowledge base doesn’t cover the topic.
- The AI Agent isn’t calling the Tool it needs to look up orders.
- A Skill has gaps in its handling logic.
The handoff rate alone can’t tell you which one it is. The Sobot AI Agents Data Center narrows it down in three steps: find where the change is happening, link it to specific questions or resources, and confirm the cause in real conversations.
Step 1: Find Where the Handoff Increase Is Happening in the Dashboard
The AI Agent Conversation Dashboard shows whether a rise in handoffs is happening across the board or concentrated in one place. Filter the conversation flow chart by AI Agent, business type, and channel to find where the increase sits. Checking satisfaction ratings for the same slice shows whether the customer experience is affected too.
Step 2: Link the Handoffs to Specific Questions or Resources in Insights
Insights connects a change in the Dashboard to what customers are asking and what the AI Agent drew on to answer. It has two views: Customer Questions and Answer Data.
Customer Questions shows what customers have been asking about most, and how well the AI Agent handles each type of question on its own. If the extra handoffs are concentrated in questions like “How do I change my shipping address?”, “Can I return this within 7 days?”, and “How do I check my order status?”, you can focus on those scenarios instead of reviewing every conversation.
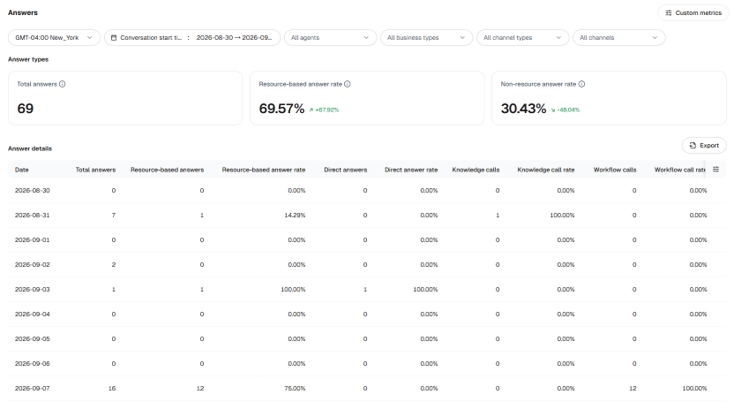
Answer Data shows whether the AI Agent used resources from the Resource Center when it answered. It counts how many answers used resources and how many didn’t, and how often Knowledge, Workflows, Tools, and Skills were called. These numbers don’t identify the cause on their own, but they tell you where to look:
| What the data shows | What to check |
| One type of question surges, but Knowledge is rarely called | Whether Knowledge covers the topic |
| Order lookups come in, but no Tool is called | The Tool’s binding, description, and trigger conditions |
| A Skill loads often, but the issue stays unresolved | Whether the Skill’s handling logic is complete |
Step 3: Confirm the Cause in the Conversation Record
Conversation records in Detail are where you confirm what actually caused a handoff. Metrics can only point you to what’s worth a closer look — the answer comes from what the customer said and what the AI Agent did.
Each record shows the full exchange between the customer and the AI Agent. When an autonomous AI Agent calls a Skill or Tool, the record also shows the routing path it followed.
That makes it possible to tell apart causes that look the same on a dashboard:
- The AI Agent didn’t recognize how the customer phrased the question, or the knowledge simply wasn’t there.
- The Skill’s logic was incomplete, or the Tool call failed.
- The request was outside what the AI Agent is designed to handle, so a handoff was actually the right outcome.
In short, the Dashboard tells you something is wrong, Insights helps you figure out why, and Detail confirms what actually happened.
How to Turn AI Agent Performance Data into Fixes
Each cause you find through AI Agent performance monitoring points to a specific part of the AI Agent’s setup:
| If monitoring shows… | Fix it by… |
| A frequently asked question keeps missing Knowledge | Adding or updating Knowledge |
| A question requires multi-step judgment | Refining the Skill |
| An external capability, such as order lookup, isn’t called correctly | Checking the Tool or MCP binding, name, and description |
| Fixed steps run inconsistently | Adjusting the Workflow |
| The AI Agent’s role boundaries or tone are unclear | Revising the prompt and related settings |
After making a change, rerun the relevant business scenarios and evaluation standards in the Evaluation Center to confirm the fix works. Once the AI Agent is back in service, the Data Center continues tracking real results, which starts the next round of improvements.
How to Query AI Agent Performance Data in Plain Language
“Ask AI for Data” is a natural-language query feature in Sobot AI Studio. It lets your team ask about AI Agent performance in everyday business language and get the numbers back directly.
Having the data in one place doesn’t mean getting answers is easy. Which report shows the independent handling rate for the past two weeks? What’s the difference between average response speed and average queue wait time? Which metrics and filters do you need to compare four skill groups? Most teams already have the data — what takes time is finding the right report, choosing the metrics, understanding how each one is defined, and turning it all into a conclusion.
Look Up a Metric
Ask “What was the total number of AI Agent conversations in the last 7 days?” and Ask AI for Data matches your question to the right metric and date range, then returns the result. You can ask about other metrics the same way, such as “How many conversations did the AI Agent handle on its own?” or “How many conversations were handed off to a human?”
Compare Time Periods and Teams
Ask for comparisons, such as “Which core metrics changed the most this month compared with last month?” or “Compare conversation volume and average handling time for our four skill groups over the past two weeks.” Results come back as key figures or broken down by dimension, so differences are easier to spot.
Ask What a Metric Means
If you’re not sure what a metric means, ask follow-up questions such as “How is the independent handling rate calculated?” or “What’s the difference between average response speed and average queue wait time?” If you don’t know what to analyze next, you can also ask it to suggest ways to break down the results you already have.
Instead of finding a report, then a metric, and then piecing an answer together, you start with the business question and refine from there. You don’t need to know the exact metric name to begin.
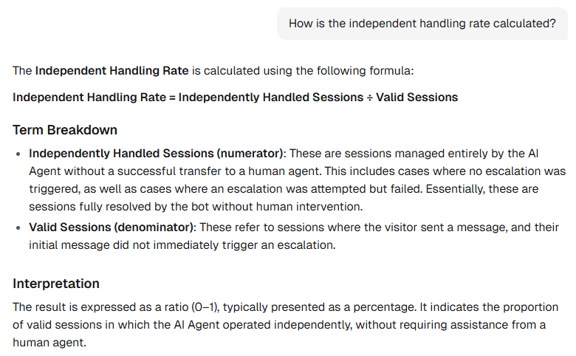
Ask AI for Data doesn’t replace the Data Center, which is still where you verify results, review conversation details, and dig deeper. It only uses metrics already registered in the system that your account has permission to access. It doesn’t create new metrics, and it won’t draw unverified conclusions about causes from a single number.
FAQ
What is AI Agent performance monitoring?
AI Agent performance monitoring is the ongoing tracking of how an AI Agent handles real customer conversations after launch. It covers resolution, handoffs to human agents, customer satisfaction, and whether the AI Agent used the right knowledge, Skills, and Tools when it answered.
How is AI Agent performance monitoring different from pre-launch evaluation?
Pre-launch evaluation tests an AI Agent against prepared business scenarios and evaluation standards to confirm it’s ready to go live. AI Agent performance monitoring tracks how it performs in real customer conversations after launch, including the new questions and edge cases that pre-launch testing can’t fully cover.
Which metrics should you track for customer support AI agents?
No single metric is enough to judge customer support AI agents. Look at conversation volume, independent handling rate, handoff rate, resolution, and satisfaction together, and check whether answers actually drew on knowledge and tools.
Why is my AI Agent handing off more conversations to human agents?
A rising handoff rate can come from new types of customer questions, gaps in the knowledge base, a Tool that isn’t being called, or incomplete Skill logic. Narrow it down by AI Agent, channel, and question type first, then review the actual conversations to confirm the cause. Sometimes the handoff is the right outcome, because the request was outside what the AI Agent is designed to handle.
Can I check AI Agent performance data without building reports?
Yes. In Sobot AI Agents, “Ask AI for Data” lets you ask about AI Agent performance in plain language, such as “How many conversations did the AI Agent handle on its own last week?”, and returns the matching metric and result.
Does Ask AI for Data replace the Data Center in Sobot AI Agents?
No. The Data Center is still where you verify results, review conversation details, and dig deeper. Ask AI for Data gives you a faster way to reach an answer without hunting for the right report first. It only uses data already registered in the system that your account has permission to access, and it won’t draw unverified conclusions about causes from a single number.
Keep Improving Your AI Agent After Launch
An AI Agent working with real customers faces new phrasing, new types of questions, and new edge cases every day. No amount of pre-launch setup and testing can cover them all, which is why AI Agent performance monitoring has to continue after launch.
An AI Agent working with real customers faces new phrasing, new types of questions, and new edge cases every day. No amount of pre-launch setup and testing can cover them all, which is why AI Agent performance monitoring has to continue after launch.
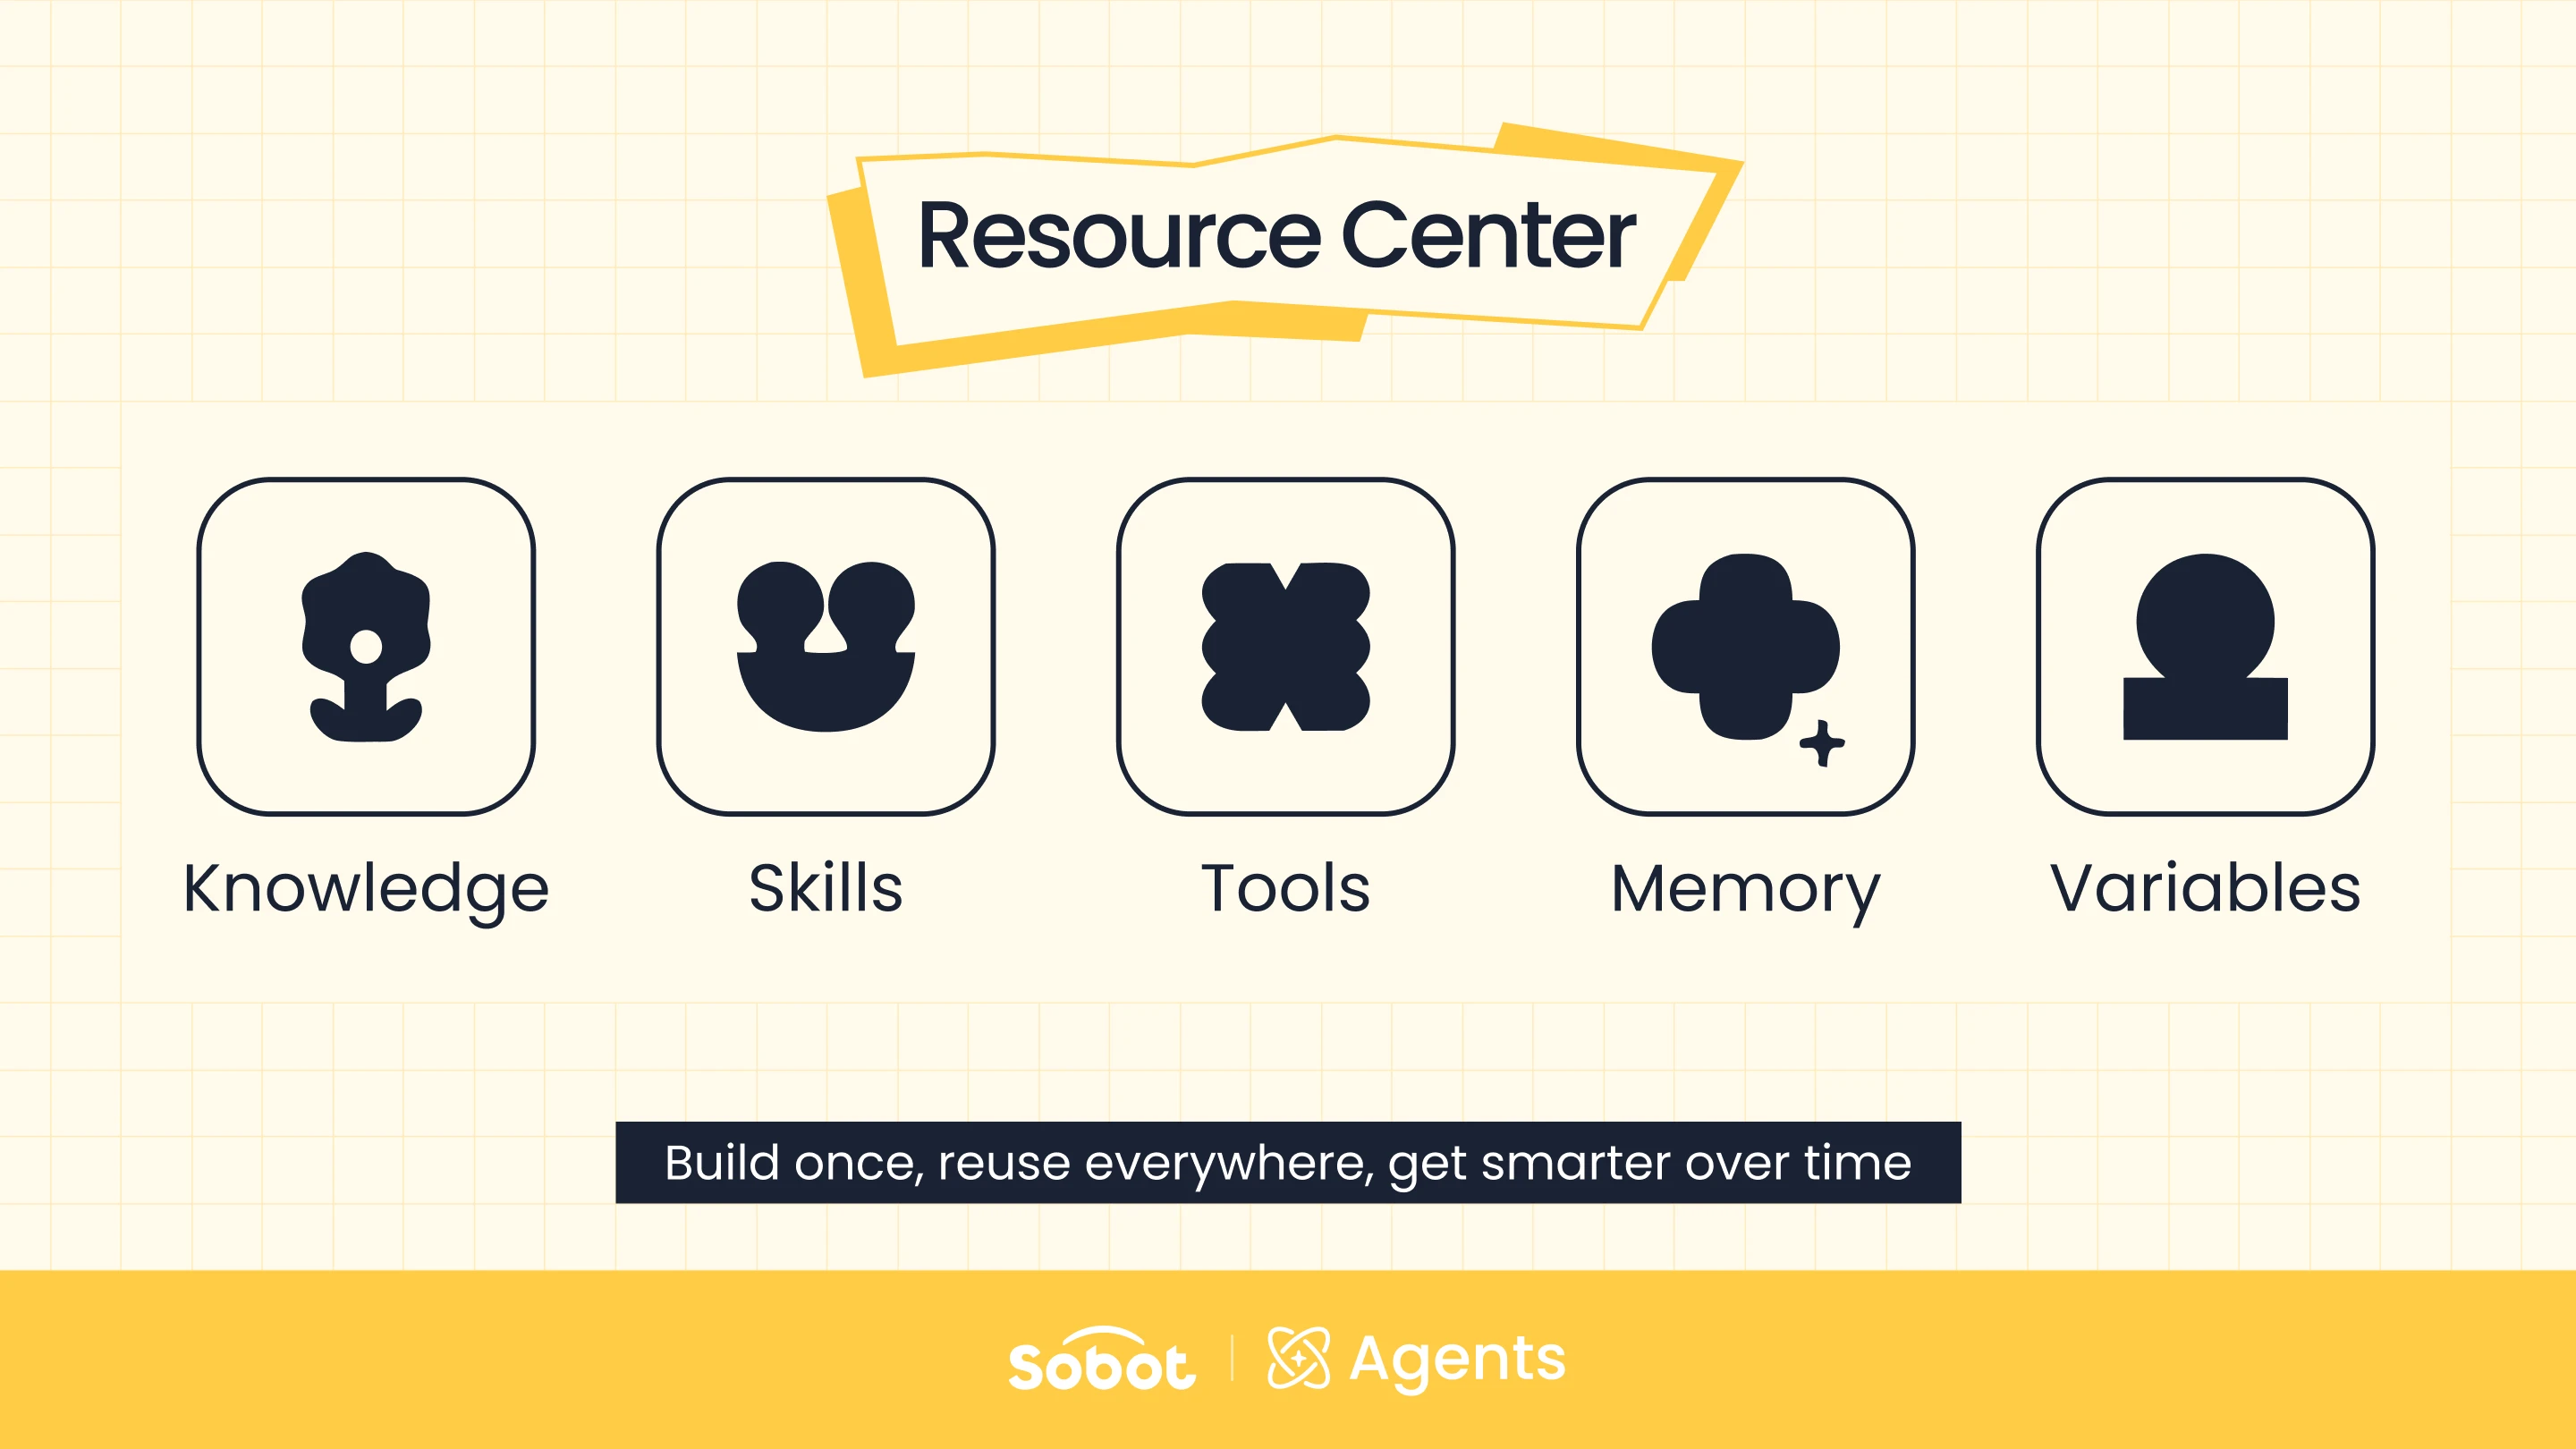
In Sobot AI Agents, monitoring is one part of a closed loop. The Resource Center stores Knowledge, Skills, Workflows, Tools, Memory, and Variables. [AI Studio] combines them into an AI Agent. The Evaluation Center tests it before launch, and MCP connects it to external systems. Once it’s live, the Data Center and Ask AI for Data show how it performs with real customers, and each finding feeds back into the AI Agent’s setup. Build, test, launch, monitor, fix, and test again — this loop turns an AI Agent from a one-time launch project into something your team can continuously monitor, verify, and improve.
Want to see how your AI Agent performs with real customers? Start a free trial or book a demo of Sobot AI Agents.