Understanding What Makes a Good Net Promoter Score

Net Promoter Score (NPS) measures how likely your customers are to recommend your business to others. It serves as a powerful indicator of customer satisfaction and loyalty. Research highlights its effectiveness in predicting growth. For example:
- Companies with high NPS often achieve faster revenue growth, as shown in studies by Reichheld.
- Even slight improvements in NPS can yield significant business gains, according to Bain & Company.
You may wonder, what is considered a good net promoter score? A score above 0 is positive, above 50 is excellent, and scores above 70 are exceptional. However, context matters. In healthcare, an average NPS of 34 is strong, while communication industries average around 19. Comparing your score within your industry provides a clearer picture.
"A score of 30 might be poor in one sector but outstanding in another. Always evaluate NPS relative to your industry benchmarks."
By understanding these nuances, you can better interpret your NPS and use it to guide strategies for improving customer satisfaction. Sobot can help you achieve this with its innovative solutions.
What Is a Net Promoter Score and How Is It Calculated?

Definition of Net Promoter Score
Net Promoter Score (NPS) is a customer loyalty metric introduced by Fred Reichheld in 2003. It measures how likely your customers are to recommend your business, product, or service to others. NPS has become a widely recognized tool across industries for assessing customer satisfaction and predicting growth.
The concept revolves around a simple question: "How likely are you to recommend this company/product/service to a friend or colleague?" Responses are rated on a scale from 0 to 10, categorizing customers into three groups. This straightforward approach makes NPS easy to implement and interpret, helping you understand customer sentiment and loyalty.
How NPS Is Measured (Promoters, Passives, Detractors)
To calculate NPS, you first categorize respondents based on their answers to the NPS survey:
- Promoters (9-10): These are your loyal customers who actively recommend your business.
- Passives (7-8): These customers are satisfied but not enthusiastic enough to promote your brand.
- Detractors (0-6): These are unhappy customers who may discourage others from engaging with your business.
This categorization helps you identify areas for improvement. Promoters drive growth, while Detractors highlight pain points that need attention. Passives, though neutral, represent an opportunity to convert them into Promoters.
| Category | Score Range | Description |
|---|---|---|
| Promoters | 9-10 | Loyal customers who are likely to recommend. |
| Passives | 7-8 | Satisfied but unenthusiastic customers. |
| Detractors | 0-6 | Unhappy customers who may harm the brand. |
The Formula for Calculating NPS
The formula for calculating NPS is simple:
NPS = % Promoters - % Detractors
For example, if 50% of respondents are Promoters and 20% are Detractors, your NPS score would be 30. This score ranges from -100 to +100, where a positive score indicates customer loyalty and satisfaction.
Here’s a practical example:
| Category | Count | Percentage |
|------------|-------|------------|
| Promoters | 10 | 50% |
| Passives | 6 | 30% |
| Detractors | 4 | 20% |
Calculation: NPS = % Promoters - % Detractors = 50% - 20% = +30
By understanding how to calculate NPS, you can track customer sentiment over time and benchmark your scores against industry averages. This insight helps you refine strategies to improve customer satisfaction and loyalty.
What Is Considered a Good Net Promoter Score?
Universal Standards for NPS (e.g., above 0, 50, 70)
Understanding what is considered a good net promoter score starts with universal standards. These benchmarks provide a general framework for interpreting your NPS score.
| NPS Score Range | Interpretation |
|---|---|
| Below 0 | Significant issues to address |
| 0 to 30 | Good range, room for improvement |
| Above 30 | Company is doing great, more happy customers than unhappy ones |
A score below zero indicates that your business has more detractors than promoters. This suggests significant challenges in customer satisfaction. Scores between 0 and 30 reflect a positive but moderate level of customer loyalty. If your score exceeds 30, it means your customers are generally happy and likely to recommend your business.
For companies aiming for excellence, a score above 50 is often seen as a good NPS score. Achieving a score above 70 places you in the "world-class NPS" category, a level that only a few businesses reach. These thresholds serve as a starting point, but you should always consider additional factors like industry benchmarks and customer expectations.
Tip: While aiming for a high NPS score, focus on actionable insights from detractors and passives to drive continuous improvement.
The Role of Industry Benchmarks in Defining 'Good'
A good net promoter score varies significantly across industries. Comparing your NPS to industry benchmarks helps you understand your position in the market. For example:
- The relative method of evaluating NPS scores involves comparing them to industry averages.
- Benchmarking NPS against competitors provides a clearer picture of your performance.
- Average industry scores differ widely, making it essential to contextualize your NPS score.
For instance, an internet service provider might consider a score above zero as good, while a luxury retailer might need a score above 50 to meet customer expectations. Geographic location and customer demographics also influence how NPS scores are interpreted.
Note: Always evaluate your NPS in relation to your industry and customer base. This ensures your goals align with market realities.
Examples of NPS Benchmarks Across Industries
Industry-specific benchmarks provide valuable insights into what qualifies as a good NPS score. The table below highlights median, top quartile, and bottom quartile NPS scores across various sectors:
| Industry Type | Median NPS (2023) | Top Quartile NPS (2023) | Bottom Quartile NPS (2023) |
|---|---|---|---|
| Professional Services | +50 | +73 (or higher) | +19 (or lower) |
| Technology | +40 | +64 (or higher) | +11 (or lower) |
| Consumer Goods | +50 | +72 (or higher) | +21 (or lower) |
These benchmarks illustrate how expectations differ across industries. For example, professional services often achieve higher scores due to personalized customer interactions. In contrast, technology companies may face challenges related to product complexity, which can lower their average NPS.
Other factors, such as emotional engagement and customer perception, also play a role. Business-to-business (B2B) companies often see lower scores compared to business-to-consumer (B2C) companies because emotional connections tend to be stronger in consumer markets.
Insight: Use industry benchmarks to set realistic goals for your NPS. This helps you focus on meaningful improvements rather than chasing unattainable targets.
By understanding these benchmarks, you can better assess your NPS performance and identify areas for growth. Whether you operate in professional services, technology, or consumer goods, benchmarking NPS provides a roadmap for enhancing customer satisfaction and loyalty.
Factors That Influence a Good NPS Score

Survey Design and Timing
The way you design and time your surveys plays a crucial role in shaping your NPS scores. A poorly designed survey can lead to inaccurate results, while timing affects response rates and customer sentiment. Mixed-mode surveys, which combine different administration methods, often produce varied outcomes. For example:
- Telephone surveys tend to yield higher scores compared to web-form surveys.
- Response patterns can shift slightly, but these small changes may exaggerate results due to the net scoring method.
Timing matters too. Surveys conducted immediately after a customer interaction capture fresh emotions, while delayed surveys may reflect more measured opinions. To ensure reliable NPS scores, focus on designing clear, unbiased questions and choosing the right timing for your audience.
Customer Tolerance and Expectations
Customer tolerance levels and expectations significantly impact NPS ratings. Industries with low tolerance, such as streaming services or ride-sharing platforms, often see lower scores when customer needs go unmet. On the other hand, high-tolerance sectors experience more leniency in NPS scores.
| Customer Tolerance Level | NPS Score Impact | Industry Example |
|---|---|---|
| Low Tolerance | Lower NPS scores if needs are unmet | Netflix, Uber |
| High Tolerance | More leniency in NPS scores | High-tolerance industries |
Understanding your customers’ tolerance levels helps you set realistic goals for achieving a good net promoter score. Tailor your strategies to meet their expectations and improve customer satisfaction.
Cultural and Regional Differences in NPS
Cultural and regional factors also influence NPS scores. Hofstede’s Cultural Dimensions provide insights into how cultural differences shape customer behavior. High-context cultures, such as Japan, often give moderate scores due to indirect communication styles. In contrast, low-context cultures, like the United States, tend to show more polarized scores.
Regional variations reflect deeper differences in customer expectations. For example:
- Customers in high-context cultures may hesitate to give extreme ratings.
- Low-context cultures often express opinions more directly, leading to higher or lower scores.
To interpret NPS accurately, consider cultural and regional nuances. Localized strategies help you align with customer expectations and improve customer satisfaction across diverse markets.
How Sobot’s Voice/Call Center Can Help Improve Your Net Promoter Score
Collecting Actionable Customer Feedback
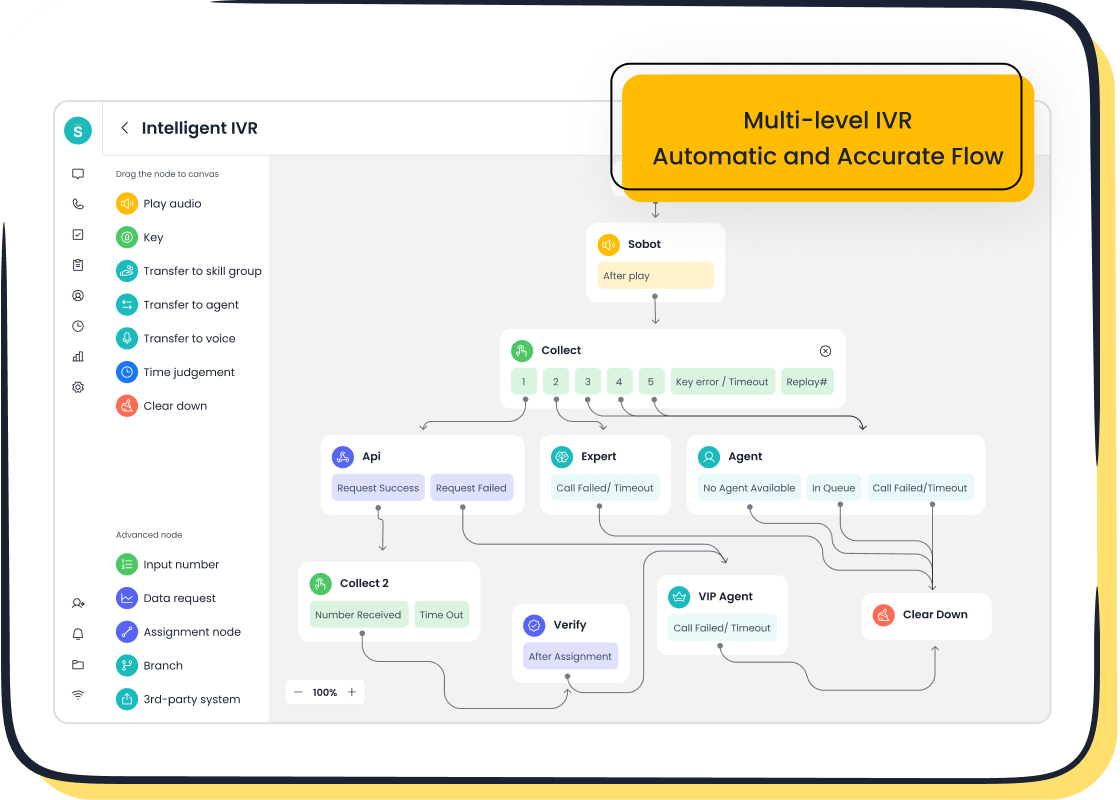
Gathering meaningful feedback is essential for improving your NPS. Sobot’s Voice/Call Center provides tools to collect detailed insights from your customers. Its intelligent IVR system allows you to design customized surveys that capture specific feedback. For example, you can ask customers about their satisfaction immediately after a call. This ensures you receive real-time responses while their experience is still fresh.
The platform also integrates seamlessly with CRM systems, enabling you to consolidate customer data. This unified view helps you identify recurring issues and prioritize improvements. By analyzing call recordings and transcripts, you can uncover patterns in customer concerns. These insights allow you to address pain points effectively, turning detractors into promoters.
Tip: Use Sobot’s AI-powered analytics to categorize feedback into actionable themes. This helps you focus on areas that have the greatest impact on customer satisfaction.
Closing the Loop with Customers
Closing the feedback loop is a proven way to boost your NPS. Sobot’s Voice/Call Center makes it easy to follow up with customers after they share their feedback. For instance, you can use its bulk outbound task feature to automate follow-up calls. This ensures every customer feels heard and valued.
Responding quickly to feedback has measurable benefits:
- Companies that reply within 48 hours see a 6-point increase in NPS.
- Businesses that close the loop reduce churn by at least 2.3%, while those that don’t experience a 2.1% increase in churn.
Sobot’s smart call routing ensures that follow-ups reach the right agents, improving resolution rates. The platform’s global number availability also allows you to connect with customers across different regions. This personalized approach strengthens trust and loyalty, driving higher NPS scores.
Training Teams to Deliver Better Customer Experiences
Your team’s ability to handle customer interactions directly impacts your NPS. Sobot’s Voice/Call Center equips your agents with the tools they need to excel. The unified workspace provides a comprehensive view of customer history, enabling agents to offer personalized solutions.
Training becomes more effective with Sobot’s real-time monitoring and analysis features. Supervisors can listen to live calls and provide immediate feedback to agents. This helps your team refine their communication skills and resolve issues more efficiently.
The platform’s AI-powered voicebot also plays a role in training. It handles routine inquiries, allowing agents to focus on complex cases. This reduces their workload and enhances their problem-solving abilities. As a result, your team delivers consistently high-quality service, improving customer satisfaction and loyalty.
| Metric | Value |
|---|---|
| Reduction in inbound discussion | 20% |
| Increase in positive feedback | 96%+ |
| Customer Satisfaction Score (CSAT) | 97% |
| Problem Resolution Rate | 85% |
These results demonstrate how Sobot’s Voice/Call Center empowers your team to create exceptional customer experiences. By investing in training and technology, you can achieve a higher NPS and build lasting relationships with your customers.
Using Data Analytics to Identify and Address Pain Points
Data analytics plays a pivotal role in improving your Net Promoter Score (NPS). By analyzing customer data, you can uncover hidden pain points that impact customer satisfaction and loyalty. These insights allow you to take targeted actions that enhance the overall customer experience.
Why Data Analytics Matters for NPS
Understanding your customers' needs and challenges is essential for improving their experience. Traditional market research often falls short because it lacks the depth needed to identify recurring issues. Customer experience (CX) analytics bridges this gap by providing a comprehensive view of the customer journey. It combines quantitative data, like survey responses, with qualitative insights, such as call transcripts or feedback comments. This approach helps you pinpoint the root causes of dissatisfaction.
Example: A retail company used CX analytics to discover that delayed shipping was a major pain point. By addressing this issue, they improved their NPS by 15 points within six months.
How Data Analytics Identifies Pain Points
Here are some ways data analytics helps you identify and address customer pain points:
- Customer Preferences: Analytics reveals what your customers value most, enabling you to tailor products and services to their needs. Personalized experiences foster loyalty and drive higher NPS.
- Recurring Issues: By analyzing feedback trends, you can identify common complaints. For example, frequent mentions of long wait times in call center transcripts highlight an area needing improvement.
- Customer Journey Insights: CX analytics maps the entire customer journey, showing where friction occurs. This visibility helps you focus on the moments that matter most to your customers.
Addressing Pain Points with Sobot’s Solutions
Sobot’s Voice/Call Center equips you with advanced tools to leverage data analytics effectively. The platform offers real-time monitoring and call tracking, allowing you to analyze customer interactions in detail. Features like AI-powered voicebots and intelligent IVR systems collect valuable data during calls. This data helps you identify patterns and recurring issues.
For instance, Sobot’s analytics dashboard categorizes feedback into actionable themes. If customers frequently mention difficulty navigating your website, you can prioritize improving its usability. By resolving these pain points, you not only enhance customer satisfaction but also boost your NPS.
The Impact of Resolving Pain Points
Addressing customer pain points has a direct impact on your NPS. When you resolve issues, customers feel valued and appreciated. This fosters loyalty and increases retention rates. Satisfied customers are more likely to recommend your business, contributing to positive word-of-mouth referrals.
| Benefit | Impact on NPS |
|---|---|
| Resolving pain points | Higher customer satisfaction |
| Personalized experiences | Increased customer loyalty |
| Improved retention rates | Positive word-of-mouth growth |
By using data analytics to identify and address pain points, you create a better experience for your customers. This not only improves your NPS but also strengthens your brand reputation.
Tip: Use Sobot’s AI-powered analytics to continuously monitor customer feedback. Regular analysis ensures you stay ahead of potential issues and maintain high levels of customer satisfaction.
Why NPS Is a Valuable Tool for Customer Success
Tracking Customer Loyalty Over Time
Net Promoter Score (NPS) provides a reliable way to monitor customer loyalty over time. By consistently measuring NPS, you can identify trends that reveal how your customers feel about your business. Longitudinal studies, such as those by Keiningham et al., show a strong correlation between NPS and revenue growth. This connection highlights how tracking loyalty can predict long-term success.
You can use NPS surveys to capture customer sentiment at different stages of their journey. For example, collecting feedback after product purchases or service interactions helps you understand how loyalty evolves. Regular tracking also allows you to spot early signs of dissatisfaction, giving you the opportunity to address issues before they escalate.
Tip: Use NPS data to create loyalty programs that reward promoters and engage passives. This strategy strengthens relationships and encourages repeat business.
Identifying Opportunities for Growth
A strong NPS score doesn’t just reflect customer satisfaction—it also uncovers opportunities for growth. Businesses with high NPS often experience increased referrals, higher retention rates, and more cross-selling opportunities. Statistical case studies illustrate this impact clearly:
| Case Study | Evidence | Impact |
|---|---|---|
| Heineken | Promoters grew Gross Profit at three times the rate of Detractors | Gross Profit Growth |
| Philips | NPS increase linked to 70% revenue growth; decline linked to 24% revenue shrinkage | Revenue Growth/Shrinkage |
| DFS | A one pp increase in NPS corresponds to a 0.5% increase in annual revenue | Revenue Increase |
| Bain and Company | NPS leaders outperform Vanguard Total Stock Index: 10.1x to 3.6x value over 10 years | Long-term Growth |
These examples show how improving NPS can directly impact your bottom line. By analyzing feedback from promoters, you can identify what drives their loyalty and replicate those strategies across your business. Similarly, addressing detractors’ concerns helps you reduce churn and unlock new growth opportunities.
Building Stronger Customer Relationships
NPS serves as a powerful tool for building stronger customer relationships. It helps you identify at-risk customers early, allowing you to address their concerns and reduce churn. Engaging promoters through personalized communication fosters loyalty and increases their lifetime value.
You can also use NPS feedback to optimize your products and services. For example, insights from surveys highlight features that customers love and areas needing improvement. This information guides product development and enhances usability, creating a better experience for your audience.
Callout: Strengthen relationships by using NPS data to improve customer support. Positive feedback can inspire new initiatives, while negative comments highlight areas for service enhancement.
By leveraging NPS, you create a cycle of continuous improvement. Satisfied customers become loyal advocates, driving referrals and boosting your reputation. Over time, these relationships contribute to sustainable growth and long-term success.
A good Net Promoter Score (NPS) reflects more promoters than detractors, with scores above 50 considered excellent and above 70 deemed world-class. However, context matters. Industry benchmarks and customer expectations shape what qualifies as "good." For example, professional services often achieve higher NPS due to personalized interactions, while technology sectors face unique challenges.
Improving your NPS requires actionable steps. Collect feedback, close the loop with customers, and address pain points using tools like Sobot’s Voice/Call Center. Its intelligent IVR and AI-powered analytics help you gather insights, resolve issues, and enhance customer experiences. Businesses like HotelTonight have used NPS to prioritize features, achieving a score of 75. Similarly, nurturing promoters can drive growth, as they are four times more likely to repurchase and seven times more likely to try new products.
Tip: Use NPS as a continuous improvement tool. It not only tracks loyalty but also uncovers opportunities for growth, helping you build stronger customer relationships.
By leveraging NPS effectively, you can transform customer feedback into actionable strategies, ensuring long-term success and loyalty.
FAQ
What is the ideal frequency for conducting NPS surveys?
You should conduct NPS surveys quarterly or after key customer interactions. This helps you track changes in customer sentiment and identify trends over time. Regular surveys ensure you stay updated on customer feedback and can act quickly to address concerns.
Can NPS be used for small businesses?
Yes, NPS works well for businesses of all sizes. It provides valuable insights into customer loyalty and satisfaction. Small businesses can use NPS to identify areas for improvement and build stronger relationships with their customers.
How does Sobot’s Voice/Call Center improve NPS?
Sobot’s Voice/Call Center collects real-time feedback, analyzes customer interactions, and resolves issues efficiently. Its intelligent IVR and AI-powered analytics help you address pain points, close feedback loops, and enhance customer experiences, leading to higher NPS scores.
Is a high NPS always necessary for success?
Not always. A high NPS indicates strong customer loyalty, but context matters. Compare your score to industry benchmarks and focus on improving customer satisfaction. Even small improvements in NPS can drive significant business growth.
How can I turn detractors into promoters?
Engage detractors by addressing their concerns quickly. Use Sobot’s tools to analyze feedback, resolve issues, and follow up with personalized communication. Satisfied detractors often become loyal promoters when they feel valued and heard.
See Also
Essential Strategies to Enhance Live Chat Customer Experience
Comparative Review of Leading Voice of Customer Tools
Improving Call Center Efficiency Through Effective Monitoring
