What is a Knowledge Graph and Why It Matters
A knowledge graph represents data in a structured way by connecting entities and their relationships. This approach helps you understand how different pieces of information relate to each other. For example, a customer and their purchase history can be linked, providing a clear context for personalized service.
Knowledge graphs play a vital role in customer service. They enhance data integration, making it easier to unify information from multiple sources. This improves decision-making and operational efficiency. Companies like LinkedIn have reduced resolution times by nearly 30% using knowledge graphs, proving their value in streamlining customer support. Tools like Sobot's AI Chatbot leverage this technology to deliver accurate, 24/7 assistance, ensuring better customer experiences.
Core Concepts of a Knowledge Graph
Nodes and Edges
Defining nodes as entities in a knowledge graph
In a knowledge graph, nodes represent entities. These entities can be anything meaningful, such as a customer, a product, or even a location. For example, in a customer service system, a node might represent a customer, while another node could represent their purchase history. By defining entities as nodes, you create a clear structure that makes it easier to organize and retrieve information. This approach helps you focus on the "who" or "what" within your data.
Understanding edges as relationships between entities
Edges in a knowledge graph define the relationships between nodes. These relationships explain how entities connect. For instance, an edge might show that a customer "purchased" a product or "visited" a store. By mapping these relationships, you gain insights into how different pieces of data interact. This interconnected structure reduces the time spent searching for information and improves operational workflows.
Relationships and Context
How relationships provide meaning to data
Relationships in a knowledge graph add meaning to raw data. They help you understand how entities interact. For example, a hospital network uses a knowledge graph to link patient histories with treatments, enabling faster and more accurate diagnoses. Similarly, an investment firm connects market trends to identify risks and opportunities. These relationships transform isolated data points into actionable insights, enhancing decision-making.
The role of context in enhancing data interpretation
Context enriches the interpretation of data in a knowledge graph. It allows you to see the bigger picture. For example, a global retailer uses context to link customer preferences with product data, improving personalized recommendations. This semantic understanding enables AI systems to interpret data more effectively, leading to smarter decisions and better outcomes.
Ontologies and Taxonomies
The role of ontologies in structuring knowledge graphs
Ontologies provide a framework for organizing entities and their relationships in a knowledge graph. They define rules and categories, making the graph machine-actionable. For example, ontologies allow you to create complex queries, such as finding all customers who purchased a specific product in the last month. This structure enhances data integration and search capabilities.
Taxonomies as classification systems for organizing entities
Taxonomies classify entities into hierarchical groups, simplifying data organization. For instance, a taxonomy might group products into categories like "electronics" or "apparel." This classification helps you navigate large datasets efficiently. By integrating diverse data sources into a unified view, taxonomies enable richer insights and more accurate search results.
Data Integration in Knowledge Graphs
Combining data from multiple sources into a unified graph
A knowledge graph excels at integrating data from diverse sources into a single, unified structure. It connects structured data, like spreadsheets or databases, with unstructured data, such as emails or social media posts. This integration creates a comprehensive view of your information, making it easier to uncover hidden patterns and relationships. For example, a retail company might combine customer purchase histories, website interactions, and social media feedback into one graph. This unified approach allows you to analyze customer behavior more effectively and tailor your services to meet their needs.
Knowledge graphs also act as integration hubs. They unify disparate datasets and enrich them with context, enabling better analytics and decision-making. By linking data from various sources, you can achieve a complete view of your information. This not only improves data governance but also enhances your ability to make informed decisions.
Benefits of data integration for customer service platforms like Sobot
For customer service platforms like Sobot, integrating data into a knowledge graph offers significant advantages. It allows you to unify customer data from multiple channels, such as emails, live chats, and phone calls, into a single source of truth. This unified view helps your team respond to customer inquiries faster and with greater accuracy.

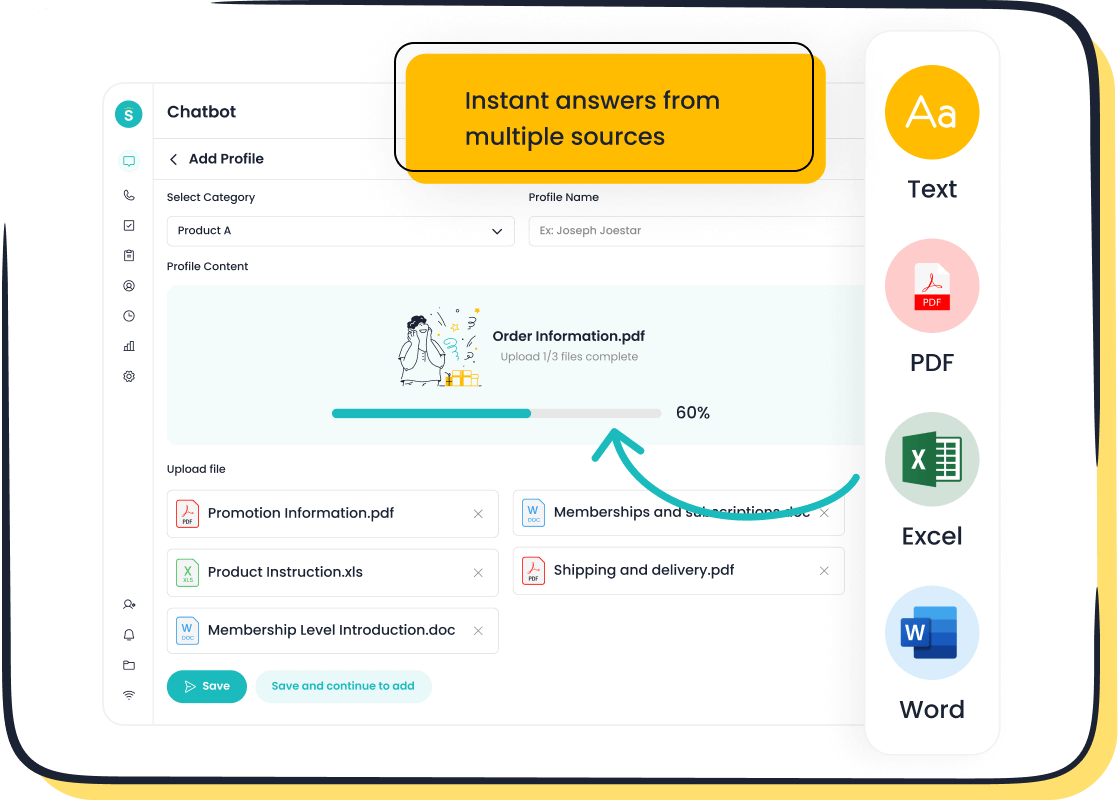
Sobot's AI Chatbot leverages knowledge graphs to deliver seamless customer experiences. By integrating data from various sources, the chatbot provides instant, accurate responses to customer queries. For instance, it can pull information from a knowledge base built on articles, PDFs, and text snippets to resolve issues autonomously. This capability not only reduces response times but also improves customer satisfaction.
Additionally, knowledge graphs enhance operational efficiency. They enable platforms like Sobot to automate workflows and streamline processes. For example, Sobot helped OPPO integrate global customer channels and business systems, eliminating data silos. This integration improved OPPO's chatbot resolution rate to 83% and boosted customer satisfaction.
By combining data into a unified knowledge graph, you can transform fragmented information into actionable insights, driving better outcomes for both your business and your customers.
How Knowledge Graphs Work
Data Collection and Structuring
Gathering data from diverse sources for graph creation
Creating a knowledge graph begins with collecting data from various sources. These sources can include structured formats like databases, semi-structured formats like XML files, or unstructured formats such as emails and social media posts. Advanced techniques like natural language processing (NLP) and information extraction (IE) help identify entities and relationships within the data. For instance, an optimized workflow using tools like NVIDIA NeMo has shown remarkable efficiency in extracting entity-relation triples from academic datasets. This process ensures that your knowledge graph captures a wide range of information, making it a comprehensive resource for analysis.
Structuring data into nodes, edges, and relationships
Once the data is collected, it must be structured into nodes, edges, and relationships. Nodes represent entities, such as customers or products, while edges define the relationships between them, like "purchased" or "reviewed." Ontologies and schemas play a crucial role in organizing this data, ensuring consistency and coherence. Open-source tools like Neo4j and Apache Jena simplify this process by providing a robust infrastructure for managing graph databases. By structuring your data effectively, you create a knowledge graph that is both intuitive and actionable.
Querying and Reasoning
Using queries to extract insights from knowledge graphs
Querying a knowledge graph allows you to uncover valuable insights by navigating its interconnected structure. Graph query languages like SPARQL or Cypher enable you to search for specific entities or relationships. For example, you can query a graph database to find all customers who purchased a particular product within the last month. Metrics like precision and recall measure the accuracy and completeness of these queries, ensuring reliable results. This capability empowers you to make data-driven decisions with confidence.
Reasoning to derive new knowledge and improve decision-making
Reasoning takes querying a step further by enabling you to infer new knowledge from existing data. For instance, if a customer frequently purchases a specific product category, the graph can suggest related items they might like. This process enhances decision-making by identifying patterns and predicting trends. Advanced reasoning methods also help detect inconsistencies within the graph, ensuring data integrity. By leveraging reasoning, you can transform your knowledge graph into a dynamic tool for innovation and growth.
Knowledge Graph Visualization
Visualizing relationships and entities for better understanding
Visualization makes it easier to understand the complex structures within a knowledge graph. By representing entities as nodes and relationships as edges, you can quickly identify patterns, clusters, and hierarchies. Interactive features like zooming and panning allow you to focus on specific areas of the graph, enhancing your ability to explore and analyze data. Visualization not only simplifies complex information but also aids in effective communication, making it accessible to diverse audiences.
Tools and techniques for effective graph visualization
Several tools and techniques enhance the visualization of knowledge graphs. Platforms like Gephi and Neo4j offer user-friendly interfaces for creating interactive visualizations. These tools support features like node expansion and relationship filtering, enabling you to uncover hidden connections. Visualization also facilitates decision-making by presenting data in an intuitive format. For example, Sobot's AI Chatbot uses knowledge graph visualization to provide clear, actionable insights, improving customer support efficiency.
Knowledge Graph Use Cases in Customer Service
Enhancing Customer Support with Knowledge Graphs
How Sobot's Chatbot leverages knowledge graphs for 24/7 support
Sobot's AI Chatbot uses a knowledge graph to deliver round-the-clock customer support. By connecting entities like customer profiles, purchase histories, and FAQs, the chatbot provides instant and accurate responses. For example, when a customer asks about a product warranty, the chatbot retrieves the relevant information from the graph without delay. This seamless interaction ensures that your customers receive consistent support, even outside business hours. The chatbot’s multilingual capabilities further enhance its usability, allowing it to serve a global audience effectively.
Improving query resolution rates with structured data
Structured data within a knowledge graph improves query resolution rates by organizing relationships between entities. For instance, Sobot's chatbot leverages structured data to identify patterns in customer queries, enabling faster and more precise responses. Companies like LinkedIn have achieved a 30% reduction in resolution time by using knowledge graphs in customer service. This efficiency not only enhances customer satisfaction but also reduces the workload on human agents, allowing them to focus on complex issues.
Streamlining Customer Interactions
Using knowledge graphs to unify customer data across channels
A knowledge graph unifies customer data from various channels, such as emails, live chats, and social media. This integration creates a single source of truth, enabling you to provide consistent and personalized service. Sobot’s solutions excel in this area by connecting entities like customer interactions and preferences. For example, when a customer switches from email to live chat, the graph ensures that their history remains accessible, allowing agents to pick up where the conversation left off. This unified approach improves efficiency and builds trust with your customers.
Examples of improved customer experiences with Sobot solutions
Sobot’s knowledge graph-powered tools have transformed customer experiences across industries. For instance, OPPO integrated Sobot’s chatbot and ticketing system to handle repetitive queries, achieving an 83% chatbot resolution rate. This integration also streamlined global customer channels, reducing data silos and improving satisfaction rates. Other companies have reported similar success, with knowledge graphs enabling quick access to relevant information and personalized recommendations.
Optimizing Knowledge Bases
Automating knowledge base updates with AI-driven graphs
Knowledge graphs automate the maintenance of knowledge bases by linking entities and relationships dynamically. Sobot’s AI-driven solutions simplify this process by extracting data from sources like articles and PDFs. This automation reduces manual effort and ensures that your knowledge base stays up-to-date. For example, Sobot helped OPPO cut maintenance efforts by 90%, allowing their team to focus on enhancing customer service quality.
Case study: OPPO's success with Sobot's knowledge graph integration
OPPO’s collaboration with Sobot showcases the power of knowledge graphs. By integrating Sobot’s chatbot and optimizing their knowledge base, OPPO achieved remarkable results. The chatbot resolved 83% of queries autonomously, while the knowledge base updates became 90% more efficient. These improvements led to a 94% positive feedback rate and a 57% increase in repurchase rates. This case highlights how knowledge graphs can drive both operational efficiency and customer satisfaction.
Why Knowledge Graphs Matter
Enhanced Data Understanding
Connecting data points for deeper insights
A knowledge graph connects data points to reveal deeper insights. By linking entities and their relationships, it uncovers patterns that traditional databases often miss. For example, in healthcare, knowledge graphs integrate patient histories, treatment paths, and research data. This integration accelerates medical discoveries and improves patient care by identifying hidden connections. Similarly, in finance, they map transaction networks to detect risks and enhance compliance. These capabilities make knowledge graphs indispensable for industries that rely on complex data analysis.
Providing context to raw data for better decision-making
Raw data often lacks context, making it difficult to interpret. A knowledge graph adds semantic meaning by defining relationships between entities. For instance, a retailer can link customer preferences with product data to generate personalized recommendations. This contextual understanding enables you to make informed decisions quickly. Knowledge graphs also improve data governance by clarifying how datasets relate to each other, enhancing accessibility and compliance. Their ability to provide context transforms isolated data into actionable knowledge.
Improved Decision-Making
Enabling data-driven strategies in customer service
Knowledge graphs empower you to implement data-driven strategies in customer service. By connecting customer interactions, demographic details, and purchase histories, they create a comprehensive view of each customer. This holistic perspective allows platforms like Sobot to deliver personalized support. For example, Sobot’s AI Chatbot uses a knowledge graph to analyze customer queries and provide accurate responses. This approach not only improves customer satisfaction but also boosts operational efficiency.
Reducing uncertainty with structured and interconnected data
Uncertainty in decision-making often stems from fragmented data. A knowledge graph eliminates this issue by structuring and interconnecting data. In agriculture, for instance, knowledge graphs analyze relationships between soil types, crops, and weather patterns. This analysis provides precise insights, enabling better planning and resource allocation. Similarly, in healthcare, they integrate real-world data to support clinical decisions. By reducing uncertainty, knowledge graphs enhance the reliability of your strategies.
Scalability and Flexibility
Adapting to growing data needs in customer support
As your data grows, a knowledge graph adapts seamlessly. Its flexible structure accommodates new entities and relationships without disrupting existing data. Companies like eBay use knowledge graphs to handle diverse service-level requirements, from quick search queries to in-depth analysis. This scalability ensures that your customer support system remains efficient, even as data volumes increase. Sobot’s solutions leverage this adaptability to unify customer data across channels, providing consistent and scalable support.
Supporting diverse use cases across industries like retail and finance
Knowledge graphs excel in supporting diverse industry needs. In retail, they enhance product recommendations by linking customer preferences with inventory data. In finance, they uncover relationships between accounts to combat money laundering. IBM’s Knowledge Graph Framework demonstrates this versatility by enabling businesses to build custom graphs tailored to their specific requirements. This flexibility makes knowledge graphs a valuable tool for industries ranging from healthcare to entertainment.
A knowledge graph connects entities and their relationships, transforming raw data into meaningful insights. Its core concepts, such as nodes, edges, and ontologies, create a structured framework for understanding and organizing information. This structure enables efficient information retrieval, pattern recognition, and scalability, making it a powerful tool for modern customer service.
In customer support, knowledge graphs provide context to customer issues, enabling faster and more accurate resolutions. They also enhance machine learning models, improving natural language processing and recommendation systems. For example, Sobot's AI Chatbot uses a knowledge graph to unify customer data across channels, delivering 24/7 multilingual support. This approach has helped companies like OPPO achieve an 83% chatbot resolution rate and a 94% positive feedback rate.
By leveraging the power of knowledge, you can enhance customer interactions, streamline operations, and drive better outcomes for your business.
FAQ
What is a knowledge graph?
A knowledge graph organizes data into nodes (entities) and edges (relationships). It connects information to provide context and meaning. For example, Sobot’s AI Chatbot uses knowledge graphs to link customer profiles with purchase histories, enabling accurate and instant responses. Learn more about knowledge graphs here.
How does a knowledge graph improve customer service?
A knowledge graph unifies customer data across channels, creating a single source of truth. Sobot’s solutions use this structure to deliver personalized support, reduce response times, and enhance customer satisfaction. For instance, OPPO achieved an 83% chatbot resolution rate using Sobot’s knowledge graph integration.
Can knowledge graphs handle multilingual data?
Yes, knowledge graphs can manage multilingual data effectively. Sobot’s AI Chatbot leverages this capability to provide 24/7 support in multiple languages. This feature ensures seamless communication with customers worldwide, improving accessibility and satisfaction.
How do knowledge graphs automate workflows?
Knowledge graphs automate workflows by linking entities and relationships dynamically. Sobot’s AI-driven solutions optimize processes like ticket routing and knowledge base updates. For example, OPPO reduced manual maintenance efforts by 90% through Sobot’s automated knowledge graph system.
Are knowledge graphs scalable for growing businesses?
Knowledge graphs adapt to growing data needs effortlessly. Their flexible structure accommodates new entities and relationships without disrupting existing data. Sobot’s solutions scale with your business, ensuring consistent support as your customer base expands.
See Also
Understanding Voice Analytics Technology in Call Centers
Shopify Live Chat: Experiences from Real Users
Comparing Genesis Call Center and Genesys Solutions
