How to Interpret Net Promoter Scores for Business Growth

Understanding how your customers feel about your business is essential for growth. The net promoter score (NPS) is a simple yet powerful metric that measures customer loyalty by asking, "How likely are you to recommend us?" This single question reveals valuable insights into your customer experience. Businesses with high NPS scores often grow over twice as fast as their competitors. Loyal customers spend up to 67% more, and promoters are five times more likely to repurchase. So, what is a good net promoter score? By interpreting NPS effectively, you can identify areas to improve and enhance satisfaction. Tools like Sobot's solutions can help you act on these insights to boost retention and drive success.
What Is Net Promoter Score (NPS)?

Definition and Purpose of NPS
Net Promoter Score (NPS) is a metric designed to measure customer loyalty and satisfaction. It is calculated based on a single question: "How likely are you to recommend us to a friend or colleague?" Customers respond on a scale from 0 to 10, with scores grouped into three categories: promoters (9-10), passives (7-8), and detractors (0-6). By subtracting the percentage of detractors from promoters, businesses arrive at their NPS score.
The purpose of NPS extends beyond simple measurement. It provides a snapshot of customer sentiment and predicts future behavior. Research shows that NPS correlates with customer retention, revenue growth, and overall satisfaction. For example, companies with higher NPS scores often experience better financial performance, as loyal customers are more likely to repurchase and recommend the brand. Regular NPS surveys also help businesses track trends and identify areas for improvement, ensuring a consistent focus on enhancing customer experience.
How NPS Reflects Customer Loyalty
NPS serves as a direct indicator of customer loyalty by capturing how customers feel about your brand. Promoters, who score 9 or 10, are enthusiastic advocates. They drive referrals, spend more, and remain loyal over time. Detractors, on the other hand, are dissatisfied customers who may harm your reputation through negative word-of-mouth. Passives fall in between, offering limited engagement but presenting an opportunity for conversion into promoters.
Empirical studies reinforce the connection between NPS and loyalty. For instance, Reichheld (2006) found that companies with higher NPS scores achieve better revenue growth. Similarly, research by the Temkin Group (2016) revealed that a 7-point increase in NPS correlates with a 1% rise in revenue. These findings highlight the importance of understanding customer sentiment to foster loyalty and drive business growth.
| Study | Findings | Implications |
|---|---|---|
| Reichheld (2003) | NPS measures loyalty based on customer experience | Emphasizes the importance of customer familiarity in NPS assessments |
| Bendle et al. (2019) | Accurate comparisons require recreating NPS scores | Suggests methodological rigor in NPS studies |
| Keiningham et al. (2007) | Satisfaction is comparable to NPS in predicting growth | Challenges the superiority of NPS over traditional metrics |
| Morgan & Rego (2006) | Other loyalty measures are comparable to NPS | Indicates NPS may not be the sole indicator of loyalty |
| Anderson et al. (2004) | Customer satisfaction correlates with growth | Supports the relevance of traditional satisfaction metrics |
Why NPS Is Critical for Business Growth
NPS plays a pivotal role in driving business growth by identifying loyal customers and uncovering areas for improvement. Promoters generate 1.5 times more revenue than detractors and stay with companies 50% longer. In the B2B software sector, businesses with high NPS scores (>70) report 23% higher renewal rates and 13.9% average revenue growth compared to 6.1% for low-NPS companies.
Tracking NPS trends over time allows you to measure the impact of initiatives on customer sentiment. Qualitative feedback from follow-up questions like "Why did you give that score?" provides actionable insights to address pain points. Combining NPS with other metrics, such as customer satisfaction and retention rates, offers a holistic view of performance.
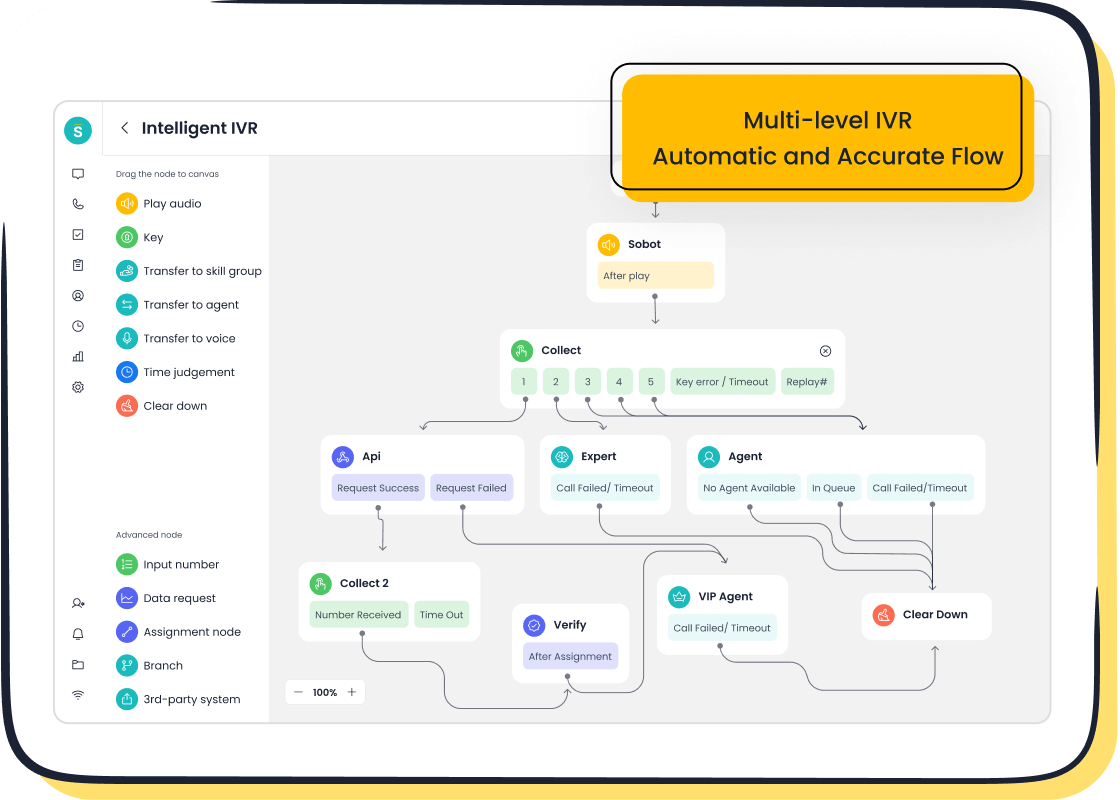
Sobot’s solutions, such as its Voice/Call Center, can help you leverage NPS effectively. With features like intelligent IVR and AI-powered voicebots, Sobot enables businesses to enhance customer interactions and improve satisfaction. By integrating NPS insights into your strategy, you can foster loyalty, boost retention, and achieve sustainable growth.
Tip: Use NPS as a starting point to understand customer sentiment, but combine it with other metrics for a comprehensive view of your business performance.
How to Calculate NPS Score
The NPS Question: "How Likely Are You to Recommend Us?"
The foundation of the net promoter score lies in a single, straightforward question: "How likely are you to recommend us to a friend or colleague?" This question is typically included in an NPS survey and uses a scale from 0 to 10. Customers who respond with higher scores indicate stronger loyalty, while lower scores suggest dissatisfaction.
This question works because it captures the essence of customer sentiment in a simple format. It allows you to gauge how customers perceive your brand and whether they would advocate for it. By asking this question regularly, you can track changes in customer loyalty over time and identify trends that impact your business.
Understanding Promoters, Passives, and Detractors
When analyzing NPS survey responses, you categorize customers into three groups:
- Promoters (9-10): These are your most loyal customers. They actively recommend your brand and contribute to growth through referrals.
- Passives (7-8): These customers are satisfied but not enthusiastic. They are less likely to promote your brand and may switch to competitors if offered better options.
- Detractors (0-6): These customers are unhappy and may discourage others from engaging with your business.
Understanding these categories helps you focus on converting passives into promoters and addressing the concerns of detractors. For example, if 70% of your respondents are promoters, 10% are passives, and 20% are detractors, you can prioritize strategies to reduce detractor percentages and increase promoter loyalty.
The NPS Formula: Subtracting Detractors from Promoters
Calculating your NPS score involves a simple formula: subtract the percentage of detractors from the percentage of promoters. Here's how it works:
- First, categorize responses based on their scores.
- Then, calculate the percentage of promoters and detractors.
- Finally, subtract the detractor percentage from the promoter percentage.
For instance:
- If 80% of respondents are promoters and 10% are detractors, the NPS score is:
To illustrate further, consider the following example:
| Category | Count | Percentage |
|---|---|---|
| Promoters | 70 | 70% |
| Passives | 10 | 10% |
| Detractors | 20 | 20% |
| NPS | 50% |
This calculation provides a clear picture of customer loyalty. A positive NPS score indicates more promoters than detractors, which is a good sign for your business.
Tip: Regularly calculate your NPS score to monitor customer sentiment and measure the effectiveness of your improvement strategies.
What Is a Good Net Promoter Score?
Understanding what is considered a good NPS score is essential for evaluating your business's performance and customer loyalty. While the net promoter score ranges from -100 to 100, its interpretation depends on the context, including industry benchmarks and trends over time.
Interpreting NPS Scores: Good, Bad, and Neutral
NPS scores can be categorized into good, bad, and neutral ranges based on customer sentiment. A bad NPS score (ranging from -100 to 0) indicates that most customers are dissatisfied, which can harm your brand's reputation. A neutral score (1 to 30) suggests that while some customers are satisfied, there is significant room for improvement. A good NPS score (31 to 50) reflects a healthy level of customer satisfaction, common among many companies. Scores above 50 are considered excellent, with businesses in the 71 to 100 range outperforming their competitors.
| NPS Score Range | Interpretation |
|---|---|
| -100 to 0 | Most customers are having a negative experience. |
| 1 to 30 | Acceptable but leaves significant room for improvement. |
| 31 to 50 | Common range for most companies. |
| 50 to 70 | Above average. |
| 71 to 100 | Companies in this range are outperforming their competitors. |
For example, if your NPS score is 45, your business is performing well but still has opportunities to enhance customer satisfaction. On the other hand, a score of -10 signals an urgent need to address customer pain points.
Tip: Regularly monitor your NPS to identify whether your score is improving or declining. This helps you take timely action to enhance customer loyalty.
The Role of Industry Benchmarks in Evaluating NPS
Industry benchmarks provide valuable context for interpreting your NPS. Different sectors have varying customer expectations, which influence what is considered a good score. For instance, the grocery industry averages an NPS of 33.3, while the airline sector lags behind with an average of 11.9. Comparing your score to these benchmarks helps you understand how your business stacks up against competitors.
| Industry | NPS Score |
|---|---|
| Grocery | 33.3 |
| Retail | 32.9 |
| Streaming media | 32.2 |
| Investment Firm | 27.9 |
| Parcel delivery | 27.7 |
| Fast food | 26.6 |
| Social media | 25.3 |
| Wireless | 24.7 |
| Auto | 24.3 |
| Bank | 23.6 |
| Food delivery | 22.9 |
| Insurance | 21.9 |
| Software | 19.5 |
| Computer and tablet makers | 17.8 |
| Hotel | 17.2 |
| Health insurance | 16.1 |
| Utilities | 15.9 |
| Electronics | 14.4 |
| TV/ISP | 12.3 |
| Airlines | 11.9 |
| Car rental | 4.8 |
| Consumer Payments | -0.1 |
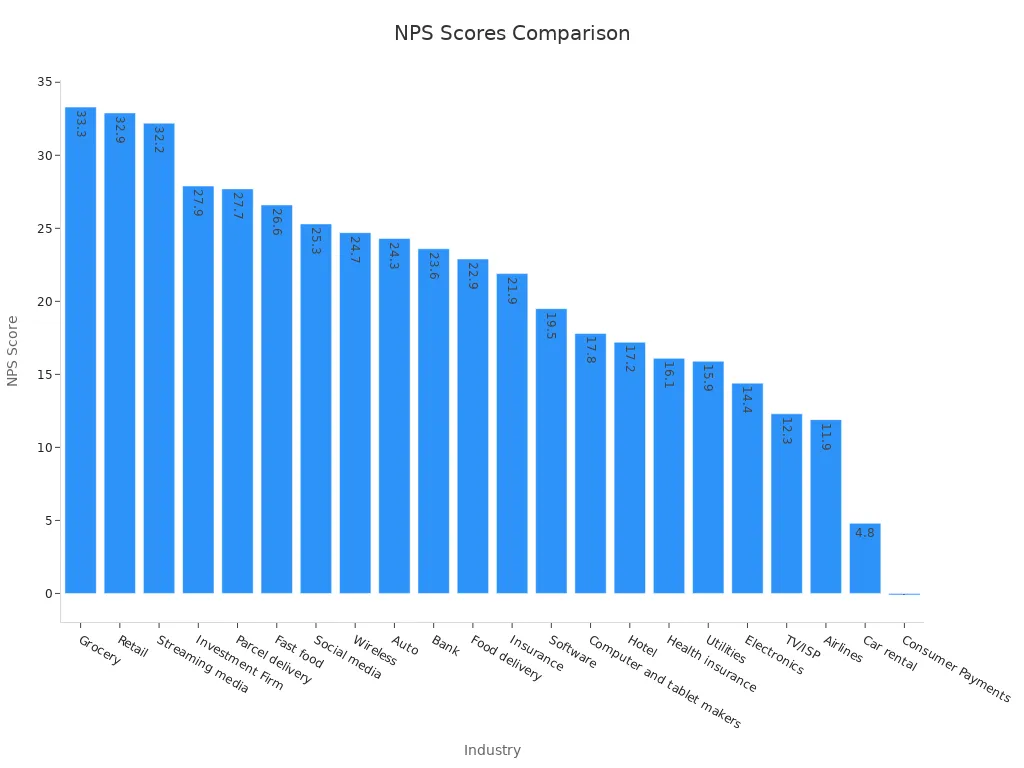
For example, if your business operates in the software industry, an NPS of 20 would be close to the industry average of 19.5. However, achieving a score of 50 would place you well above your peers, signaling exceptional customer loyalty.
Analyzing NPS Trends Over Time for Deeper Insights
Tracking NPS trends over time offers a deeper understanding of customer loyalty. A rising NPS indicates that your strategies are effectively enhancing customer satisfaction, while a declining score signals areas that need immediate attention. Studies like The NPS Journey From Data Collection to Customer Insight emphasize that monitoring changes in NPS helps businesses identify loyalty trends and adjust their strategies accordingly.
| Study Title | Key Insight |
|---|---|
| The NPS Journey From Data Collection to Customer Insight | Monitoring changes in NPS scores indicates customer loyalty trends, with increasing scores suggesting successful loyalty nurturing. |
| Using NPS to Build Customer Loyalty | Analyzing feedback helps identify improvement areas, enhancing customer satisfaction at critical touchpoints. |
| NPS Dashboard: Simplify Customer Loyalty Analysis | Comparing NPS data over time reveals how customer loyalty evolves and the effectiveness of strategies implemented. |

For instance, if your NPS increased from 40 to 55 over six months, it reflects growing customer satisfaction and loyalty. Tools like Sobot’s Voice/Call Center can help you analyze these trends effectively. With features like real-time monitoring and AI-powered voicebots, Sobot enables businesses to gather actionable insights and improve customer interactions. By leveraging these insights, you can refine your strategies to maintain a positive trajectory in your NPS.
Note: Always pair NPS trends with qualitative feedback to understand the reasons behind the changes. This ensures that your actions address the root causes of customer dissatisfaction.
Context Matters: Beyond the Numbers
Understanding the "Why" Behind NPS Scores
NPS scores provide a snapshot of customer loyalty, but understanding the reasons behind those scores is crucial. Without context, the numbers alone can mislead you. For example, cultural influences often shape how customers rate their experiences. In healthcare, NPS may not fully capture patient satisfaction unless you consider factors like cultural expectations or the type of treatment provided. Elective treatments, for instance, tend to yield higher NPS scores compared to general healthcare services.
To uncover the "why" behind your scores, focus on qualitative customer feedback. Ask follow-up questions like, "What influenced your score?" This approach helps you identify specific pain points or areas of excellence. By understanding the context, you can make informed decisions that genuinely improve customer satisfaction.
Combining NPS with Other Metrics for a Holistic View
Relying solely on NPS can limit your understanding of customer sentiment. Combining it with other metrics like CSAT (Customer Satisfaction Score) and CES (Customer Effort Score) provides a more comprehensive view. Each metric offers unique insights:
- NPS measures long-term loyalty and brand perception.
- CSAT evaluates satisfaction with specific interactions.
- CES identifies friction points in the customer journey.
| Metric | Strengths | Weaknesses |
|---|---|---|
| NPS | Measures loyalty and brand perception | May not pinpoint specific issues |
| CSAT | Provides insights into individual touchpoints | May not reflect overall loyalty |
| CES | Identifies friction points in the journey | Limited to transactional interactions |
For example, NPS might reveal that customers are loyal, but CSAT could highlight dissatisfaction with a particular service. Together, these metrics help you close the loop on customer feedback, ensuring your strategies address both broad and specific concerns.
Avoiding Common Pitfalls in NPS Interpretation
Misinterpreting NPS scores can lead to missed opportunities or even harm your business. United Airlines, for instance, faced a PR crisis despite having a respectable NPS. Ignoring detractor feedback allowed unresolved complaints to escalate, damaging their reputation. Similarly, LEGO once focused on expanding beyond its core products, despite high NPS scores. This misstep nearly led to bankruptcy until the company refocused on its strengths.
To avoid these pitfalls, always pair NPS data with qualitative insights. Don’t just aim to improve the score—understand what drives it. Hyatt Hotels initially focused on boosting their NPS without addressing customer feedback, which limited their improvements. By prioritizing the voices of your customers, you can create meaningful changes that enhance loyalty and drive growth.
Tip: Use NPS as a guide, not a goal. Focus on the underlying feedback to make impactful improvements.
Leveraging NPS to Drive Business Growth with Sobot

Identifying Opportunities for Improvement Using NPS
NPS surveys provide valuable insights into customer sentiment, helping you identify areas that need attention. By analyzing customer feedback, you can uncover recurring issues and prioritize solutions that enhance the customer experience. For example, if detractors frequently mention long wait times, you can implement strategies to reduce delays and improve satisfaction.
Sobot’s solutions make this process seamless. With tools like real-time monitoring and AI-powered voicebots, you can gather and analyze NPS data efficiently. These features allow you to pinpoint pain points and address them proactively. Businesses using Sobot have reported impressive results, including a 96% positive feedback rate and a 20% reduction in inbound volume.
| Metric | Value |
|---|---|
| Positive Feedback Rate | 96% |
| Customer Satisfaction Score | 97% |
| Reduction in Inbound Volume | 20% |
| Problem Resolution Rate | 85% |
| Customer Happiness Rate | 99% |
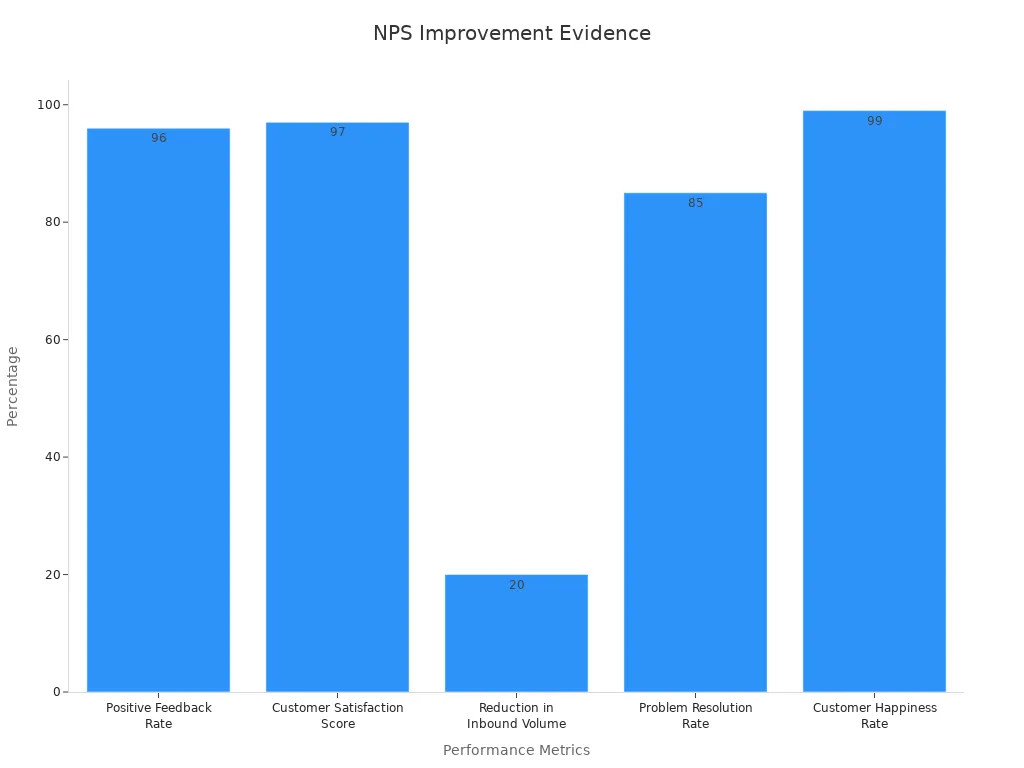
These metrics demonstrate how Sobot’s solutions help businesses improve their NPS and overall customer experience, driving sustainable business growth.
Real-World Examples: How Businesses Like Samsung Use NPS
Samsung’s collaboration with Sobot highlights the power of NPS in transforming customer service. Facing challenges with fragmented communication channels, Samsung adopted Sobot’s all-in-one contact center solution. This integration streamlined operations and improved data connectivity, enabling agents to deliver personalized service.
The results were remarkable. Samsung achieved a 97% customer satisfaction rate and a 30% increase in agent efficiency. By leveraging NPS insights, Samsung identified key areas for improvement, such as reducing repetitive interactions. Sobot’s platform empowered Samsung to address these issues effectively, enhancing the overall customer experience and fostering loyalty.
Actionable Strategies to Improve Customer Experience with Sobot's Voice/Call Center
Improving your NPS starts with actionable strategies. Sobot’s Voice/Call Center offers features designed to elevate the customer experience. Here’s how you can use it:
- Intelligent IVR: Customize call routing to ensure customers reach the right agent quickly.
- AI-Powered Voicebots: Automate repetitive queries, freeing agents to handle complex issues.
- Real-Time Monitoring: Track call performance and identify areas for improvement instantly.
- Global Number Availability: Provide seamless support to customers worldwide.
For example, using Sobot’s smart call routing, you can reduce wait times and improve first-contact resolution rates. These enhancements not only boost your NPS but also strengthen customer loyalty. By integrating these strategies, you can create a more efficient and satisfying customer journey.
Net promoter score serves as a vital tool for measuring customer loyalty and driving business growth. By interpreting NPS in context, you uncover actionable insights that improve customer experience and strengthen retention. Companies that integrate NPS into broader strategies see remarkable results. For example:
| Evidence | Impact |
|---|---|
| Companies that integrate multiple CX metrics see a 20% improvement in customer satisfaction (Gartner) | Improved customer satisfaction |
| Companies that increase their NPS by 10 points see a 10-20% increase in revenue (Bain & Company) | Increased revenue |
| Companies that actively manage customer experience with NPS data increase retention rates by up to 15% (Qualtrics) | Higher retention rates |
| Companies that close the NPS feedback loop see a 3x increase in customer lifetime value | Increased customer lifetime value |

Amazon’s use of NPS highlights its importance. By leveraging NPS insights, Amazon maintains exceptional customer service, fostering loyalty and satisfaction. You can achieve similar results by integrating Sobot’s Voice/Call Center into your strategy. Features like intelligent IVR and AI-powered voicebots help you act on NPS data effectively, ensuring sustainable growth and enhanced customer interactions.
Tip: Use NPS insights to refine your customer experience strategy and build lasting loyalty.
FAQ
What is the ideal frequency for conducting NPS surveys?
You should conduct NPS surveys quarterly or after key customer interactions. This ensures you capture timely feedback and track changes in customer sentiment effectively. Regular surveys help you identify trends and adjust strategies to improve customer loyalty.
Can NPS be used for all industries?
Yes, NPS applies to all industries. However, you should consider industry-specific benchmarks when interpreting scores. For example, a good NPS in the software industry may differ from one in retail. Always compare your score to relevant competitors.
How can I improve my NPS score?
Focus on addressing detractor feedback and enhancing customer experiences. Use tools like Sobot’s Voice/Call Center to reduce wait times and improve service quality. Engage with passives to convert them into promoters by offering personalized solutions and proactive support.
Is a high NPS score always a sign of success?
Not necessarily. A high NPS score indicates strong customer loyalty, but you should also analyze qualitative feedback. Understanding why customers rate you highly ensures you maintain strengths while addressing any hidden issues.
How does Sobot help businesses improve NPS?
Sobot provides tools like intelligent IVR, AI-powered voicebots, and real-time monitoring. These features streamline customer interactions, reduce response times, and enhance satisfaction. By leveraging Sobot’s solutions, you can act on NPS insights to drive growth and loyalty.
Tip: Always pair NPS data with customer feedback to uncover actionable insights and make meaningful improvements.
See Also
Always Available Live Chat Enhances Business Growth
Comparative Analysis of Leading Customer Feedback Tools
Enhancing Call Center Efficiency Through Effective Monitoring
