Improving Business with Customer Satisfaction Indicator Tracking

Tracking indicators of customer satisfaction can transform your business. You boost growth, keep customers loyal, and make your team more efficient. In retail, ecommerce, and enterprise services, customer-facing teams often face challenges like disconnected teams, unclear KPIs, and outdated technology.
| Challenge | Description |
|---|---|
| Disconnected teams | Teams working in silos slow down response times. |
| Unclear KPIs | Teams struggle to measure success without clear indicators of customer satisfaction. |
| Outdated technology | Old systems hurt customer experience and data analysis. |
You see how 61% of customers switch brands after poor service. If you raise retention by just 5%, profits can jump 25% to 95%. Sobot call center and Sobot AI give you the tools to track customer satisfaction and create better customer experiences. Sobot helps you focus on the right indicators of customer satisfaction so you can deliver what matters most.
Business Impact of Customer Satisfaction

Loyalty and Retention
You want your customers to stick around and keep coming back. When you focus on customer satisfaction, you build strong relationships that last. Happy customers are more likely to stay loyal and recommend your business to others.
"Research has shown that the better the fit between a customer’s needs and preferences and the attributes of a service offering, the higher the satisfaction customers report. And the higher the satisfaction customers report, the higher their long-term loyalty."
Here’s what happens when you make customer experience a priority:
- Customers feel valued and understood.
- They return for repeat purchases.
- They share positive feedback with friends and family.
Studies show that businesses using customer engagement platforms create personalized experiences that boost customer loyalty. If you invest in customer service across all touchpoints, you see fewer customers leaving and more coming back. Companies that use proactive customer success programs see a 25% reduction in customer churn and a 15% increase in customer satisfaction. Businesses using customer journey analytics report a 30% drop in customer churn and a 25% rise in satisfaction.
Operational Efficiency
Tracking customer satisfaction helps you run your business more smoothly. You spot problems faster and fix them before they grow. When you standardize work procedures, you reduce errors and save money.
Here’s a table showing how tracking customer satisfaction indicators can improve efficiency:
| Metric | Description |
|---|---|
| Service quality consistency | Measure across all operational periods and shift transitions |
| Customer retention rates | Correlate with specific shift management approaches |
| Revenue fluctuations | Analyze by shift pattern and staffing level |
| Conversion rates | Examine across different service periods and team compositions |
| Staffing density correlations | Examining relationships between team size, wait times, and satisfaction |
Businesses that improve customer experience also see cost savings. For example, a clothing retailer optimized its sales and marketing, leading to lower storage costs and less waste. A professional services firm reduced labor costs and increased client retention by improving productivity.
Actionable Insights
When you track customer satisfaction, you get insights that help you make smart decisions. Instead of guessing, you know exactly what needs fixing. For example, an eCommerce furniture retailer learned that “Paypal isn’t working” was the real reason customers couldn’t check out. Fixing this issue stopped further complaints and improved the customer experience.
Actionable insights help you:
- Respond quickly to problems.
- Align your actions with business goals.
- Track the impact of changes.
- Guide your team on what to improve next.
You get clear, timely information that helps you keep customers happy and reduce customer churn.
Indicators of Customer Satisfaction

What to Track
You want to know what makes your customers happy. You need to track the right indicators of customer satisfaction. These indicators help you see what works and what needs improvement in your business. You can use them to guide your customer support team and make better decisions.
Here’s a table that shows the main indicators of customer satisfaction used across different industries:
| Indicator | Description |
|---|---|
| Satisfaction rate | Measures perceived quality with options for customers to quantify their satisfaction. |
| Net Promoter Score (NPS) | Evaluates the likelihood of customers recommending the brand, reflecting both performance and emotion. |
| Customer Satisfaction Score (CSAT) | A compact measure of satisfaction, often requiring a simple yes/no response or a star rating. |
| Customer Effort Score (CES) | Assesses the effort required by customers to complete a transaction, focusing on operational aspects. |
| Intention to buy again | Reflects customers' past and present experiences, indicating their trust and likelihood of repeat purchases. |
You can use these indicators of customer satisfaction to understand how your customers feel after every interaction. For example, CSAT tells you if a customer liked their last experience. NPS shows if they will recommend your brand to others. CES helps you see if your process is easy or hard for customers.
If you want to improve your customer support, you need to track these indicators regularly. You can spot problems early and fix them before they become bigger issues. You also learn what makes your customers come back and buy again.
Why Indicators Matter
You might wonder why you should track more than one indicator. Each one gives you a different view of your business. If you only look at CSAT, you might miss out on other important signals. For example, CSAT is a lagging indicator. It shows how customers felt after an interaction, but it may not tell you about problems before they happen.
Here’s a quick list of reasons why tracking multiple indicators of customer satisfaction is important:
- CSAT reflects customer sentiment after an interaction, but it may not provide timely insights into customer issues.
- Relying only on CSAT can lead to missed opportunities for addressing customer frustrations before they escalate.
- Using multiple metrics like NPS alongside CSAT gives you a more complete picture of customer satisfaction.
Let’s compare how CSAT, NPS, and CES work in practice:
| Metric | Focus | Timing | Predictive Value |
|---|---|---|---|
| CES | Effort required to accomplish a task | Immediately after an interaction | Strong predictor of future behavior |
| CSAT | Satisfaction with a specific experience | After specific touchpoints | Reflects short-term satisfaction |
| NPS | Overall customer loyalty and brand perception | Consistently at key moments | Highest predictive value for future revenue and word-of-mouth growth |
- CES measures effort and is best for immediate feedback on service effectiveness.
- CSAT captures satisfaction with specific interactions and is useful for short-term insights.
- NPS evaluates overall loyalty and is ideal for long-term customer sentiment tracking.
When you track these indicators of customer satisfaction, you see how they connect to your business results. High satisfaction levels lead to increased spending. Satisfied customers come back and buy again. Positive experiences turn into referrals, which boost your revenue and profitability.
Sobot’s Approach

You want a simple way to track and analyze indicators of customer satisfaction. Sobot makes this easy with its Voice/Call Center features. You get access to over 300 statistical reports and thousands of indicators. This gives you one of the most comprehensive views in the industry.
Here’s a table showing some of the features Sobot offers for tracking and analyzing customer satisfaction:
| Feature | Description |
|---|---|
| Comprehensive Reports | Sobot provides over 300 statistical reports with thousands of indicators, making it one of the most comprehensive in the industry. |
| Omnichannel AI | Covers every touchpoint in customer engagement, ensuring a seamless experience. |
| Scenario-based AI | Tailored specifically for E-Commerce and Retail, enhancing customer interactions. |
| Multi-faceted AI | Includes AI Agent, Copilot, and Insight for diverse customer service needs. |
| Generative AI | Powered by multiple advanced LLMs, integrating with technologies like OpenAI and Amazon Bedrock. |
| Secure AI | Ensures data privacy and compliance, addressing customer concerns about data security. |
Sobot’s Voice/Call Center lets you track indicators of customer satisfaction in real time. You can see how your customer support team performs. You get instant feedback on calls, chats, and tickets. The system helps you spot trends and make changes fast.
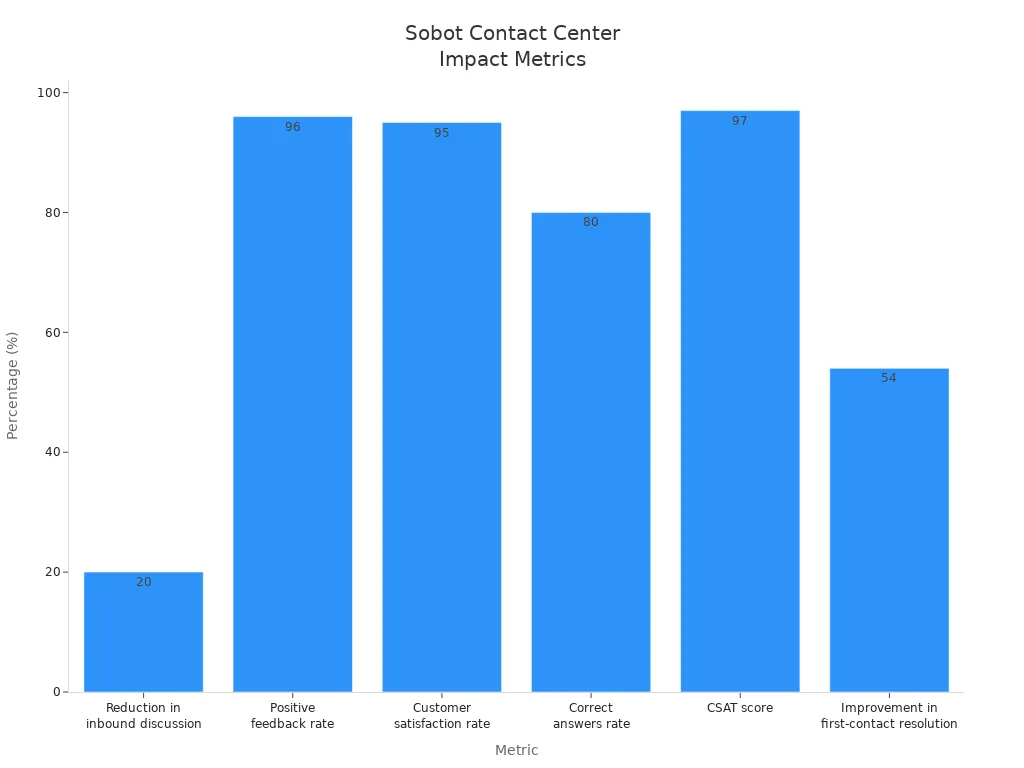
Many businesses have seen big improvements after using Sobot. For example, companies report a 20% reduction in inbound discussions and a 96% positive feedback rate. The customer satisfaction rate reaches 95%. The CSAT score goes up to 97%. First-contact resolution improves by 54%. You can see these results in the chart below:
When you use Sobot, you get a unified workspace for your customer support team. You can monitor calls, analyze data, and automate tasks. The platform supports global telephony contacts and integrates with your CRM. You also get AI-powered voicebots that recognize customer intent and provide smart responses.
If you want to improve your indicators of customer satisfaction, Sobot gives you the tools and insights you need. You can make your customer support team more efficient and keep your customers happy.
Key Customer Satisfaction Metrics
Understanding customer satisfaction metrics helps you see what your customers really think about your business. When you track the right customer service metrics, you can spot problems, improve your service, and keep your customers coming back. Let’s break down the most important customer satisfaction metrics you should know and use.
Net Promoter Score (NPS)
Net Promoter Score, or NPS, measures how likely your customers are to recommend your business to others. You ask one simple question: “How likely are you to recommend us to a friend or colleague?” Customers answer on a scale from 0 to 10. You group the responses like this:
- Promoters (9-10): Love your brand and spread the word.
- Passives (7-8): Satisfied but not enthusiastic.
- Detractors (0-6): Unhappy and may discourage others.
You calculate NPS by subtracting the percentage of Detractors from the percentage of Promoters. The result can range from -100 to 100.
Tip: Any score above 0 is good. Scores above 50 are excellent. If you hit 70 or higher, you’re world-class.
Here’s how NPS looks across different industries:
| Industry | Average NPS | Classification |
|---|---|---|
| Insurance | 80 | Excellent |
| Financial Services | 75 | Excellent |
| Consulting | 60s | Good |
You want to know how your NPS stacks up. Compare your score to industry averages. This helps you see where you stand and where you can improve.
Best practices for NPS:
- Keep your survey short and easy to complete.
- Use follow-up questions to learn why customers gave their score.
- Check your competitors’ NPS to see how you compare.
- Look at NPS alongside other customer satisfaction metrics for a full picture.
78% of customers will forgive mistakes if you provide quality customer service. 89% are likely to buy again after a positive experience.
Sobot makes NPS tracking simple. You can automate surveys after calls or chats. The platform collects responses in real time and shows you trends on easy-to-read dashboards. Sobot’s AI tools help you spot patterns and take action fast.
Customer Satisfaction Score (CSAT)
Customer Satisfaction Score, or CSAT, tells you how happy customers are with a specific interaction. You usually ask, “How satisfied were you with your experience?” Customers answer with a rating, like 1 to 5 stars or a simple yes/no.
You calculate CSAT by dividing the number of positive responses by the total number of responses, then multiplying by 100 to get a percentage.
| Industry | Average CSAT Score |
|---|---|
| E-commerce | 82% |
| Banking | 75-85% |
| Insurance | 76+ |
| Social Media | 73 |
| Online Travel | 76 |
A high CSAT means your customers are happy with your service. If your score drops, you know something needs fixing.
How to measure CSAT well:
- Ask for feedback right after the interaction.
- Keep your survey short—one or two questions work best.
- Use smart sampling to avoid survey fatigue.
- Respond to feedback so customers know you care.
Sobot’s solutions make CSAT tracking easy. The system uses AI to score every interaction, not just the ones with survey responses. You get real-time insights across voice calls, live chat, and email. Sobot even breaks down CSAT by agent and by category, so you can see where to focus your training.
| Feature | Description |
|---|---|
| Automated Scoring | AI scores 100% of interactions, not just survey responses. |
| Channels Supported | Voice, chat, and email with sentiment analysis. |
| Agent-wise CSAT | See scores for both human and AI agents. |
| CSAT by Category | Find out which issues cause low scores. |
| Real-time Insights | Dashboards show trends and feedback instantly. |
Customer Effort Score (CES)
Customer Effort Score, or CES, measures how easy it is for customers to get what they need from you. You ask, “How easy was it to solve your problem today?” Customers rate the effort, usually from 1 (very difficult) to 7 (very easy).
A good CES falls between 5 and 7. This means your customers find it easy to do business with you.
Why does CES matter? When you make things easy, customers stay loyal. They come back and buy again. If you make things hard, they leave.
| Source | Key Finding |
|---|---|
| Premier Contact Point | Less effort leads to better experiences and higher retention. |
| Support Experience | High-effort experiences stop loyalty growth. |
| Invoca | Only 9% of customers with low-effort interactions leave, 94% repurchase. |
| Infinity Delivers | Reducing effort drives loyalty and spending. |
How to use CES:
- Ask for feedback right after a support call or chat.
- Use the results to find and fix pain points.
- Combine CES with other customer service metrics for a full view.
Sobot automates CES surveys and collects feedback across all channels. The platform uses AI to spot where customers struggle. You get alerts when effort scores drop, so you can act fast.
Other Metrics
You can also track other customer satisfaction metrics to get a complete view of your customer experience. Here are a few more you should know:
- Churn Rate: Shows the percentage of customers who stop using your service. High churn often means customers are unhappy.
- First Contact Resolution (FCR): Measures how often you solve a customer’s issue on the first try.
- Average Handle Time (AHT): Tracks how long it takes to resolve a customer’s issue.
- Customer Lifetime Value (CLV): Estimates how much revenue a customer brings over their relationship with your business.
Tracking these customer service metrics helps you spot trends and make better decisions.
Sobot’s platform brings all your customer satisfaction metrics together. The system uses AI-powered tools to automate data collection and analysis. You get real-time feedback from every channel—voice, chat, email, and more. Sobot calculates scores automatically and shows you clear reports. This helps you make smart choices and improve your customer experience.
When you use Sobot, you don’t have to guess what your customers think. You see the numbers, spot the trends, and know exactly where to improve.
Comparing Customer Satisfaction Metrics
Strengths and Weaknesses
You have a lot of choices when it comes to customer service metrics. Each one gives you a different view of your business. Let’s break down the strengths and weaknesses of the three most popular metrics:
- NPS helps you understand how customers feel about your brand overall. It’s great for measuring loyalty, but it might miss specific problems.
- CSAT shows how happy customers are after a single interaction. You get quick feedback, but it doesn’t always predict if customers will stay with you.
- CES tells you how easy it is for customers to get help or solve a problem. It’s perfect for spotting friction, but it focuses on transactions and might miss emotional satisfaction.
Here’s a quick table to help you compare:
| Metric | What It Measures | Best Use Case | Weakness |
|---|---|---|---|
| NPS | Brand loyalty | Long-term strategy | May overlook details |
| CSAT | Immediate satisfaction | Service touchpoints | Doesn’t predict loyalty |
| CES | Ease of interaction | Process improvement | Limited to transactions |
You can see that using more than one customer service metric gives you a fuller picture.
Choosing the Right Metrics
You want to pick customer service metrics that match your business goals. If you want to track progress, set clear targets and measure over time. Benchmarking against competitors helps you see where you stand. Look at industry standards for guidance.
- Measure with your goals in mind.
- Compare your scores to others in your industry.
- Link your metrics to real customer actions.
When you choose the right customer service metrics, you can improve your business step by step.
Real-World Use Cases
Many companies use customer service metrics to drive real change. For example:
- A client success team used a ticketing system and saw a 40% jump in satisfaction scores.
- Personalized onboarding improved satisfaction by 20% and lowered churn.
- Real-time updates made customers happier and sped up service.
- Starter kits made moving easier for customers, showing empathy and boosting satisfaction.
Samsung is a great example. By using Sobot’s multilingual tools and real-time insights, Samsung reached a 97% customer satisfaction rate. You can see how the right customer service metrics and technology make a big difference.
Tip: Track your customer service metrics regularly. Use the data to guide your team and improve every part of your customer journey.
Implementing Indicator Tracking with Sobot
Tracking customer satisfaction indicators with Sobot can feel simple when you break it down into clear steps. You get the tools you need to set goals, collect data, act on insights, and keep improving your customer experience.
Setting Goals
Start by setting clear goals for your customer satisfaction tracking. Here’s a step-by-step approach you can follow:
- Define specific goals using the SMART method. Make sure your goals are measurable and realistic.
- Involve your whole team—customer service, marketing, product, and leadership. Everyone should know what you want to achieve.
- Use Sobot’s Voice/Call Center and analytics to automate tracking and reporting.
- Communicate your goals so every team member understands why they matter.
- Gather customer feedback through surveys and feedback forms built into Sobot’s platform.
- Look at past data to spot trends in your customer experience.
- Set up regular reviews to check your progress.
- Use Sobot’s dashboards to keep your metrics visible.
- Focus on insights that lead to real improvements.
Tip: When you set clear goals, your team knows what to aim for and how to measure success.
Data Collection
You need accurate data to improve your customer experience. Sobot makes this easy with multiple channels:
- Social media gives you instant, honest feedback from customers.
- Surveys let you ask direct questions about your service.
- Interviews help you dig deeper into what customers want.
Sobot’s unified workspace brings all this data together. You can track calls, chats, tickets, and even WhatsApp messages in one place. This helps you see the full picture of your customer experience.
Acting on Insights
Once you have the data, it’s time to act. Use Sobot’s real-time analytics to spot patterns and fix issues fast. Listen to your customers and offer support across every channel. Personalize the experience using insights from NPS and CSAT scores. Always follow up with customers to show you care.
Best Practices
To get the most out of Sobot’s tools, keep these best practices in mind:
- Experience your own customer journey to find pain points.
- Collect feedback from different sources.
- Integrate all your data for a complete view.
- Track key metrics like NPS, CSAT, and CES.
- Keep improving your process based on what you learn.
With Sobot, you can automate surveys, analyze results, and make changes that boost satisfaction. You create a better customer experience and build loyalty that lasts.
Tracking customer satisfaction indicators gives you a clear path to business growth. Sobot’s solutions help you see what matters most and act fast. You get real results when you:
- Track customer satisfaction scores from every interaction.
- Monitor open rates and response rates to AI-powered messages.
- Evaluate conversion rates from personalized recommendations.
You can unify your customer experience management and make smarter decisions. Sobot makes it easy to start, so you can boost satisfaction and loyalty right away. 🚀
FAQ
How do you choose the best customer satisfaction indicator for your business?
You should look at your goals first. If you want to boost loyalty, use Net Promoter Score (NPS). For quick feedback, try Customer Satisfaction Score (CSAT). Mix different customer satisfaction metrics for a complete view.
Can Sobot track customer satisfaction metrics across multiple channels?
Yes! Sobot collects customer service metrics from voice calls, live chat, email, and WhatsApp. You see all your customer satisfaction indicators in one dashboard. This helps you spot trends and improve service fast.
What is the difference between customer satisfaction metrics like CSAT and NPS?
CSAT measures how happy customers feel after one interaction. NPS shows if customers will recommend your brand. Both customer satisfaction indicators help you understand what works, but NPS looks at long-term loyalty.
How often should you review customer satisfaction indicators?
You should check your customer satisfaction metrics every week or month. Regular reviews help you catch problems early. Many businesses see better results when they track customer service metrics in real time.
Does tracking customer satisfaction indicators really improve business results?
Absolutely! Companies that track customer satisfaction metrics see higher retention and more repeat purchases. For example, Samsung reached a 97% satisfaction rate using Sobot’s tools. You can read more about their story here. 🚀
See Also
Enhancing Call Center Efficiency Through Effective Monitoring
Ten Strategies to Improve Live Chat Customer Experience
Best Practices for Managing Quality in Call Centers
A Comprehensive Guide to Quality Assurance Tools for Call Centers
