20 Customer Care KPIs You Should Be Tracking

In 2025, data-driven decisions separate good service from a great customer experience. Companies with a customer-centric culture are 60% more profitable. This raises an important question for your business.
Are you measuring what truly matters to your customers?
This guide introduces the essential customer service KPIs that provide clarity. These customer service performance indicators help move your team from reactive support to proactive success. Tracking this customer care KPI data, from the Sobot call center to Sobot AI interactions, becomes seamless. The right metrics improve customer service performance and the entire customer experience management journey.
1. Customer Satisfaction Score (CSAT): The Core Customer Care KPI
The Customer Satisfaction Score (CSAT) is the go-to metric for gauging a customer's immediate happiness. It measures satisfaction following a specific interaction with your company. This is a foundational customer care kpi for any service team.
Definition
This metric asks a direct question. You typically send a survey right after a support ticket is closed, a purchase is completed, or a chat ends. The question is simple: "How satisfied were you with your experience today?" Customers usually respond on a scale, such as 1-5 or 1-10.
Importance
CSAT gives you a real-time pulse on your service quality. High satisfaction scores often lead to greater customer loyalty and positive word-of-mouth. Low scores signal problems in your customer experience that you need to address quickly. Improving your Customer Satisfaction Score means providing fast, personalized service. A platform like Sobot's Omnichannel Solution helps you achieve this by unifying all your customer conversations into one place, enabling your team to deliver better service.
For example, global innovator OPPO used Sobot's solutions to streamline its service. The result was a 94% positive feedback rate, a clear indicator of high customer satisfaction.
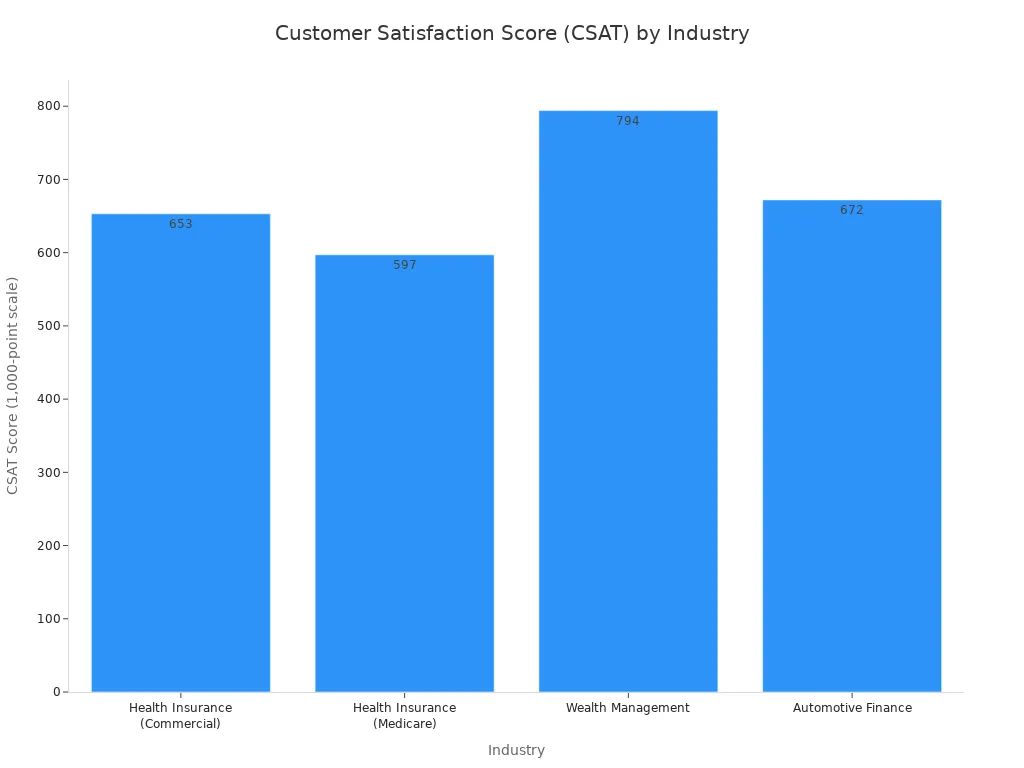
Your target score can vary by industry. Here are some recent benchmarks:
- E-commerce: 82
- Healthcare: 81
- Banks: 78
Different sectors show a wide range of customer satisfaction metrics.
Calculation
You calculate your CSAT score with a straightforward formula. You divide the number of "satisfied" customers by the total number of survey responses. "Satisfied" customers are those who gave a high rating (e.g., 4 or 5 on a 5-point scale).
CSAT Formula:
(Number of Satisfied Customers / Total Number of Survey Responses) x 100 = % of Satisfied Customers
This calculation gives you a simple percentage, making it one of the easiest customer service kpis to track. These customer service performance indicators are vital for your business. This kpi helps you understand your customers better.
2. Net Promoter Score (NPS)
The Net Promoter Score (NPS) measures long-term customer loyalty. It goes beyond single interactions to gauge the overall relationship a customer has with your brand. This metric helps you understand which customers are true fans.
Definition
You measure the Net Promoter Score by asking one simple question:
On a scale of 0 to 10, how likely are you to recommend our company/product/service to a friend or colleague?
Based on their answers, you group customers into three categories:
- Promoters (9-10): These are your most enthusiastic and loyal customers. They are valuable brand advocates.
- Passives (7-8): These customers are satisfied but not enthusiastic. They are vulnerable to competitive offers.
- Detractors (0-6): This group includes unhappy customers. They can damage your brand through negative word-of-mouth.
Importance
NPS is a powerful predictor of business growth. A high score indicates strong customer loyalty, which often leads to repeat business and referrals. Tracking your Net Promoter Score helps you understand your brand's health from the customer's perspective. It shows you how many of your customers are willing to advocate for you. This is one of the most important customer service kpis for measuring long-term success and customer loyalty.
Knowing your score is good, but context is better. Here are some benchmarks for the SaaS industry.
| Category | NPS Score |
|---|---|
| Average SaaS Industry | +36 |
| Good (Bain & Company) | 0 and above |
| Excellent (Bain & Company) | Above 50 |
| World-Class (Bain & Company) | Above 80 |
A higher score signals stronger customer loyalty and a healthier business.
Calculation
Calculating your Net Promoter Score is a two-step process. First, you find the percentage of customers who are Promoters and the percentage who are Detractors. Then, you subtract the percentage of Detractors from the percentage of Promoters.
NPS Formula:
(% of Promoters) - (% of Detractors) = Net Promoter Score
The final score is a number, not a percentage, ranging from -100 to +100.
3. Customer Effort Score (CES)
Customer Effort Score (CES) measures how much work a customer has to put in to get an issue resolved. This metric helps you understand the ease of your customer's service experience. It is one of the most insightful customer service kpis you can track.
Definition
You measure CES by asking your customers a simple question after an interaction. The question focuses on the effort involved.
Example Question: On a scale of 1 (very difficult) to 7 (very easy), how easy was it to handle your request?
A low score means the customer found the process difficult. A high score indicates a smooth, low-effort experience for the customer. You want to make things as easy as possible for your customers.
Importance
Reducing customer effort is a powerful way to build loyalty. Research shows that a difficult service experience is a major cause of disloyalty. In fact, making things easy for your customers is more important than delighting them.
Consider these findings:
- A Harvard Business Review study found that reducing a customer's effort is the best way to increase loyalty.
- Gartner research revealed that 96% of customers who have a high-effort service interaction become more disloyal.
- In contrast, only 9% of customers with low-effort experiences show signs of disloyalty.
A high-effort experience can push customers away. When customers struggle to get help, they often look for easier alternatives. This makes CES an excellent predictor of future purchase behavior. A low-effort score suggests a customer will return, while a high-effort score signals a risk of churn. Tracking this metric helps you pinpoint and fix friction in your customer journey.
Calculation
You calculate your Customer Effort Score by finding the average of all the responses. You simply add up all the scores and divide by the number of customers who responded.
CES Formula:
(Sum of All Scores) / (Total Number of Responses) = Customer Effort Score
The result is a single number that represents the average effort your customers are experiencing. A higher score is better, as it means your service is easy to use.
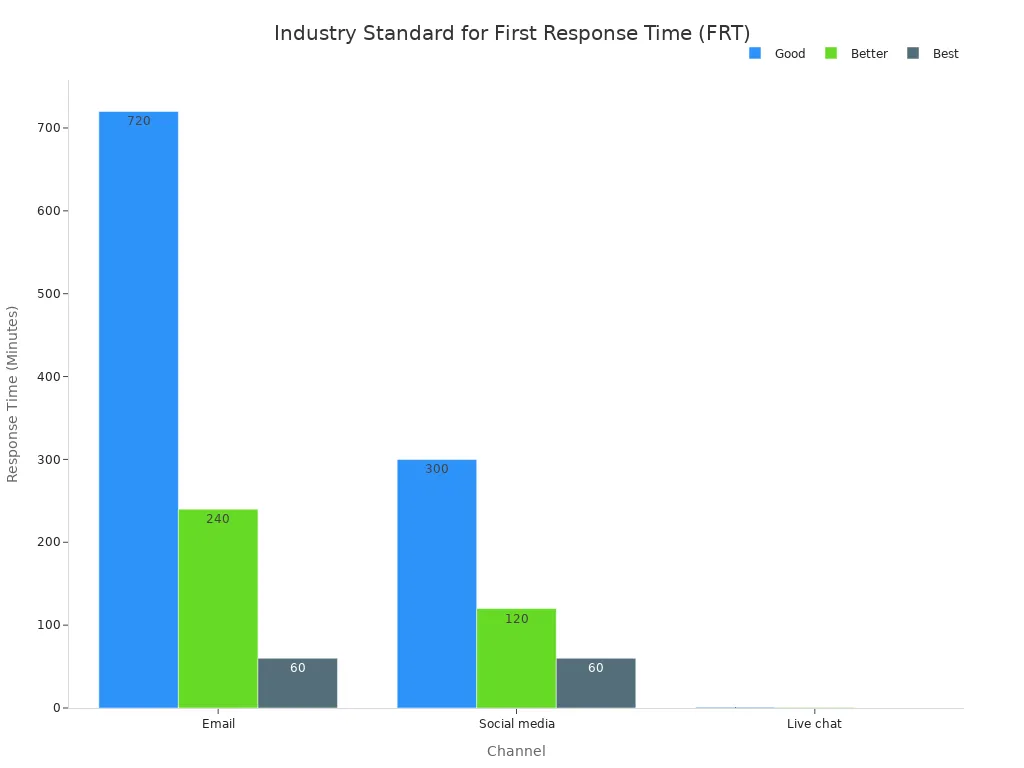
4. First Response Time (FRT)

First Response Time (FRT) is a critical metric that measures the speed of your service. It tracks how long a customer has to wait for an initial reply after reaching out to your support team. A low first response time shows your customers you are attentive and ready to help.
Definition
This metric calculates the average time between when a customer first submits a query and when an agent provides the first response. This applies across all your support channels, including email, live chat, and social media. The clock starts the moment the customer sends their message and stops as soon as your team replies.
Importance
In today's fast-paced world, customers expect quick answers. A long wait can lead to frustration and a poor customer experience. A fast first response time meets modern expectations and sets a positive tone for the entire interaction. It shows every customer that you value their time. This is one of the most important customer service kpis for building initial trust.
Different channels have different expectations for first response time. Your customers will expect a much faster reply on live chat than on email.
Managing multiple channels can make it hard to maintain a low first response time. Tools like Sobot's Omnichannel Solution help you excel here. It brings all your customer messages from every channel into a single, unified workspace. This ensures your agents see every new query instantly, so no customer is left waiting. This streamlined process is key to lowering your first response time and improving your service.
Calculation
You calculate your average first response time by adding up all individual first response times and dividing by the number of tickets resolved. You should measure this within a specific period, like a day or a week.
First Response Time Formula:
(Sum of All First Response Times) / (Total Number of Tickets) = Average First Response Time
Tracking this metric helps you identify delays in your service and make improvements that benefit your customers.
5. Average Handle Time (AHT)

Average Handle Time (AHT) measures the average duration of a single customer interaction. This metric tracks the entire process from the moment a customer initiates contact until the agent completes all related work. It is a key indicator of your team's efficiency.
Definition
AHT includes all parts of the customer interaction. This covers the customer's initial wait time, the conversation itself, and any follow-up tasks an agent must complete after the call or chat ends. These tasks are often called "after-call work." AHT gives you a complete picture of how long it takes to resolve a single customer issue.
Importance
A lower AHT often means your support team is more efficient. This can lead to lower costs and the ability to help more customers. However, you must balance speed with quality. Rushing a customer can lead to a poor experience and unresolved issues. The goal is to reduce AHT without sacrificing service quality.
Here are some effective strategies to improve your AHT:
- Use efficient tools and processes: Equip your team with the right tools. Keyboard shortcuts and macros can streamline workflows and prevent delays. Proper training helps agents use these tools effectively.
- Know the product(s) you’re supporting: Agents with strong product knowledge resolve issues faster. You should route tickets to specialized agents and provide continuous training.
- Make it a goal to resolve in the first contact: Aim for first-contact resolution. Provide complete initial responses and use visual aids to help the customer. This reduces follow-up interactions and lowers AHT for all your customers.
Tracking this metric helps you identify opportunities for agent training and process improvements. It is one of the most important customer service kpis for operational health.
Calculation
You calculate AHT by adding your total talk time, total hold time, and total after-call work time. Then, you divide that sum by the total number of calls or interactions.
AHT Formula:
(Total Talk Time + Total Hold Time + Total After-Call Work) / Total Number of Interactions = Average Handle Time
This formula gives you a clear average time for handling each customer interaction.
6. First Contact Resolution (FCR)
First Contact Resolution (FCR) measures your team's ability to solve a customer issue in a single interaction. This means the customer does not need to call back, email again, or start a new chat for the same problem. It is also commonly known as first call resolution. A successful first call resolution is a win for both your team and your customers.
Definition
This metric tracks the percentage of incoming service requests that are completely resolved during the first contact. The resolution must be final. If a customer has to reach out a second time for the same issue, the initial interaction does not count toward your first call resolution rate. This applies to any support channel you use.
Importance
A high first contact resolution rate is a strong indicator of an excellent customer experience. When you solve a problem on the first try, you show the customer you are efficient and you value their time. This builds trust and loyalty. A low first call resolution rate, on the other hand, creates frustration and increases the effort for your customers.
Improving your first call resolution rate directly impacts customer satisfaction. It is one of the most important customer service kpis because it proves your team is effective. Striving for a high resolution rate is a primary goal.
Goal Setting: Aiming for a world-class first call resolution rate can set your business apart. Only a small percentage of companies achieve this level of service.
Here are some industry benchmarks for first call resolution:
| FCR Rate Category | Percentage |
|---|---|
| Good (Industry Standard) | 70% to 79% |
| World-Class | 80% or higher |
Achieving a world-class first call resolution rate puts you in the top 5% of call centers. This level of resolution makes a huge difference to your customers.
Calculation
You calculate your first contact resolution rate with a simple formula. You divide the number of issues resolved on the first contact by the total number of issues.
First Contact Resolution Formula:
(Total Number of Issues Resolved on First Contact / Total Number of Issues) x 100 = FCR Rate (%)
Tracking your first call resolution helps you understand your team's effectiveness and find areas for improvement.
7. Customer Churn Rate
Customer churn rate is the percentage of customers who stop using your services during a specific time period. This metric, also known as customer attrition, directly measures your ability to retain the customers you worked so hard to acquire. Understanding customer churn is fundamental to sustainable growth.
Definition
Customer churn measures how many customers you lose. You calculate this rate over a set period, such as a month, quarter, or year. A customer is considered "churned" when they cancel their subscription, do not renew a contract, or stop making purchases. Tracking customer churn helps you see how well you are keeping your customers happy and engaged.
Importance
A high customer churn rate is a major red flag. It signals that your customers are not getting the value they expect from your product or service. Losing a customer costs more than acquiring a new one, so high churn directly hurts your revenue and profitability. Monitoring customer churn helps you identify problems in the customer journey before they get out of control. This is one of the most critical customer service kpis for long-term business health.
Note: Even a small reduction in your monthly customer churn can have a huge impact on your annual revenue. It shows your business is building a loyal customer base.
Your ideal churn rate depends on your industry. For SaaS companies, churn rates can vary.
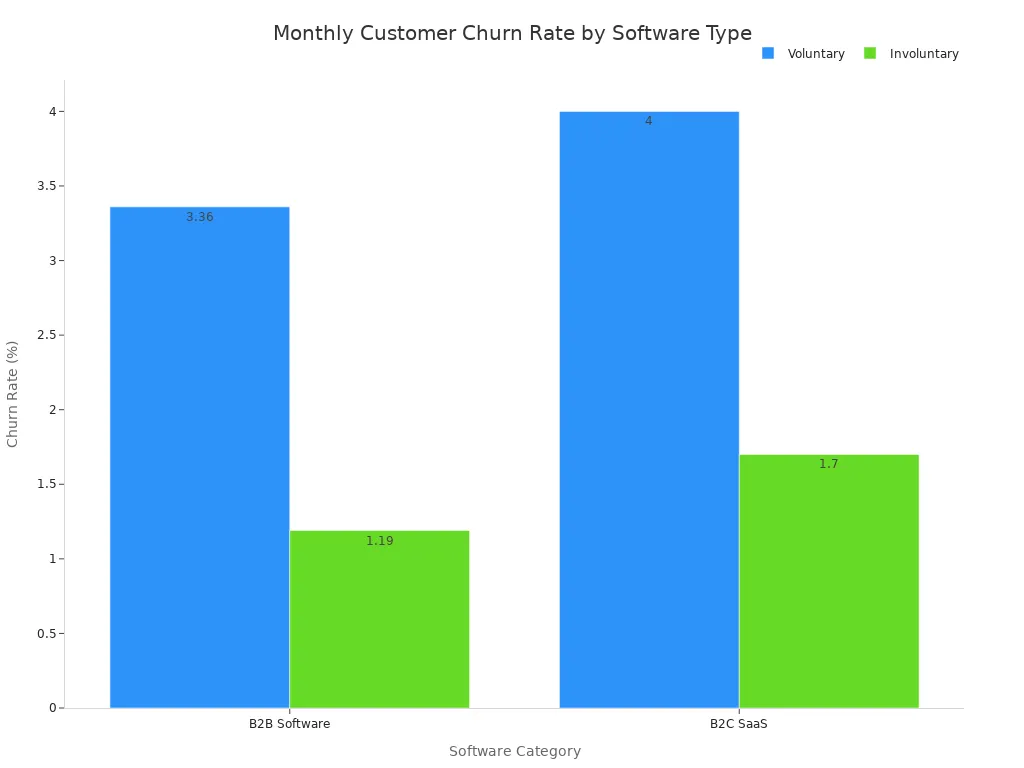
Understanding these benchmarks helps you see how your customer churn compares to others. Reducing customer churn should always be a top priority.
Calculation
You can calculate your customer churn rate with a simple formula. First, decide on the time period you want to measure. Then, use the following steps.
Customer Churn Rate Formula:
(Number of Customers Lost in Period / Number of Customers at Start of Period) x 100 = Customer Churn Rate (%)
For example, if you started the month with 500 customers and lost 25, your customer churn rate for that month would be 5%.
8. Ticket Volume by Channel
Ticket Volume by Channel tracks the total number of support requests your team receives across different communication platforms. This metric helps you understand where your customers are reaching out for help. It is one of the most practical customer service kpis for resource planning.
Definition
This KPI measures the total number of tickets, or support requests, that come from each specific channel. You count the tickets from email, phone, live chat, social media, and any other support channel you offer. You typically track this volume over a set period, like a day, week, or month. This gives you a clear picture of channel popularity among your customers.
Importance
Understanding ticket volume by channel is essential for managing your support team effectively. It shows you which channels your customers prefer. A high volume on one channel tells you where to assign more agents. A low volume on another might mean that channel is less popular or needs better promotion. This data helps you make smart decisions about staffing and resources.
Knowing where your customers are allows you to meet them there. This proactive approach ensures no customer feels ignored and helps you manage agent workload efficiently.
For example, if you see a surge in chat tickets, you know you need more agents available for live chat. If email tickets are low, you might reassign agents to busier channels. This helps you serve each customer better. Analyzing this data helps you understand customer behavior and optimize your support strategy. You can ensure every customer gets the help they need on their preferred platform.
Calculation
Calculating ticket volume by channel is straightforward. You do not need a complex formula. You simply count the number of tickets received through each channel during your chosen time frame.
- Step 1: Choose a time period (e.g., one week).
- Step 2: Count the total tickets from each channel during that period.
For example:
- Email: 500 tickets
- Phone: 350 tickets
- Live Chat: 800 tickets
- Social Media: 150 tickets
This simple count gives you the data you need to analyze channel performance and customer preferences.
9. Average Resolution Time: A Key Customer Service KPI
Average Resolution Time measures the total time it takes for your team to completely resolve a customer issue. This kpi tracks the entire lifecycle of a support ticket, from the moment it is opened until it is marked as "resolved." It is one of the most important customer service performance indicators for gauging team efficiency.
Definition
This metric calculates the average time your agents spend actively working on and resolving customer cases. Unlike Average Handle Time, which focuses on a single interaction, average resolution time covers the entire duration a ticket remains open. This includes any time spent waiting for customer replies or internal follow-ups. A long average resolution time might mean your processes are complex or your agents need more resources.
Importance
A lower average resolution time directly improves the customer experience. Customers want their problems solved quickly. A fast resolution shows your customers that your service is effective and you respect their time. This builds trust and encourages loyalty. Tracking this customer care kpi helps you identify bottlenecks in your support workflow. You can see where delays happen and find ways to make your resolution process more efficient.
A faster resolution for one customer often means your team can help the next customer sooner. This improves overall service capacity and keeps more customers happy.
Monitoring this metric is essential. It helps you understand your team's capacity and the complexity of issues your customers face. This data allows you to set realistic goals and improve your support operations. A good resolution process is key to customer satisfaction.
Calculation
You calculate the average resolution time by adding up the total resolution time for all solved tickets. Then, you divide that sum by the total number of tickets resolved. You should measure this over a specific period.
Average Resolution Time Formula:
(Total Time to Resolution for All Tickets) / (Total Number of Resolved Tickets) = Average Resolution Time
This formula gives you a clear average for how long it takes to achieve a final resolution for your customers. It is one of the most useful customer service kpis for measuring efficiency.
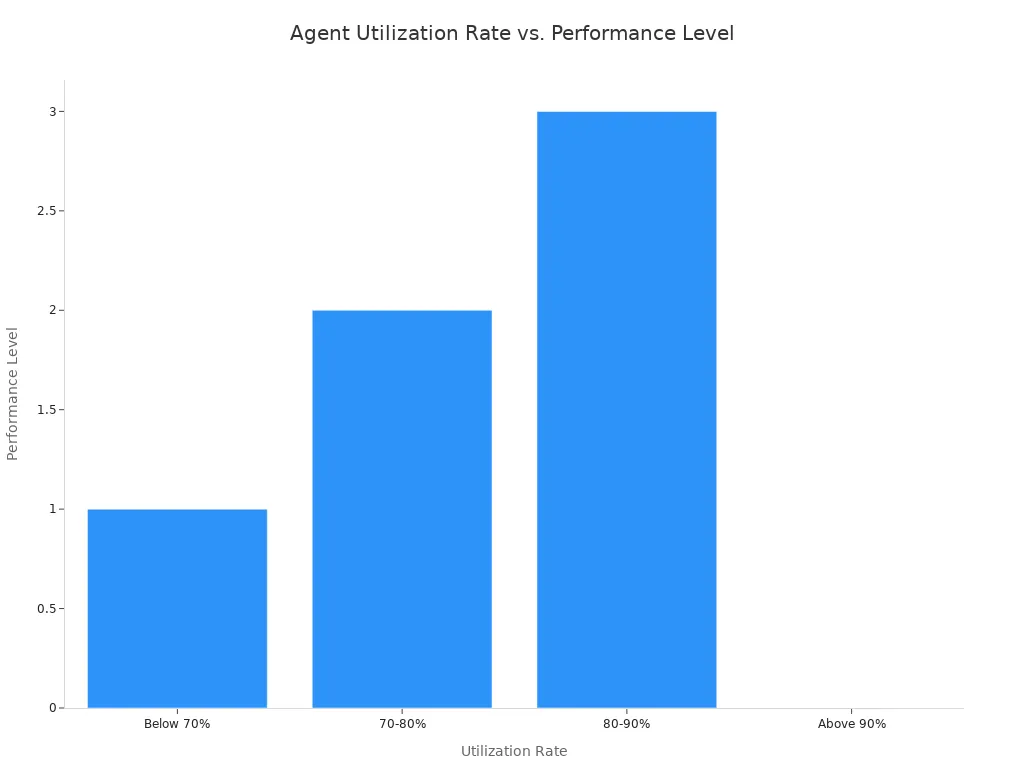
10. Agent Utilization Rate
Agent Utilization Rate measures how much of an agent's logged-in time is spent on work-related activities. This metric helps you understand your team's productivity and capacity. It is one of the most important operational customer service kpis.
Definition
This KPI calculates the percentage of time your agents are actively engaged in handling customer interactions and completing related tasks. This includes talk time, hold time, and after-call work. It compares this productive time against the total time an agent is available to work. It shows you how busy your team truly is.
Importance
Tracking agent utilization helps you find the right balance between productivity and employee well-being. A low rate means your agents are underutilized, which can increase costs. A rate that is too high, however, can lead to serious problems.
A report by HDI shows that when utilization rates approach 60–70%, contact centers often see high agent turnover. Pushing your team too hard can cause burnout.
The goal is to keep agents engaged without overwhelming them. An optimal rate is typically between 75% and 85%. This ensures your customers receive attentive service from a motivated team. Pushing beyond this can hurt the customer experience. High utilization can lead to:
- Decreased call quality
- Increased agent stress and burnout
- Lower customer satisfaction scores
Ultimately, a burned-out agent cannot provide the best service to your customers. Finding the sweet spot is key to efficiency and quality.
This balance ensures each customer gets the attention they deserve from an agent who is ready to help. It protects both your team and the quality of service your customers receive.
Calculation
You calculate the agent utilization rate with a simple formula. You divide the total time an agent spends on work activities by their total available time.
Agent Utilization Rate Formula:
(Total Time Spent on Work Activities / Total Available Time) x 100 = Agent Utilization Rate (%)
This gives you a clear percentage that reflects your team's productivity.
11. Cost Per Contact
Cost Per Contact measures the total expense associated with resolving a single customer inquiry. This metric helps you understand the financial efficiency of your support operations. It is one of the most important financial customer service kpis for any business.
Definition
This KPI calculates the average cost of a single customer interaction. It includes all operational expenses. These costs cover agent salaries, technology and software fees, and overhead related to your contact center. You can calculate this for your entire support operation or for specific channels. This gives you a clear view of where your money is going. Each customer interaction has a price, and this metric tells you exactly what it is.
Importance
Tracking your Cost Per Contact is essential for budget management and strategic planning. It helps you identify your most expensive support channels. This allows you to find opportunities to reduce costs without hurting the customer experience. For many customers, a lower-cost channel can provide a better experience.
Shifting customers to more efficient channels can dramatically lower your expenses. Self-service options, for example, empower customers to find answers on their own. This often leads to faster resolutions for the customer.
Many customers prefer self-service. It gives them control and immediate answers. This shift benefits both your budget and your customers. Look at the cost difference between live agents and self-service.
| Interaction Type | Average Cost Per Contact |
|---|---|
| Live Channels (phone, live chat, email) | $8.01 |
| Self-service Channels (company-run websites, mobile apps) | $0.10 |
This data shows that encouraging self-service can save you a significant amount of money for each customer interaction. It helps you serve all your customers more effectively.
Calculation
You calculate your Cost Per Contact by dividing your total contact center operational costs by the total number of contacts handled. You should measure this over a specific period.
Cost Per Contact Formula:
(Total Operational Costs) / (Total Number of Contacts) = Cost Per Contact
This formula gives you a clear average cost for each time a customer reaches out for help. It is a vital metric for financial health.
12. Customer Retention Rate
The Customer Retention Rate measures the percentage of existing customers who continue to do business with you over a specific period. This metric is the direct opposite of customer churn. While churn tracks the customers you lose, retention celebrates the customers you keep. High retention is a powerful sign of customer loyalty.
Definition
This metric calculates your ability to keep a customer over time. You measure the number of customers who remain with your brand from the start of a period to the end. This does not include any new customers you acquired during that time. A high customer retention rate shows that your existing customers find continuous value in your products and services.
Importance
Strong retention is the foundation of a healthy business. It costs far more to acquire a new customer than to keep an existing one. Loyal customers also tend to spend more and become brand advocates. Focusing on retention is a more profitable strategy than constantly fighting churn. A low retention rate, or high churn, signals that you are failing to build lasting customer loyalty. This is one of the most vital customer service kpis for sustainable growth.
Your ideal retention rate can vary by industry. In e-commerce, for example, the benchmarks show a wide range:
- The average retention rate is around 30-31%.
- Grocery and consumables can see retention as high as 40-65%.
- Luxury goods often have a much lower retention rate, around 9.9%.
Understanding these numbers helps you see how your business compares. Reducing churn and improving retention directly impacts your bottom line and builds stronger customer loyalty.
Calculation
You calculate your customer retention rate with a clear formula. First, you need to define the time period you want to measure.
Customer Retention Rate Formula:
[ ( (Number of Customers at End of Period - Number of New Customers Acquired) / Number of Customers at Start of Period ) ] x 100 = Customer Retention Rate (%)
This formula shows you what percentage of your customer base remained loyal, ignoring the noise from new acquisitions. It gives you a true measure of your ability to prevent churn.
13. Escalation Rate
The Escalation Rate measures how often a customer support ticket needs to be transferred to a higher-level support tier or a manager. This metric shows you when your frontline team cannot resolve an issue on their own. It is a key indicator of your support process's efficiency.
Definition
This KPI calculates the percentage of support tickets that are escalated from the initial agent to someone else. An escalation happens when the first agent lacks the knowledge, authority, or tools to solve a customer's problem. You track these transfers to understand the complexity of issues your customers face and your team's ability to handle them.
Importance
A high escalation rate signals potential problems within your support structure. It can mean your customers are waiting longer for a resolution, which hurts their experience. A low rate, on the other hand, shows your frontline team is well-equipped and knowledgeable. This builds customer confidence. Tracking this metric helps you pinpoint areas for improvement.
A high escalation rate doesn't always mean your agents are failing. It often points to deeper issues that need your attention.
Common causes for high escalation rates include:
- Gaps in frontline support training
- Lack of expertise or experience from support agents
- Unclear documentation or knowledge base articles
- Underlying product or service issues
Addressing these root causes empowers your team, reduces the burden on senior staff, and ensures more customers get their problems solved faster. This makes it one of the most insightful customer service kpis for operational health. Every customer benefits from a well-trained and empowered team.
Calculation
You calculate your escalation rate with a straightforward formula. You divide the number of escalated tickets by the total number of support tickets. You should measure this over a specific period.
Escalation Rate Formula:
(Total Number of Escalated Tickets / Total Number of Tickets) x 100 = Escalation Rate (%)
This calculation gives you a clear percentage, helping you monitor the effectiveness of your first line of support for every customer.
14. Abandonment Rate
The Abandonment Rate is a key metric for any call center. It measures how many customers hang up or leave the queue before connecting with an agent. This KPI directly reflects your customers' patience and their initial service experience.
Definition
This metric calculates the percentage of inbound contacts that are terminated by the customer before they speak to an agent. A customer who hangs up while waiting in a queue contributes to this rate. A high abandonment rate often means the customer is frustrated and has given up on getting help.
Importance
A high abandonment rate is a clear warning sign. It tells you that your customers are facing friction before the conversation even begins. This hurts customer satisfaction and can lead to lost business. The primary causes are often a long average wait time or a confusing Interactive Voice Response (IVR) system. When a customer cannot easily navigate your phone menu, they are more likely to hang up.
Your goal should be to make the waiting experience as short and simple as possible for every customer. Reducing the average wait time is crucial for keeping customers on the line.
Different industries have different benchmarks. For example, telecommunications companies aim for a low rate.
| Industry | Average Call Abandonment Rate | Good Call Abandonment Rate |
|---|---|---|
| Telecommunications | 8-10% | Below 6% |
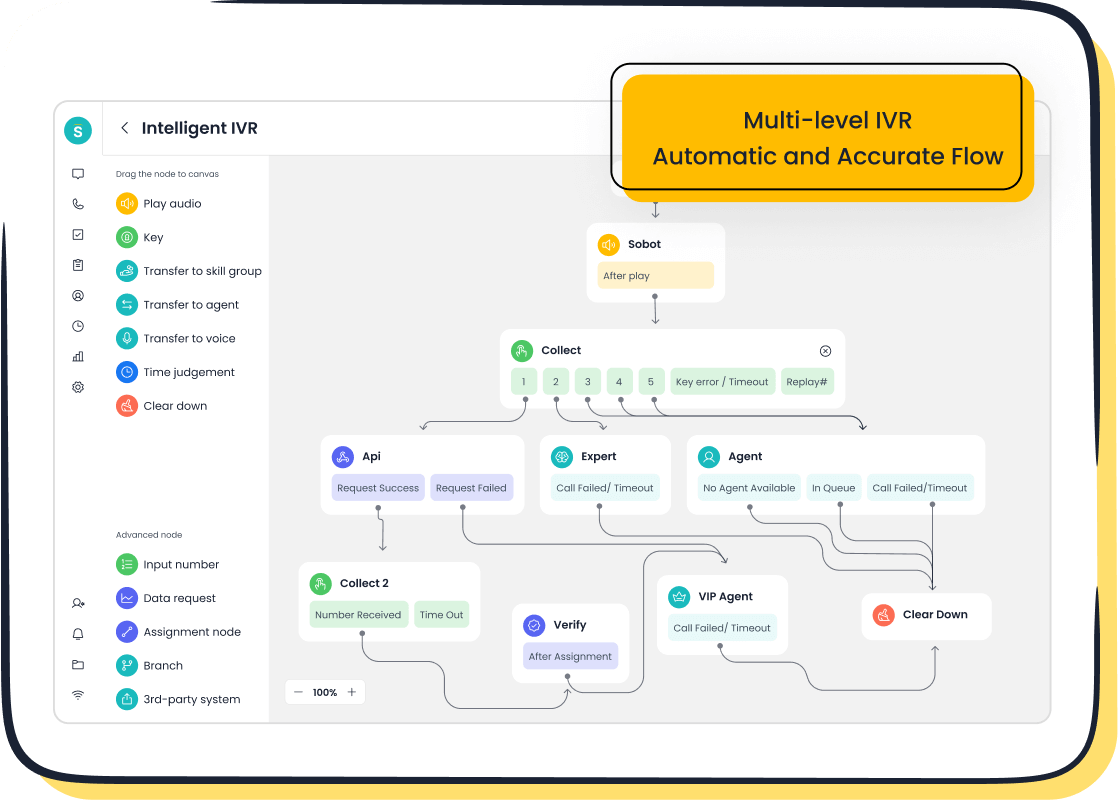
Achieving a rate below 6% shows your customers that you value their time. This is where the right tools make a difference. Sobot's Voice/Call Center helps you reduce abandonment with powerful features. Its intelligent IVR uses a simple drag-n-drop interface, so you can build clear, easy-to-navigate menus. This, combined with smart call routing, ensures each customer reaches the right agent quickly, minimizing frustration and hold times.
Calculation
You calculate your abandonment rate with a simple formula. You divide the number of abandoned contacts by the total number of inbound contacts.
Abandonment Rate Formula:
(Number of Abandoned Contacts / Total Number of Inbound Contacts) x 100 = Abandonment Rate (%)
Tracking this, one of the most critical customer service kpis, helps you identify issues in your call handling process and improve the experience for all your customers.
15. Service Level Agreement (SLA) Compliance
A Service Level Agreement (SLA) is a promise you make to your customers. SLA Compliance measures how well your team keeps that promise. This metric is essential for building trust and showing your service is reliable.
Definition
An SLA is a formal agreement that defines the level of service a customer can expect. It sets clear targets for specific metrics, such as first response time or resolution time. SLA compliance, therefore, is the percentage of times your team meets these agreed-upon targets. For example, if your SLA promises a response within one hour, every ticket answered within that timeframe meets the SLA.
Importance
Meeting your SLAs is fundamental to managing customer expectations. When you consistently hit your targets, you show every customer that you are dependable. This builds strong customer loyalty and confidence in your brand. A high compliance rate proves your service operations are efficient and customer-centric.
Conversely, failing to meet SLAs can quickly damage your reputation. It tells customers that your promises cannot be trusted, which leads to frustration and churn. Tracking this metric helps you hold your team accountable and identify where your service processes might be failing. It is one of the most important customer service kpis for demonstrating reliability to all your customers. A reliable service keeps customers happy.
Note: Your SLAs should be realistic and achievable. Setting ambitious but unattainable goals will only lead to failure and disappoint your customers.
Calculation
You calculate your SLA compliance rate with a straightforward formula. You divide the number of interactions that met their SLA targets by the total number of interactions. You should measure this over a specific period.
SLA Compliance Rate Formula:
(Number of Interactions Meeting SLA / Total Number of Interactions) x 100 = SLA Compliance Rate (%)
This percentage gives you a clear view of how consistently your team delivers on its service commitments to each customer.
16. Employee Satisfaction (eSAT)
Employee Satisfaction (eSAT) measures how happy, content, and fulfilled your employees are with their jobs. This internal metric is a powerful, often overlooked, driver of your external success. Happy employees create happy customers.
Definition
You measure eSAT by asking your employees for feedback through anonymous surveys. These surveys typically ask employees to rate their overall job satisfaction on a numerical scale (e.g., 1-10). Questions can cover topics like work environment, management, and career growth. This gives you a clear pulse on your team's morale.
Importance
A high eSAT score is directly linked to better business outcomes. Satisfied employees are more engaged and motivated, which translates into a superior experience for every customer. This creates a virtuous cycle: happy employees lead to satisfied customers, and positive customer feedback boosts employee morale.
Understanding the link between employee satisfaction and customer satisfaction is essential for growth. Investing in your team creates a positive work environment that directly impacts the service your customers receive.
Satisfied employees improve the customer experience in several ways:
- Better Customer Interactions: Happy employees are more positive, patient, and empathetic when speaking with a customer.
- Above and Beyond Support: Motivated team members take ownership of issues, working harder to find a resolution and reduce customer frustration.
- Increased Product Knowledge: Engaged employees invest more time in understanding your products, allowing them to provide confident and accurate support.
Ultimately, high employee satisfaction leads to lower turnover, higher productivity, and increased customer retention. This makes it one of the most impactful customer service kpis you can track.
Calculation
You calculate your eSAT score using a method similar to CSAT. You divide the number of satisfied employees by the total number of survey respondents. "Satisfied" employees are those who gave a high rating on your survey (e.g., 4 or 5 on a 5-point scale).
eSAT Formula:
(Number of Satisfied Employees / Total Number of Survey Responses) x 100 = eSAT Score (%)
This percentage gives you a clear benchmark for your team's overall satisfaction.
17. Knowledge Base Usage
Knowledge Base Usage tracks how your customers and agents interact with your self-service content. This metric shows you the value and effectiveness of your help articles, FAQs, and tutorials. It is one of the most important customer service kpis for promoting self-sufficiency.
Definition
This KPI measures how often your knowledge base is used to find answers. It includes several smaller metrics. You can track the number of article views, searches performed, and the success rate of those searches. It helps you understand if your customers can solve their own problems without needing to contact a support agent. A well-used knowledge base empowers every customer.
Importance
A strong knowledge base is a win-win. It gives customers the immediate answers they want and reduces the number of tickets your team has to handle. This frees up your agents to focus on more complex issues that require a human touch. When customers can help themselves, their satisfaction often increases.
An effective, AI-powered knowledge base can resolve up to 80% of customer inquiries without human help. Businesses using these systems have seen a 35% reduction in support tickets.
This shows how a great knowledge base directly improves efficiency and the experience for your customers. It allows you to provide 24/7 support for any customer, anywhere in the world. This makes your service more scalable and accessible for all customers.
Calculation
There is no single formula for knowledge base usage. Instead, you track several key metrics to get a complete picture.
- Article Views: The total number of times your articles are viewed.
- Search Success Rate: The percentage of searches that lead to a customer clicking on an article.
- Tickets Deflected: The number of times a customer views an article instead of submitting a support ticket.
- Article Ratings: Feedback from customers on whether an article was helpful.
Tracking these numbers helps you understand what content your customers find valuable and where you need to make improvements.
18. Contact Quality Score
The Contact Quality Score evaluates the overall quality of a customer interaction. Unlike metrics that measure speed or efficiency, this score looks at how well an agent handled a conversation. It helps you understand if your team is providing service that is not just fast, but also effective and professional for every customer.
Definition
This metric is a composite score derived from a structured review of customer interactions. You create a scorecard with specific criteria to grade calls, chats, or emails. This process, often called quality assurance (QA), provides a qualitative look at performance. It moves beyond simple numbers to assess the substance of the support your customers receive.
Importance
A high-quality interaction builds trust and strengthens the relationship with a customer. While metrics like AHT and FRT are important, they do not tell the whole story. An agent can be fast but unhelpful. A quality score ensures your team balances efficiency with empathy and accuracy. It helps you identify coaching opportunities to improve the skills of your agents. This focus on quality ensures your customers feel heard and valued, which is crucial for long-term loyalty. Tracking this is one of the most insightful customer service kpis because it reveals the true experience of your customers.
Calculation
You calculate a Contact Quality Score using a predefined scorecard. A comprehensive framework often weighs scores from different sources to get a balanced view. This prevents bias and gives you a complete picture of performance for each customer interaction.
A standard framework includes three main components:
- Manager review: An internal check on how well an agent meets company standards.
- Customer feedback: Direct input from customers on their satisfaction with the agent.
- Agent self-review: An agent's own assessment of their performance and goals.
During a manager review, you typically rate agents on specific parameters to ensure a consistent experience for all customers. These include:
- Skills: Did the agent show strong product knowledge and soft skills?
- Process adherence: Did the agent follow all required steps correctly?
- Compliance: Did the agent adhere to all regulations?
- Targets: Was the agent effective in meeting their goals for the interaction?
By scoring these areas, you create a final quality score that reflects an agent's true performance.
19. Customer Lifetime Value (CLV)
Customer Lifetime Value (CLV) predicts the total revenue your business can expect from a single customer account. This metric shifts your focus from short-term sales to long-term relationships. It helps you understand the total worth of a customer throughout their entire journey with your brand.
Definition
CLV is the total net profit you earn from a customer for as long as they remain a customer. To figure this out, you look at a few key pieces of information:
- How much a customer typically spends per purchase.
- How often that customer makes a purchase.
- How long you expect that person to remain one of your customers.
This gives you a powerful forecast of future revenue from your existing customers.
Importance
Tracking CLV is crucial for sustainable growth. It shows you which customers are the most valuable, allowing you to focus your marketing and retention efforts where they will have the biggest impact. When you know the value of a loyal customer, you can make smarter decisions about how much to spend to keep them happy.
Knowing your CLV helps you identify costly gaps in the customer experience. You can see which touchpoints might be hurting your bottom line and prioritize improvements that strengthen relationships with your most valuable customers.
This is one of the most strategic customer service kpis. It guides you to invest in the right customers, reduce churn, and build a stronger, more profitable business. A high CLV means you have a base of loyal customers who consistently bring in revenue.
Calculation
You can calculate a basic CLV with a simple formula. This helps you estimate the value of an individual customer. You multiply their annual revenue by their years as a customer, then subtract the costs to acquire and serve them.
(Customer Revenue Per Year x Relationship Duration in Years) – Total Acquisition & Service Costs = CLV
This calculation gives you a clear dollar value for each customer. It helps you understand the long-term financial impact of keeping your customers satisfied.
20. Social Media Response Rate
Your Social Media Response Rate measures how often your team replies to comments and messages on social platforms. In an age where customers expect instant communication, this metric is crucial for managing your brand's public image and providing timely support.
Definition
This KPI calculates the percentage of customer mentions on social media that receive a response from your team. It tracks your engagement with customers across platforms like Facebook, X (formerly Twitter), and Instagram. A high response rate shows that you are actively listening and engaging with your audience. Every customer who reaches out deserves an acknowledgment.
Importance
Social media is a public forum. Ignoring a customer question or complaint is visible to everyone. A low response rate can damage your brand's reputation and make potential customers think you do not care. A quick and helpful response, however, can turn a negative situation into a positive one. It shows every customer that you are attentive and value their feedback.
Today, 40% of customers expect a response on social media within one hour. Failing to meet this expectation can lead to public frustration and drive customers to your competitors.
A high response rate builds trust and shows that a real person is ready to help. This engagement is vital for retaining customers and managing your online presence effectively. You want to assure your customers that you are available on the channels they use most.
Calculation
You calculate your social media response rate with a simple formula. You divide the number of responses you sent by the total number of mentions that required a response.
Social Media Response Rate Formula:
(Total Number of Responses / Total Number of Mentions Needing a Response) x 100 = Social Media Response Rate (%)
Tracking this helps you ensure no customer is left unheard. It is a key metric for any business that wants to build a strong relationship with its customers online.
Choosing the Right KPIs for Your Business
You have learned about 20 powerful customer service kpis. Now, you need to select the right ones for your business. Tracking too many metrics can be overwhelming. The key is to choose the metrics that align with your specific goals and provide actionable insights for your team.
Align KPIs with Business Goals
Your KPIs should directly reflect what you want to achieve. Different business goals require you to focus on different customer service performance indicators. If your goal is growth, you will track different metrics than if your goal is efficiency. Each kpi should tell you if you are getting closer to your target.
Your goals determine which numbers matter most. Choose the metrics that tell the story of your progress.
This connection ensures your customer service efforts support the company's overall success. For every customer interaction, your team will know what success looks like.
| Business Goal | Example Goal | Key Performance Indicator (KPI) |
|---|---|---|
| Growth | Grow top-line revenue by 10%. | Revenue growth |
| Retention | Keep 90% of current customers. | Number of customers retained |
| Efficiency | Fill orders in 3 days or less. | Order fulfillment time |
Consider Your Industry and Customer
The right metrics also depend on your industry and the type of customers you serve. A B2C customer often expects speed, while a B2B customer may value a thorough, expert answer more. These different expectations change which service metrics are most important. For example, B2C companies focus heavily on fast response times, while B2B companies prioritize account retention.
| KPI | B2C Benchmarks (Aim) | B2B Benchmarks (Aim) |
|---|---|---|
| CSAT Score | 75-85% | 80-90% |
| First Contact Resolution | 70-75% | 65-70% |
| Average Response Time | Email: <12 hrs | Email: <24 hrs |
Understanding these differences helps you set realistic targets for your team and deliver the right kind of service for your specific customers.
Start Small and Scale
You do not need to track all 20 KPIs at once. A better approach is to start small and expand as your business grows. This helps you focus on what is most important right now.
- Start with 5-10 KPIs that align with your most critical business goals.
- Review your metrics regularly, such as monthly or quarterly, to track progress.
- Share the results with your team so everyone understands their role.
- Use a dashboard for real-time monitoring to spot trends quickly.
- Evolve your KPIs as your business priorities change over time.
This phased approach prevents confusion and helps your team use data to make real improvements. For example, a software startup that tracked NPS and CLV saw its customer retention rise by 40%. Focusing on the right metrics delivers results.
Best Practices for Tracking Your Customer Service KPIs
Tracking metrics is only the first step. You must use that data to drive real improvements in your customer service performance. Following the best practices for achieving customer service kpis ensures your team turns numbers into meaningful action. This helps every customer receive better service.
Use a Centralized Dashboard
You should bring all your customer service metrics into one place. A centralized dashboard gives you a clear, real-time view of your team's performance. This helps you quickly spot trends and make informed decisions. Companies like Coca-Cola and XstremeMD use dashboards to optimize operations and boost efficiency. A good dashboard consolidates your customer service performance indicators, so you can see what is working and what needs attention. This practice helps you manage your service for all customers effectively.
Set Clear Benchmarks
Your team needs clear goals to work toward. You should set realistic and motivational benchmarks for your customer service metrics. Involve your team in the goal-setting process to ensure the targets are both achievable and challenging. This promotes ownership and motivation.
Great benchmarks are relevant to an agent's daily work. They should align with professional development and give agents the autonomy to improve. This approach boosts job satisfaction and improves the service your customers receive.
Analyze your current performance to establish a baseline. This helps you set a kpi target that pushes your team without causing burnout. Clear goals guide your team's efforts and define what success looks like for each customer.
Communicate Results and Act on Insights
You need to share your customer service kpis with your team regularly. Visual tools like charts make it easy for everyone to understand the metrics. You can use simple color-coded signals (Red, Amber, Green) to show if a kpi is on target. This transparency keeps your team aligned and focused. Discussing these results helps you identify areas for coaching and process improvements. Acting on these insights is one of the most important best practices for achieving customer service kpis. It turns data into better customer service performance and a better experience for your customers.
Common Mistakes to Avoid with KPIs
Tracking your customer service kpis is essential, but how you use them matters even more. You can easily fall into common traps that hurt your team's morale and the service your customers receive. Avoiding these mistakes helps you use data to build a stronger, more customer-centric team.
Focusing Only on Quantitative Metrics
Numbers tell you what is happening, but they do not tell you why. If you only focus on quantitative metrics like response times or ticket volume, you miss the human story behind the data. This is a major blind spot for any service team.
Qualitative metrics, also known as experience data, reveal the context behind the numbers. They help you understand the feelings and motivations of your customers.
To get the full picture, you need to ask deeper questions and analyze qualitative feedback. This includes:
- Open-ended survey responses
- Customer testimonials
- Feedback from social media
This information helps you understand why a customer gave you a low NPS score or why they abandoned their shopping cart. Combining quantitative data with qualitative insights gives you a complete view of your customer service performance.
Ignoring the Context Behind Numbers
A single kpi can be misleading without context. Focusing too narrowly on one number can lead to "tunnel vision," where your team misses the bigger picture. This can cause employees to chase a target instead of providing great service.
For example, if you only reward agents for a low Average Handle Time (AHT), they might rush customers off the phone. This improves the AHT metric but creates a poor experience for the customer. This is a classic example of when improving metrics becomes more important than the actual goal of helping customers. You must look at a balanced set of customer service performance indicators to understand what is really happening.
Using KPIs to Punish Instead of Coach
Your metrics should be tools for growth, not weapons for punishment. When you use a kpi to penalize employees, you create a culture of fear. This demotivates your team and discourages them from taking risks to help a customer.
Instead, you should use data to identify coaching opportunities. If an agent's metrics are low, find out why. They may need more training, better tools, or support with a difficult customer issue. Using KPIs to guide and develop your team empowers them to improve. This positive approach leads to happier employees and, ultimately, happier customers.
Tracking the right customer care kpi is your first step toward excellent service. These metrics give you the data to improve the customer experience. Remember, these customer service performance indicators are meaningless without action. Your goal is continuous improvement to boost customer satisfaction. Better customer service performance leads to a better experience for all your customers. This focus on metrics is key to your customer experience management strategy.
Ready to embark on your contact journey with data-driven confidence? Explore how Sobot's all-in-one contact center solutions can help you track these customer service kpis and turn insights into results. Visit us at https://www.sobot.io/.
FAQ
Which KPIs should I start with?
You should start with 3-5 foundational metrics. Focus on Customer Satisfaction (CSAT), First Response Time (FRT), and First Contact Resolution (FCR). These customer service performance indicators give you a clear view of your service quality and efficiency. They help you understand the immediate experience of your customers.
How often should I review my service metrics?
You should review operational metrics like response times daily or weekly. For strategic metrics like NPS and Customer Retention Rate, a monthly or quarterly review is better. This helps you track both short-term service performance and long-term trends for your customers.
What is the difference between CSAT, NPS, and CES?
These metrics measure different aspects of the customer experience.
- CSAT measures short-term happiness after a specific service interaction.
- NPS measures long-term loyalty to your brand.
- CES measures how easy it was for a customer to get their issue resolved.
Why is a single customer care kpi not enough?
Relying on one metric gives you an incomplete picture. For example, a fast response time means little if the service quality is poor. Using a balanced set of customer service performance indicators helps you understand the full story and provide better service for every customer.
See Also
Elevating Call Center Excellence Through Proven Quality Management Strategies
Achieving Superior Live Chat Customer Satisfaction: Ten Essential Strategies
Optimizing Call Center Performance: The Power of Effective Monitoring Techniques
Discovering the Ten Leading Customer Service Software Solutions for 2024
Seamless Omnichannel Contact Center Solutions: A Ten-Step Implementation Guide