Top 10 Metrics Every Phone Support Center Should Monitor


You want your phone support center to shine. Tracking the right customer satisfaction metrics for phone support helps you keep customers happy and your team running smoothly. Studies show that 87% of call centers focus on customer satisfaction because it drives loyalty and repeat business. If you want to improve customer satisfaction and reduce repeat calls, you need tools that make tracking easy. Sobot gives you everything you need—voice solutions, chatbots, live chat, AI agents, voicebots, ticketing, and a full customer contact center—to help you deliver great service every time.
Customer Satisfaction Metrics for Phone Support
Why Metrics Matter
You want your phone support center to deliver great experiences every time. That’s where customer satisfaction metrics for phone support come in. These numbers show you how well your team helps customers and where you can do better. When you track customer satisfaction metrics for phone support, you spot problems early and fix them fast. You also see what works, so you can do more of it.
Let’s look at some common call center metrics you’ll want to watch:
| Metric | Definition |
|---|---|
| Customer Satisfaction (CSAT) | Measures how happy customers feel after a call, usually with a quick survey. |
| Call Abandonment | Shows if customers hang up before talking to an agent, which can mean long wait times. |
| Service Level Agreement (SLA) | Sets the standard for how quickly your team should answer calls and resolve issues. |
| Quality Assurance (QA) | Checks how well agents follow best practices and treat customers during calls. |
Tracking these customer satisfaction metrics for phone support helps you keep customers happy and loyal. You can also boost your team’s performance and hit your customer service kpis. When you know your numbers, you make smarter choices and grow your business.
How Sobot Supports Metric Tracking

You don’t have to track performance metrics on your own. Sobot gives you powerful tools to measure and improve customer satisfaction metrics for phone support. With Sobot’s Voice/Call Center, you get real-time dashboards, call tracking, and quality monitoring. You see all your call center metrics in one place. Sobot’s unified workspace lets agents handle calls, view customer info, and log feedback without switching screens.
Sobot’s analytics help you spot trends and take action fast. For example, Weee! used Sobot to boost agent efficiency by 20% and raise their customer satisfaction score to 96%. You can do the same. Sobot’s smart features make it easy to track, analyze, and improve every call. That means happier customers and a stronger support team.
First Call Resolution (FCR)
What Is FCR
First call resolution means you solve a customer’s problem during their first call, so they don’t need to call back about the same issue. This is one of the most important call center metrics. When you hit a high first call resolution rate, you show customers you value their time. The industry standard says first call resolution is the percentage of customer issues fully resolved in the first interaction, with no follow-up needed. You want to keep your total resolution time as low as possible, and FCR helps you do that.
Why FCR Matters
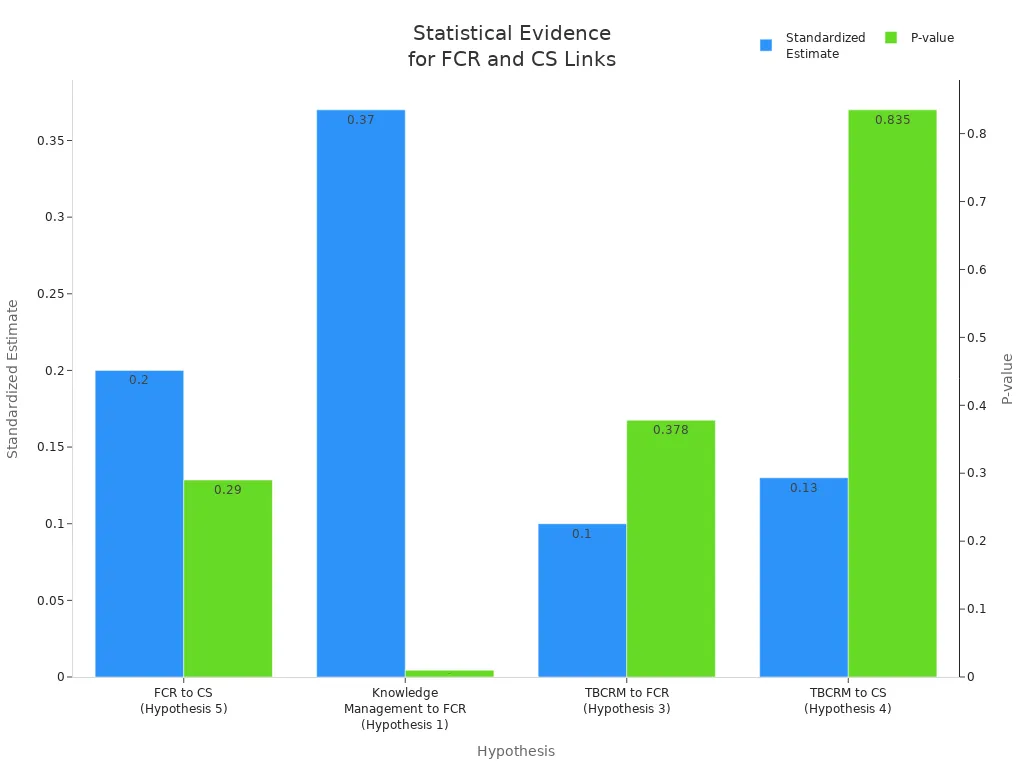
You might wonder why first-contact resolution gets so much attention. Customers love quick answers. If you resolve their issue on the first try, they leave happy. Studies show a strong link between high FCR and customer satisfaction. Take a look at this table:
| Hypothesis | Standardized Estimate | P-value |
|---|---|---|
| FCR to CS (Hypothesis 5) | 0.20 | 0.29 |
| Knowledge Management to FCR (Hypothesis 1) | 0.37 | 0.01 |
| TBCRM to FCR (Hypothesis 3) | 0.10 | 0.378 |
| TBCRM to CS (Hypothesis 4) | 0.13 | 0.835 |
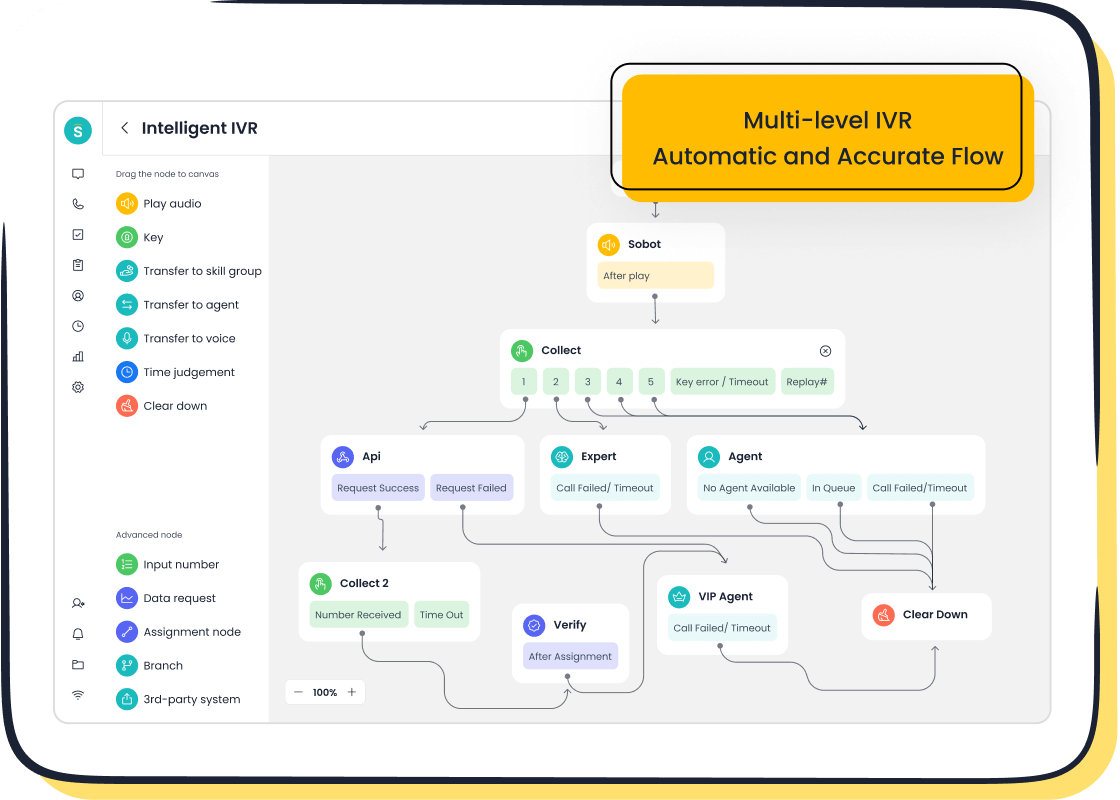
When you focus on first-contact resolution, you cut down on total resolution time and boost loyalty. Sobot’s intelligent IVR and unified workspace help you route calls to the right agent and give them all the info they need. That means fewer transfers, faster answers, and happier customers.
Measuring FCR
You can measure first call resolution in a few ways. Many support centers use both internal and external methods to get the full picture. Here’s how you can track it:
| Measurement Type | Description |
|---|---|
| External Measurement | Customer feedback through post-call surveys or direct questions to see if the issue was resolved. |
| Internal Measurement | Check if a customer calls back for the same issue within a set time. |
| FCR Calculation Formula | Total Customer Interactions Resolved on the First Try ÷ Total Unique Interactions × 100. |
You can also use post-call surveys, email follow-ups, or have agents ask customers if their issue is solved before ending the call. Sobot’s Voice/Call Center makes this easy. You get real-time tracking, call logs, and analytics to see your total resolution time and FCR rates. With Sobot, you can spot trends, train your team, and keep improving your call center metrics.
Average Handle Time (AHT)
AHT Definition
Average Handle Time (AHT) is one of the most important call center metrics you can track. AHT tells you how long, on average, it takes for an agent to finish a customer call. This number includes the time spent talking to the customer and any follow-up work right after the call. When you measure AHT, you get a clear picture of how quickly your team can resolve customer questions. AHT helps you see if your support process is smooth or if there are delays that might hurt the customer experience.
Impact on Support Efficiency
AHT plays a big role in how well your support center runs. If your AHT is low, your agents can help more customers in less time. That means you save money and boost your team’s capacity. Here’s why AHT matters for support efficiency:
- AHT shows if your team balances speed and quality, which is key for great customer experience.
- Lower AHT lets agents handle more calls per hour, cutting down costs for each interaction.
- When you reduce AHT, you often see happier customers, more productive agents, and less burnout.
If you want to improve your call center metrics, keeping an eye on AHT is a smart move. It helps you spot bottlenecks and make changes that lead to better results for both your team and your customers.
Reducing AHT with Sobot
You can lower AHT and improve customer experience with the right tools. Sobot gives your agents instant access to a modern knowledge base, so they find answers fast and avoid long hold times. Sobot’s automation features take care of repetitive tasks, letting agents focus on real conversations. You can also use AI-powered agent assistance for real-time support, which speeds up responses and cuts down on after-call work. Sobot’s training tools help agents practice with real scenarios, building their confidence and efficiency. With these features, you can see your AHT drop and your call center metrics improve across the board.
Customer Satisfaction Score (CSAT)
What Is CSAT
You want to know if your customers feel happy after calling your support center. That’s where the customer satisfaction score comes in. CSAT is a simple way to measure how satisfied customers feel after a phone call. You usually ask customers to rate their experience on a scale, like 1 to 5 or 1 to 10. The higher the score, the better your team did. CSAT is one of the most popular call center metrics because it gives you a quick snapshot of customer satisfaction right after an interaction.
Why CSAT Is Key
CSAT matters because it gives you instant feedback. You can see how well your agents handle calls and spot problems before they grow. When you measure CSAT right after a call, you get honest answers while the experience is still fresh. This helps you fix issues fast and keep your customer service strong. Many support centers use CSAT as a key part of their call center metrics because it shows what customers really think. You can also use AI tools to dig deeper into customer feedback and predict satisfaction trends.
Tip: Use CSAT to track how changes in your support process affect customer satisfaction. You’ll see what works and what needs improvement.
Measuring CSAT
You can measure CSAT in a few easy steps:
- Collect survey responses from customers after each call.
- Identify which responses count as “satisfied” (usually the top two ratings).
- Use this formula: (Number of satisfied responses ÷ Total responses) × 100.
- The result is your CSAT score as a percentage.
Here’s a quick table with best practices for measuring CSAT:
| Best Practice | Description |
|---|---|
| Timing of Surveys | Send surveys right after the call for the most accurate feedback. |
| Types of Surveys | Try post-call surveys, NPS, CES, or even “Would you call us again?” surveys. |
| Alternative Methods | Use phone, SMS, or email to reach more customers. |
Sobot makes CSAT tracking simple. With Sobot’s Voice/Call Center, you can send surveys automatically after each call, collect feedback in real time, and view results in one dashboard. Sobot’s analytics help you spot trends and train your team to improve customer satisfaction. Companies like Weee! have used Sobot to reach a 96% customer satisfaction score, showing how powerful the right tools can be.
Net Promoter Score (NPS)
NPS Overview
You want to know if your customers would recommend your support center to others. That’s where Net Promoter Score (NPS) comes in. NPS is one of the most popular call center metrics because it’s easy to understand and track over time. You ask customers one simple question: “How likely are you to recommend our service to a friend or colleague?” They answer on a scale from 0 to 10. You group the responses into three categories:
- Promoters (9-10): These customers love your service and will tell others.
- Passives (7-8): These customers are satisfied but not excited.
- Detractors (0-6): These customers are unhappy and may share negative feedback.
You calculate NPS by subtracting the percentage of Detractors from the percentage of Promoters. This score gives you a clear picture of customer loyalty and satisfaction.
NPS and Customer Loyalty
NPS does more than measure how customers feel. It predicts how likely they are to stay with your company, buy again, and refer new customers. A high NPS means your customers trust you and want to keep coming back. Studies show that companies with strong NPS scores see more repeat business and higher profits. Promoters often buy more and stay longer. NPS also helps you spot trends in customer loyalty, so you can fix problems before they grow.
Tip: Track NPS over time to see if your changes make a real difference in customer loyalty.
| Evidence Type | Description |
|---|---|
| NPS Questions | Ask customers about their likelihood to recommend after phone interactions. |
| Trend Analysis | Watch NPS scores over time to find loyalty trends and issues. |
| Customer Segmentation | Break down NPS by customer type to see who loves your service most. |
NPS Measurement
You can measure NPS in a few easy steps:
- Send a quick survey after each phone call.
- Collect scores from 0 to 10.
- Sort responses into Promoters, Passives, and Detractors.
- Use this formula:
NPS = (% of Promoters) – (% of Detractors)
NPS stands out among call center metrics because it helps you predict referrals, retention, and customer lifetime value. When you keep an eye on NPS, you get a powerful tool for growing your business and building a loyal customer base.
Call Abandonment Rate
What Is Abandonment Rate
You want every customer to reach your team, but sometimes callers hang up before speaking to an agent. That’s what call abandonment rate measures. It’s the percentage of customers who disconnect before connecting with someone. This happens when callers face long wait times or get stuck in confusing menus. If you track call center metrics like abandonment rate, you see how often customers leave without help. You can spot patterns and fix problems fast.
Why It Matters
Call abandonment rate affects your business in big ways. When customers hang up, you lose sales and damage your reputation. Each abandoned call costs about $50, which can add up to $4,000 lost daily. If you reduce average queue time to just two minutes, you can boost revenue by $3,000 every day. Customers remember bad experiences. Nearly half—43%—stop buying from a company after a poor call. You need to keep abandonment rates low to protect customer satisfaction and retention.
| Evidence Type | Description |
|---|---|
| Financial Impact | Each abandoned call costs businesses around $50, leading to daily losses. |
| Customer Experience | Shorter queue times lower abandonment and increase revenue. |
| Customer Retention | 43% of customers stop purchasing after a poor experience. |
Tip: Watch your call center metrics closely. High abandonment rates mean you need to make changes fast.
Reducing Abandonment with Sobot
You can lower abandonment rates with smart tools. Sobot’s Voice/Call Center gives you real-time monitoring and analytics. You see queue times and call flows, so you can adjust staffing and routing. Sobot’s intelligent IVR lets you build menus that guide callers quickly. If callers spend less than five minutes in IVR, they’re more likely to stay. Sobot’s AI-powered voicebot answers simple questions, so customers don’t wait for an agent. Companies like BuyaCar saw a 33% drop in abandonment after using conversational AI. When you improve your IVR and add automation, you keep customers engaged and boost retention. Even a small increase in retention—just 5%—can raise profits by up to 95%. Sobot helps you track call center metrics and make changes that matter. You get happier customers and stronger results.
Average Speed of Answer (ASA)
ASA Definition
Average Speed of Answer (ASA) tells you how quickly your support center picks up incoming calls. This metric shows the average time callers wait in the queue before an agent answers, not counting the time spent in an IVR system. You calculate ASA by dividing the total wait time for answered calls by the number of calls your team handles. ASA is one of the most important call center metrics because it gives you a clear view of your team’s responsiveness. If you want to know how well your support center responds to customers, ASA is a great place to start.
ASA and Customer Experience
ASA connects directly to customer experience. When you answer calls fast, customers feel valued and stay happy. Studies show that slower response times lead to lower satisfaction, especially in urgent situations. The industry standard for ASA is to answer calls within 20 seconds or less. If your ASA is low, you reduce wait times and make a strong impression. Customers remember when you pick up quickly. They are more likely to trust your support and stay loyal. On the other hand, long waits can frustrate callers and hurt your reputation. Keeping ASA low helps you deliver a better customer experience every time.
Tip: Track ASA alongside other call center metrics like abandonment rate. High abandonment often means your ASA needs improvement.
Improving ASA
You can improve ASA with a few smart strategies:
- Check your staffing levels. Make sure you have enough agents during busy hours.
- Train your team often. Well-trained agents handle calls faster and more confidently.
- Use automatic call routing. This sends calls to the right agent without delay.
- Offer self-service options like IVR for common questions.
- Monitor performance in real time. Adjust quickly if you see queues getting long.
- Manage your call queues. Try offering callbacks so customers don’t have to wait on hold.
- Invest in reliable call center software. Good technology keeps connections clear and fast.
When you focus on ASA, you boost both efficiency and customer experience. You also strengthen your call center metrics and set your team up for success.
Service Level
Service Level Meaning
Service level shows how well your phone support center answers calls within a set time. You measure it as the percentage of calls picked up before a certain number of seconds pass. For example, you might set a goal to answer 80% of calls in 20 seconds. This number is part of your Service Level Agreement, or SLA. Many support centers use service level as a key performance indicator. It tells you if your team responds quickly and keeps customers happy. When you track service level, you see how well your team handles busy times and keeps up with demand.
Importance for Phone Support
Service level matters a lot for customer satisfaction. If you answer calls fast, customers feel valued and trust your support. Here are some reasons why service level is important:
- 82% of people say a company’s quality depends on its service.
- Good service level management keeps customers loyal and happy.
- Many centers aim for the “80/20” target—answering 80% of calls in 20 seconds.
- High service level means you have enough agents and the right skills on your team.
When you keep service level high, you boost both customer satisfaction and your team’s efficiency. This metric stands out among call center metrics because it shows how well you meet customer needs in real time.
Monitoring Service Level
You can monitor service level with a few best practices:
- Build a quality assurance team with managers, supervisors, and top agents.
- Set clear standards for call quality and response time.
- Track other call center metrics like Average Handle Time, Net Promoter Score, First Call Resolution, and Customer Satisfaction Score.
Tip: Use real-time dashboards to watch your service level and adjust staffing when call volume spikes.
When you follow these steps, you spot problems early and keep your support center running smoothly. Service level helps you deliver fast, reliable help every time a customer calls.
Customer Effort Score (CES)
CES Definition
You want your customers to have an easy time when they call your support center. Customer Effort Score (CES) measures how much work a customer has to do to get help or use your service. If your support feels simple, customers stay happy. CES is one of the call center metrics that shows how smooth your phone support really is. You can ask CES questions after a call, after someone uses your knowledge base, or after a chatbot conversation. The goal is to find out if customers feel their interaction was easy.
- Customers should find their interactions with support easy.
- CES questions can be asked after support calls, visits to knowledge bases, or chatbot conversations to evaluate customer perceptions.
CES and Satisfaction
CES connects directly to customer satisfaction. When customers say their experience was easy, they feel more satisfied. If your support center makes things hard, customers might leave. High-effort interactions often predict customer churn. You want to keep effort low so customers stay loyal. CES stands out among call center metrics because it helps you spot friction fast. If you see high effort scores, you know it’s time to make changes.
- CES is directly correlated with overall customer satisfaction.
- When customers find interactions easy, their satisfaction levels increase.
- High-effort interactions predict customer churn, indicating that reducing effort can enhance satisfaction and loyalty.
Tip: Ask CES questions right after a call. You get honest feedback while the experience is fresh.
Measuring CES
You can measure CES in several ways. The most common method is a post-service survey. You send a quick question like, “How easy was it to get your issue resolved?” You can use automation tools to trigger surveys after certain events. Timing matters. Send surveys right after the interaction for the best results. You can also ask CES questions after escalated cases or onboarding. SMS follow-ups work well for high response rates.
| Method | Description |
|---|---|
| Post-Service Surveys | Send CES surveys immediately after service interactions to measure customer effort. |
| Automation Tools | Use tools like Flow Builder or CRM integrations to automate survey triggers based on specific events. |
| Timing of Surveys | The timing of when surveys are sent is crucial for capturing meaningful insights. |
| Escalated Cases | Trigger CES surveys after escalated support cases to measure effort during complex interactions. |
| Onboarding Feedback | Ask CES questions during onboarding to identify friction points that may hinder activation. |
| Self-Service Attempts | Measure effort after customers transition from self-service to live support to identify friction areas. |
| SMS Follow-Ups | Utilize SMS for post-call follow-ups to ensure high response rates and timely feedback. |
CES helps you improve your call center metrics and keep your customers coming back.
Call Quality Monitoring

Quality Monitoring Explained
You want every customer call to go well. Quality monitoring helps you check how your agents talk to customers and follow your company’s standards. You listen to call recordings, review agent notes, and look at customer feedback. This process helps you see what your team does right and where they can improve. Quality monitoring is a key part of call center metrics because it shows you the real story behind every call.
Here’s what you might check during quality monitoring:
- How friendly and clear the agent sounds
- If the agent solves the problem on the first call
- How well the agent follows your support script
Tip: Review a mix of random and targeted calls to get a full picture of your team’s performance.
Quality and Satisfaction
When you focus on quality, you make customers happier. Customers want clear answers and polite service. If you spot problems early, you can coach your agents and fix issues before they grow. Studies show that companies with strong quality monitoring see higher customer satisfaction scores. Good quality checks also help you meet your service goals and keep your call center metrics strong.
| Benefit | How It Helps Your Support Center |
|---|---|
| Higher Satisfaction | Customers get better, faster answers |
| Fewer Complaints | Agents fix mistakes before they repeat |
| Better Training | You know what skills to teach your team |
Sobot’s Quality Tools
Sobot gives you powerful tools for call quality monitoring. You get real-time dashboards, call recording, and playback features. Managers can listen to calls, leave feedback, and track trends over time. Sobot’s analytics show you which agents need help and which ones shine. You can set up automatic alerts for calls that need review. With Sobot, you keep your call center metrics on track and build a team that delivers great service every time.
Agent Satisfaction
Why Agent Satisfaction Matters
You want your support team to feel happy and motivated. When agents enjoy their work, they help customers better. Happy agents lead to higher customer satisfaction. If your team feels stressed or burned out, you see more mistakes and slower service. That hurts your call center metrics. Studies show that engaged agents deliver better customer service and stay with your company longer. You save money on hiring and training. You also build a positive work culture that attracts top talent.
Tip: Ask your agents how they feel about their work. Listen to their feedback and show you care.
Measuring Engagement
You can measure agent satisfaction in many ways. Try these simple methods:
- Run regular surveys. Ask agents about their workload, tools, and support.
- Track turnover rates. High turnover means agents might feel unhappy.
- Watch for absenteeism. If agents miss work often, check for stress or burnout.
- Hold one-on-one meetings. Give agents a safe space to share thoughts.
Here’s a quick table to help you track engagement:
| Method | What It Shows |
|---|---|
| Surveys | Direct feedback from agents |
| Turnover Rate | Agent retention levels |
| Absenteeism | Signs of stress or burnout |
| One-on-Ones | Deeper insights and support |
Improving Agent Experience
You can boost agent satisfaction with a few smart steps. Give agents the right tools, like a unified workspace and clear call flows. Offer regular training so they feel confident. Celebrate wins and recognize hard work. Let agents share ideas for improving call center metrics. When you support your team, they support your customers. Sobot’s Voice/Call Center gives agents everything they need in one place, making their jobs easier and more rewarding. Happy agents create better customer satisfaction and help your support center shine.
Best Practices for Metrics
Setting Goals
You need clear goals to get the most out of your call center metrics. Start by asking yourself what you want to improve. Do you want faster answers? Fewer abandoned calls? Higher customer satisfaction? Write down your targets. Make them specific and easy to measure. For example, you might aim to answer 90% of calls in under 20 seconds or raise your CSAT score by 5%. When you set clear goals, your team knows what to work toward every day.
Turning Data into Action
Collecting numbers is just the first step. You need to use your data to make real changes. Sobot’s analytics dashboard helps you see trends and spot problems fast. If you notice your average handle time is rising, you can check call recordings to find out why. Maybe agents need more training or better scripts. Use real-time monitoring to adjust staffing when call volume spikes. Here are some steps you can follow:
- Review your call center metrics every week.
- Share results with your team.
- Celebrate wins and talk about areas to improve.
- Try new ideas and track what works.
Tip: Use Sobot’s real-time alerts to catch issues before they grow.
Continuous Improvement
Great support centers never stop improving. Keep checking your call center metrics and look for small ways to get better. Ask your team for feedback. Run regular training sessions. Update your scripts and tools as you learn what works best. Sobot’s reporting tools make it easy to see progress over time. When you focus on steady improvement, you build a support center that keeps customers happy and loyal.
| Step | What to Do |
|---|---|
| Set Goals | Pick clear, measurable targets |
| Analyze Data | Use dashboards to spot trends |
| Take Action | Make changes and test results |
| Repeat | Keep improving every month |
You want your phone support center to run smoothly and keep customers happy. Tracking customer satisfaction metrics for phone support helps you spot issues, boost efficiency, and improve service quality. When you measure KPIs like First Call Resolution, Average Handle Time, and Customer Satisfaction Score, you see where your team shines and where you can grow. Sobot Voice/Call Center gives you real-time dashboards and smart tools to make data-driven choices. If you want to learn more, check out Sobot’s resources and blog for practical tips.
FAQ
What are customer satisfaction metrics for phone support?
Customer satisfaction metrics for phone support are numbers that show how happy your callers feel after getting help. You track things like CSAT, NPS, and FCR. These metrics help you see what works and where you can improve.
Why should I track customer satisfaction metrics for phone support?
You want to know if your support center makes customers happy. Tracking customer satisfaction metrics for phone support helps you spot problems, boost loyalty, and grow your business. Happy customers call back and tell friends about your service.
How often should I review customer satisfaction metrics for phone support?
Check your customer satisfaction metrics for phone support every week. Regular reviews help you catch issues early. You can adjust your team’s approach and keep your service strong.
Can Sobot help me measure customer satisfaction metrics for phone support?
Yes! Sobot gives you real-time dashboards, call tracking, and survey tools. You see all your customer satisfaction metrics for phone support in one place. This makes it easy to spot trends and take action.
What’s the best way to improve customer satisfaction metrics for phone support?
Start by training your agents and using smart tools like Sobot’s Voice/Call Center. Review your customer satisfaction metrics for phone support, listen to feedback, and make small changes. Celebrate wins and keep improving every month.
See Also
Enhancing Call Center Efficiency Through Effective Monitoring Techniques
Best 10 Analytics Tools for Call Centers in 2024
Leading 10 Customer Support Software Solutions for 2024