How to Use NPS and CSAT to Improve Customer Experience

Net Promoter Score (NPS) and Customer Satisfaction (CSAT) are crucial metrics for evaluating customer experience. When comparing net promoter score vs customer satisfaction, NPS focuses on categorizing customers into promoters, passives, and detractors, offering insights into loyalty and overall sentiment. On the other hand, CSAT measures satisfaction by calculating the percentage of customers who rate their experience positively, often serving as a predictor of retention. For instance, a CSAT score is determined using the formula: (Top 2 responses / Total responses) * 100. Companies like Sobot leverage both NPS and CSAT to optimize customer interactions, driving improved satisfaction and fostering loyalty.
Understanding Net Promoter Score vs Customer Satisfaction

What is Net Promoter Score (NPS)?
Net Promoter Score (NPS) measures how likely your customers are to recommend your business to others. It focuses on customer loyalty and long-term brand advocacy. You calculate NPS by asking a single question: “On a scale of 0 to 10, how likely are you to recommend us to a friend or colleague?” Customers who respond with 9 or 10 are promoters, 7 or 8 are passives, and 0 to 6 are detractors. The formula for NPS is straightforward:
(Number of Promoters - Number of Detractors) / Total Responses × 100.
The benefits of NPS go beyond numbers. For example, Heineken found that promoters grew gross profit three times faster than detractors. Similarly, Philips’ Lighting linked a rise in NPS to a 70% revenue increase, while a decline led to a 24% revenue drop. These insights show how NPS surveys can directly impact your business's financial health.
What is Customer Satisfaction Score (CSAT)?
Customer Satisfaction Score (CSAT) evaluates how satisfied customers feel about a specific interaction or experience. It typically uses a simple question like, “How satisfied were you with your experience?” Customers rate their satisfaction on a scale, often from 1 to 5. To calculate CSAT, divide the number of satisfied responses (top 2 ratings) by the total responses and multiply by 100.
CSAT provides immediate feedback on customer satisfaction. For example, Samsung achieved a 97% CSAT score by using Sobot’s solutions to streamline communication and improve service quality. This metric helps you identify areas for quick improvement, ensuring customers leave with a positive impression.
Key Differences Between NPS and CSAT
| Metric | Focus | Methodology | Scoring System |
|---|---|---|---|
| NPS | Long-term loyalty and brand advocacy | Asks likelihood to recommend on a scale of 0-10 | (Promoters - Detractors) / Total Responses × 100 |
| CSAT | Immediate customer satisfaction tied to specific interactions | Asks satisfaction rating on a scale of 1-5 | (Satisfied Responses / Total Responses) × 100 |
While NPS measures loyalty and predicts future behavior, CSAT focuses on short-term satisfaction. Both metrics complement each other, offering a complete view of customer sentiment.
How to Calculate NPS and CSAT
How to Calculate NPS with Examples
To calculate NPS, you need to ask your customers a single question: “On a scale of 0 to 10, how likely are you to recommend us to a friend or colleague?” Based on their responses, you categorize them into three groups:
- Promoters (9-10): These customers are highly satisfied and likely to recommend your business.
- Passives (7-8): These customers are neutral and less likely to promote your brand.
- Detractors (0-6): These customers are dissatisfied and may discourage others from using your services.
The NPS formula is straightforward:
NPS = (% of Promoters - % of Detractors)
For example, if you surveyed 100 customers and received the following responses:
- 60 customers rated 9 or 10 (Promoters).
- 20 customers rated 7 or 8 (Passives).
- 20 customers rated 0 to 6 (Detractors).
You calculate NPS as:
NPS = (60% - 20%) = 40
This score of 40 indicates a positive sentiment among your customers. NPS surveys provide valuable insights into customer loyalty and help you identify areas for improvement.
How to Calculate CSAT with Examples
CSAT measures customer satisfaction with a specific interaction or experience. To calculate CSAT, you ask a question like, “How satisfied were you with your experience?” Customers rate their satisfaction on a scale, typically from 1 to 5. You then calculate the percentage of satisfied customers using the formula:
CSAT (%) = (Number of Satisfied Responses / Total Responses) × 100
For example, if 80 out of 100 customers rated their experience as 4 or 5, the CSAT score would be:
CSAT = (80 / 100) × 100 = 80%
This method provides immediate feedback on how well you meet customer expectations. Companies like MeUndies achieved a 99% CSAT score by focusing on service quality and continuous improvement. Similarly, a global BPO improved its CSAT by 17% after implementing an AI-powered writing assistant.
Here are two common methods for calculating CSAT:
| Method | Description | Example Calculation |
|---|---|---|
| Percentage of Satisfied Customers | Calculates the percentage of respondents who are considered satisfied based on defined criteria. | If 80 out of 100 customers rated 4 or 5, CSAT = 80%. |
| Average Score | Reports the average rating given by respondents, which can also be converted to a percentage. | An average rating of 4.2 out of 5 translates to 84%. |
Common Standards for NPS and CSAT Scores
Understanding industry benchmarks helps you evaluate your performance. For NPS, a score between 30 and 70 is considered standard, while scores above 70 are excellent. For CSAT, an 80% score is the gold standard for excellent performance. However, these benchmarks can vary by industry.
| Metric | Score Range | Description |
|---|---|---|
| NPS | 30 to 70 | Industry standard; excellent if over 70, average is 17 |
| CSAT | 80% | Gold standard for excellent performance; varies by industry |
| CSAT | 25% | Good response rate; 50% or higher is excellent |
| CSAT | 15% | Average across all industries |
Tip: To measure customer satisfaction effectively, collect enough responses to ensure accuracy. Assign numerical scores, calculate individual scores, and normalize the final score for easier comparison.
For example, you might calculate weekly CSAT trends and review them in team meetings. This process helps you identify improvement areas and prioritize actions. By consistently monitoring these metrics, you can enhance your customer experience and drive loyalty.
How to Interpret NPS and CSAT Scores
Interpreting NPS Ranges (Promoters, Passives, Detractors)
To interpret net promoter score results effectively, you need to understand the three customer categories: promoters, passives, and detractors. Promoters, scoring 9-10, are your most loyal customers. They actively recommend your business, driving growth and positive word-of-mouth. Passives, scoring 7-8, feel indifferent. They are satisfied but not enthusiastic enough to promote your brand. Detractors, scoring 0-6, are dissatisfied customers who may harm your reputation through negative feedback.
Here’s a breakdown of NPS classifications:
| Classification | Score Range | Description |
|---|---|---|
| Promoters | 9-10 | Customers likely to recommend |
| Passives | 7-8 | Customers indifferent to recommendation |
| Detractors | 0-6 | Customers unlikely to recommend |
By analyzing these groups, you can identify areas for improvement. For instance, if detractors form a significant portion, focus on resolving their pain points. Tools like Sobot’s Voice/Call Center can help you gather real-time insights from detractors, enabling you to address their concerns promptly.
Interpreting CSAT Percentages and Benchmarks
CSAT scores provide a clear picture of customer satisfaction with specific interactions. A score between 80-100% indicates excellent satisfaction, while anything below 50% signals dissatisfaction. Here’s a detailed interpretation of CSAT percentages:
| CSAT Percentage Range | Interpretation |
|---|---|
| 0-35 | Very bad/extremely dissatisfied |
| 35-50 | Poor/unsatisfied |
| 50-65 | Average/quite satisfied |
| 65-80 | Good/satisfied |
| 80-100 | Excellent/extremely satisfied |
For example, Samsung achieved a 97% CSAT score by using Sobot’s omnichannel solutions to streamline communication. This demonstrates how high CSAT scores reflect exceptional service quality. Regularly monitoring these benchmarks helps you interpret trends and prioritize improvements.
Using Sobot's Voice/Call Center for Real-Time Insights

Sobot’s Voice/Call Center empowers you to interpret NPS and CSAT scores with real-time data. Features like call tracking and AI-powered voicebots allow you to collect actionable feedback during customer interactions. For instance, you can identify detractors through automated surveys and address their concerns immediately. The platform’s unified workspace consolidates customer data, enabling agents to provide personalized support.
With a 99.99% system uptime and global telephony support, Sobot ensures seamless operations. By leveraging these tools, you can enhance satisfaction and loyalty, ultimately improving your NPS and CSAT scores.
Best Practices for Collecting and Analyzing Feedback
Designing Effective NPS and CSAT Surveys
Creating effective NPS and CSAT surveys requires thoughtful design to ensure accurate and actionable insights. Start by crafting clear, concise questions that focus on customer experience. For NPS surveys, ask, “On a scale of 0 to 10, how likely are you to recommend us to a friend or colleague?” This question measures loyalty and identifies promoters, passives, and detractors. For CSAT surveys, use a question like, “How satisfied were you with your experience?” to measure customer satisfaction score for specific interactions.
Incorporate empathy into your surveys to prioritize customer needs. Listen to detractors to address their pain points and analyze NPS alongside other metrics like CSAT for a holistic view. Use a mix of methods, such as online questionnaires, interviews, and focus groups, to collect diverse feedback. For example, Gousto, a meal-kit delivery company, uses real-time evaluations to understand customer issues and improve their offerings.
Timing and Frequency of Surveys
Timing plays a crucial role in collecting meaningful customer feedback. Send surveys immediately after key interactions, such as a purchase or a support call, to capture fresh impressions. For NPS surveys, consider quarterly or biannual intervals to track long-term loyalty trends. CSAT surveys, on the other hand, work best when sent after specific touchpoints, like resolving a customer query.
Avoid over-surveying your customers, as this can lead to survey fatigue and lower response rates. Instead, focus on strategic moments that matter most to your audience. For instance, analyzing weekly CSAT trends can help you identify patterns and prioritize improvements without overwhelming your customers.
Leveraging Sobot's Omnichannel Solution for Feedback Collection
Sobot’s Omnichannel Solution simplifies feedback collection by integrating multiple communication channels into a unified platform. This solution enables you to gather customer feedback seamlessly across email, chat, and social media. With AI-driven automation, repetitive queries are handled efficiently, allowing agents to focus on more complex issues.
The platform’s analytics provide actionable insights, helping you measure customer satisfaction and improve service quality. For example, businesses using Sobot have achieved a 97% CSAT score and a 20% reduction in inbound discussion volume. The chart below illustrates the effectiveness of Sobot’s solution in enhancing feedback collection and customer satisfaction:
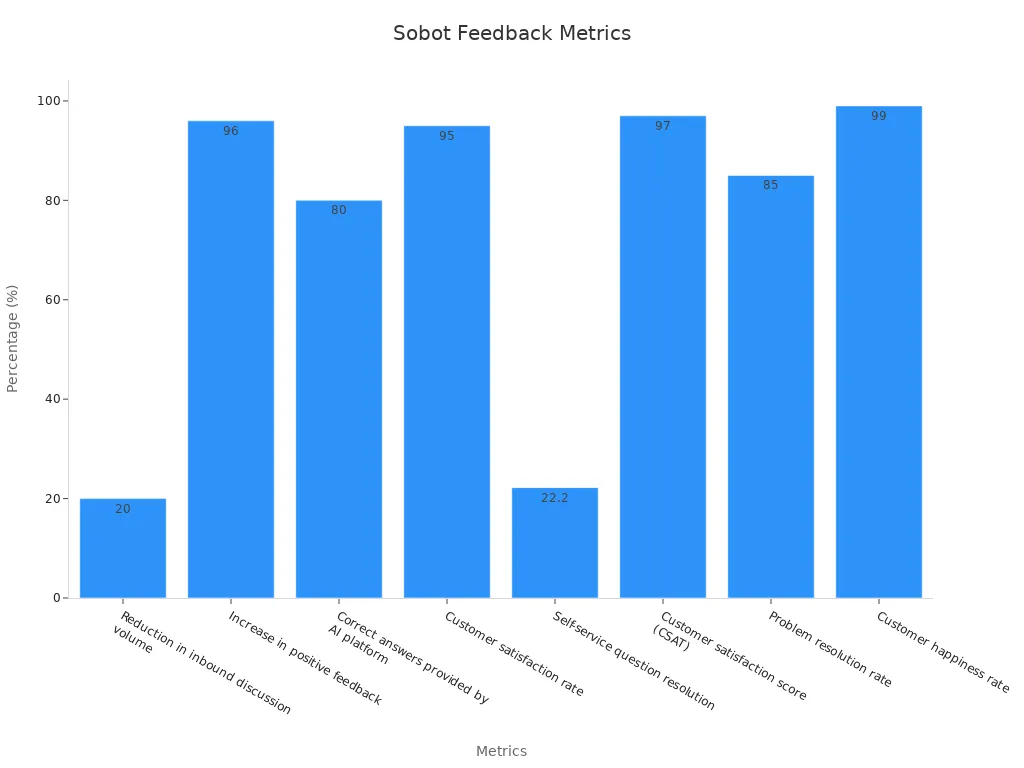
By leveraging Sobot’s tools, you can streamline your feedback process, improve response rates, and drive better customer experiences.
Actionable Strategies to Improve NPS and CSAT Scores

Enhancing Customer Support with Sobot's Voice/Call Center

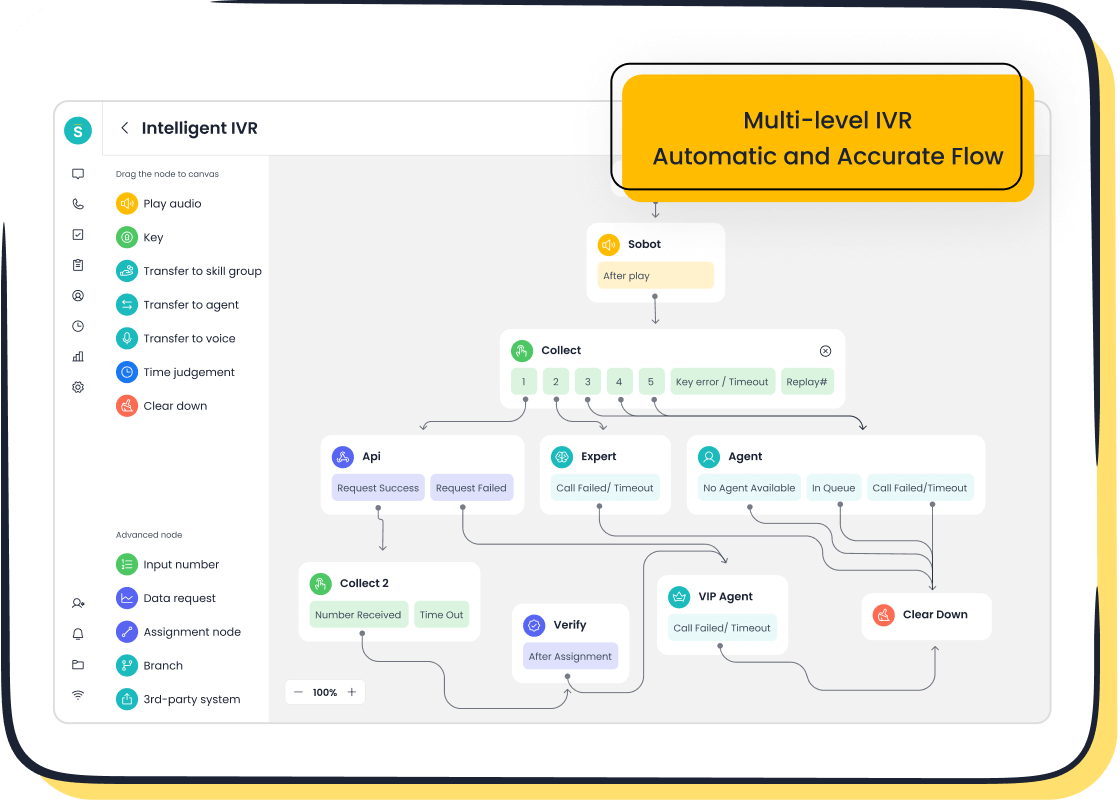
Improving customer support is one of the most effective ways to boost both NPS and CSAT scores. Customers value quick, efficient, and personalized interactions. Sobot's Voice/Call Center provides a robust platform to meet these expectations. With features like intelligent IVR, smart call routing, and AI-powered voicebots, you can streamline communication and reduce response times. For example, the platform’s unified workspace allows agents to access customer data instantly, enabling them to resolve issues faster and more effectively.
Real-time monitoring and analytics also play a crucial role. By tracking call data and analyzing trends, you can identify common pain points and address them proactively. For instance, if detractors frequently mention long wait times, you can adjust workflows to prioritize urgent calls. Sobot’s 99.99% system uptime ensures uninterrupted service, which is critical for maintaining customer satisfaction and loyalty.
Companies like Fujitsu have demonstrated the power of linking customer feedback to business outcomes. By transitioning to a Voice of the Customer (VoC) program, they improved their service quality and customer loyalty. Similarly, integrating tools like Sobot’s Voice/Call Center can help you achieve similar results by enhancing the overall customer experience.
Closing the Feedback Loop with Proactive Communication
Closing the feedback loop is essential for turning insights into action. When customers provide feedback through NPS surveys or CSAT surveys, they expect you to act on it. Proactive communication ensures that you address their concerns and demonstrate your commitment to improvement. For example, if a customer rates their experience poorly, reaching out to understand their issue can turn a detractor into a promoter.
Research highlights the importance of proactive behaviors in enhancing performance and meaningful work experiences. In one study, feedback-seeking behavior was positively associated with employee performance and personal initiative. This underscores the value of engaging with customers actively rather than waiting for issues to escalate.
Sobot’s Omnichannel Solution simplifies this process by consolidating feedback from multiple channels into a single platform. Whether a customer leaves a comment on social media or submits a survey response, you can respond promptly and consistently. This approach not only improves satisfaction but also strengthens customer loyalty by showing that you value their input.
| Key Finding | Description |
|---|---|
| Feedback-Seeking Behavior | Positively associated with employee performance through meaningfulness and personal initiative. |
| Study Samples | Tested using 196 supervisor-subordinate dyads in China and 207 full-time employees in the UK. |
| Contribution | Highlights the importance of proactive behaviors in enhancing performance and meaningful work experiences. |
Personalizing Customer Interactions Using AI and Automation
Personalization is a game-changer for improving NPS and CSAT scores. Customers appreciate tailored experiences that cater to their unique needs and preferences. AI and automation make this possible by analyzing large volumes of customer data to identify patterns and predict behaviors. For example, AI can recommend solutions based on a customer’s past interactions, creating a seamless and satisfying experience.
Sobot’s AI-powered tools, such as its Voice/Call Center and Omnichannel Solution, excel in this area. The AI-powered voicebot can handle repetitive queries, freeing agents to focus on complex issues. Meanwhile, the platform’s analytics provide actionable insights, helping you refine your strategies and deliver more personalized support.
Studies show that effective personalization strengthens consumer–brand relationships and increases satisfaction and loyalty. However, it’s essential to balance convenience with ethical considerations, as excessive reliance on algorithms can undermine customer autonomy. By using AI responsibly, you can enhance trust and ensure a positive customer experience.
- AI analyzes large volumes of customer data to provide tailored experiences, identifying patterns in preferences and behaviors.
- AI predicts potential issues before they arise, enhancing trust between businesses and clients.
- Algorithms streamline customer journeys based on prior behaviors and predicted preferences.
- Effective personalized experiences can strengthen consumer–brand relationships, satisfaction, and loyalty.
By adopting these strategies, you can create meaningful interactions that resonate with your customers, ultimately improving both NPS and CSAT scores.
Addressing Pain Points with Data-Driven Insights
Understanding and addressing customer pain points is essential for improving their experience and boosting loyalty. Data-driven insights allow you to identify these pain points with precision and implement targeted solutions. By leveraging advanced analytical methods, you can transform raw data into actionable strategies that enhance satisfaction and retention.
Identifying Pain Points with Analytics
To effectively address pain points, you need to first identify where customers encounter friction. Analytical tools like customer journey mapping and data pattern analysis help pinpoint these areas. For instance, customer journey mapping highlights specific stages where customers may face challenges, such as during checkout or post-purchase support. Data pattern analysis reveals common drop-off points, enabling you to focus on areas that require immediate attention.
Here’s a breakdown of key analytical methods and their benefits:
| Analytical Method | Description |
|---|---|
| Customer Journey Mapping | Identifies friction points throughout the customer experience, highlighting pain areas. |
| Big Data Utilization | Enhances personalization, leading to improved customer satisfaction. |
| Predictive Analytics | Forecasts customer behavior and trends, allowing proactive adjustments to meet customer needs. |
| Data Pattern Analysis | Reveals common friction points where customers may drop off, guiding areas for improvement. |
| AI Integration | Provides tools to detect emerging trends and behaviors, keeping businesses ahead of customer needs. |
For example, predictive analytics can forecast when a customer might churn, giving you the opportunity to intervene with personalized offers or support. This proactive approach not only resolves issues but also strengthens trust and loyalty.
Leveraging Sobot’s Tools for Data-Driven Solutions
Sobot’s solutions empower you to harness data effectively to address pain points. The Voice/Call Center, for instance, offers real-time call tracking and analytics. These features allow you to monitor customer interactions and identify recurring issues. If customers frequently report dissatisfaction with long wait times, you can use Sobot’s intelligent IVR and smart call routing to streamline workflows and reduce delays.
The Omnichannel Solution further enhances your ability to gather and analyze feedback. By consolidating data from multiple channels, such as email, chat, and social media, you gain a comprehensive view of customer behavior. This unified approach simplifies the process of identifying pain points and implementing corrective actions. For example, Samsung achieved a 97% CSAT score by using Sobot’s omnichannel platform to address fragmented communication and improve service quality.
Turning Insights into Action
Once you identify pain points, the next step is to act on the insights. Start by prioritizing issues that have the most significant impact on customer satisfaction. For instance, if NPS surveys reveal that detractors often cite poor follow-up as a concern, you can implement automated reminders or follow-up calls using Sobot’s AI-powered voicebot. This ensures no customer feels neglected, improving both NPS and CSAT scores.
Additionally, data-driven insights help you personalize interactions. By analyzing customer preferences and past behaviors, you can tailor your responses to meet their specific needs. Personalization not only resolves issues more effectively but also leaves a lasting positive impression. Studies show that personalized experiences increase customer satisfaction and loyalty, making it a critical strategy for long-term success.
Tip: Regularly review your data to stay ahead of emerging trends. Tools like Sobot’s analytics dashboard provide real-time updates, ensuring you remain proactive in addressing customer needs.
By adopting a data-driven approach, you can turn challenges into opportunities. This not only improves customer satisfaction but also enhances your overall business performance.
NPS and CSAT are essential for understanding customer satisfaction and loyalty. Companies like Amazon, with an NPS of 62, and Apple, achieving an 80% CSAT score, demonstrate how these metrics drive success. Microsoft uses both to refine strategies, identifying loyal customers and improving service quality. Tools like Sobot's Voice/Call Center simplify this process. Features such as real-time analytics and AI-powered voicebots help you gather actionable insights and address customer concerns effectively. By implementing these strategies, you can enhance customer experiences, foster loyalty, and achieve measurable growth. Start optimizing today!
FAQ
What is a good NPS score for my business?
A good NPS score depends on your industry. Generally, a score above 30 is considered good, while anything over 70 is excellent. Regularly tracking your score helps you understand customer loyalty and identify areas for improvement.
How does NPS impact customer retention rate?
A high NPS score indicates loyal customers who are more likely to stay with your business. Loyal customers contribute to a higher customer retention rate, which directly impacts your revenue and long-term growth.
How often should I measure NPS?
You should measure your NPS score quarterly or biannually. This frequency allows you to track trends and make timely adjustments to improve customer loyalty and satisfaction.
Can NPS and CSAT be used together?
Yes, combining NPS and CSAT provides a comprehensive view of customer sentiment. While NPS measures loyalty, CSAT focuses on satisfaction with specific interactions. Together, they help you improve both short-term and long-term customer experiences.
How can Sobot help improve my NPS score?
Sobot’s tools, like the Voice/Call Center and Omnichannel Solution, streamline communication and provide real-time insights. These features help you address customer concerns quickly, enhancing satisfaction and boosting your NPS score.
See Also
Enhance Customer Satisfaction with These 10 Live Chat Tips
Top Practices for Effective Call Center Quality Management
Improve Call Center Efficiency Through Effective Monitoring Techniques
