Understanding Net Promoter Score Benchmarks Across Industries
Net Promoter Score (NPS) measures how likely customers are to recommend your business. It reveals insights into customer loyalty and highlights areas for improvement. By comparing your NPS to net promoter score benchmarks by industry, you can evaluate your performance and set realistic goals. For example, industries like insurance achieve high scores, while logistics face unique challenges.

Businesses such as Sobot use NPS benchmarks to enhance customer satisfaction and improve customer experience. Sobot’s intelligent solutions, including its Voice/Call Center, help you address customer feedback effectively, meet customer expectations, and optimize customer interactions.
A 7% increase in NPS often drives a 1% revenue growth, showing how customer feedback directly impacts business outcomes.
What is Net Promoter Score (NPS)?
Definition and purpose of NPS
Net Promoter Score (NPS) is a customer loyalty metric that evaluates how likely customers are to recommend your products or services to others. This metric, widely recognized by industry leaders, provides a clear snapshot of customer satisfaction and loyalty.
The primary purposes of NPS include:
| Purpose | Description |
|---|---|
| Measuring customer loyalty | NPS gauges customer loyalty by assessing how likely customers are to recommend a product or service. |
| Facilitating word-of-mouth | High NPS ratings indicate customers are likely to engage in positive word-of-mouth marketing. |
| Identifying areas for improvement | A low NPS score alerts businesses to potential issues in customer experience that need addressing. |
| Benchmarking against competitors | NPS allows businesses to compare their scores with industry competitors for context and improvement. |
| Predicting business growth | Research shows a strong correlation between high NPS and business growth, indicating future success. |
How NPS is calculated
NPS is calculated using responses to a single question: “On a scale of 0 to 10, how likely are you to recommend our company to a friend or colleague?” Customers are grouped into three categories based on their scores:
- Promoters: Score 9–10. These are your most loyal customers.
- Passives: Score 7–8. These customers are satisfied but not enthusiastic.
- Detractors: Score 0–6. These customers are unhappy and may harm your brand through negative feedback.
The formula for calculating NPS is:
NPS = (% of Promoters - % of Detractors) × 100
For example, if 60% of respondents are Promoters and 20% are Detractors, your NPS would be 40.
Promoters, passives, and detractors explained
| Category | Score Range | Description |
|---|---|---|
| Promoters | 9–10 | Most enthusiastic and loyal customers. |
| Passives | 7–8 | Satisfied but unenthusiastic; may easily switch to competitors. |
| Detractors | 0–6 | Unhappy customers who could damage your brand through negative word-of-mouth. |

Understanding these categories helps you identify strengths and weaknesses in your customer experience. Tools like Sobot’s Voice/Call Center can assist in addressing detractor concerns and turning passives into promoters.
Why do NPS benchmarks vary by industry?

Definition of NPS benchmarks
NPS benchmarks represent the average Net Promoter Score for a specific industry. These benchmarks help you compare your performance against competitors and understand where you stand in your market. They provide a reference point for evaluating customer loyalty and satisfaction.
For example, industries like professional services and consumer goods often achieve higher NPS scores due to their focus on personalized customer experiences. In contrast, industries such as telecommunications and internet services tend to have lower scores because of high competition and customer dissatisfaction.
| Industry | Average NPS | Definition of Good NPS |
|---|---|---|
| Higher Education | 32 | Above 0 is good; 50+ is above average |
| Department Stores | 58 | Industry-specific benchmarks apply |
| Hotel Industry | 39 | Varies by sector, with specific averages |
These benchmarks allow you to set realistic goals and identify areas for improvement. Tools like Sobot’s Voice/Call Center can help you address customer concerns and improve your NPS survey response rates.
Factors influencing NPS benchmarks by industry
Several factors shape NPS benchmarks across industries. These include competition, customer expectations, and external conditions.
- Competition: Industries with fewer competitors, such as luxury goods, often see higher NPS scores. Customers in these markets tend to have fewer alternatives, which increases loyalty.
- Customer Expectations: High expectations in industries like technology can lead to lower scores if companies fail to meet them. For instance, customers expect seamless experiences from SaaS providers.
- External Conditions: Events like the pandemic caused a 15-point drop in average NPS scores across industries. This highlights how external factors can impact customer satisfaction.
- Cultural Differences: Regional attitudes influence how customers rate companies. For example, customers in Japan may give lower scores due to cultural norms, even if they are satisfied.
| Factor | Description |
|---|---|
| Niche competition | NPS is lower in highly competitive niches where customers are less tolerant of mistakes. In industries with limited competition, customers tend to rate their choices higher. |
| External conditions | Factors such as political, economic, or environmental conditions can negatively impact customer satisfaction, as evidenced by the drop in NPS during the pandemic. |
| Cultural differences | NPS scores vary by region; cultural attitudes can affect how customers rate companies. For instance, lower scores in Japan may indicate a need for improved customer experience rather than a general reluctance to give high ratings. |
Understanding these factors helps you interpret your NPS results more effectively. Sobot’s solutions, such as its AI-powered Voicebot, can assist in addressing customer needs and adapting to these influences.
Examples of industry-specific variations
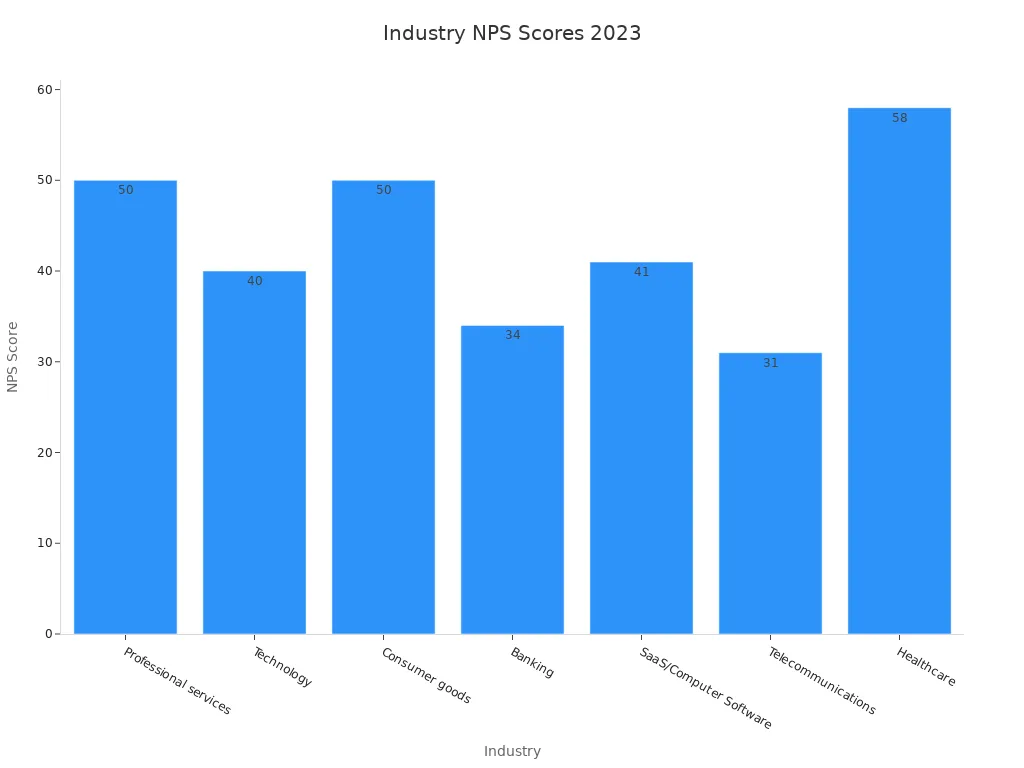
NPS benchmarks vary significantly across industries. For instance, professional services often achieve an average NPS of +50, while telecommunications average around +31. These differences reflect the unique challenges and customer expectations in each sector.
| Industry | NPS Score (2023) | Top Quartile NPS | Bottom Quartile NPS |
|---|---|---|---|
| Professional services | +50 | +73 | +19 |
| Technology | +40 | +64 | +11 |
| Consumer goods | +50 | +72 | +21 |
| Banking | +34 | N/A | N/A |
| SaaS/Computer Software | +41 | N/A | N/A |
| Telecommunications | +31 | N/A | N/A |
| Healthcare | +58 | N/A | N/A |
For example, First Republic Bank achieved an NPS of 72 in 2022, while Goldman Sachs scored only 5. Similarly, Fitbit scored 12 in the wearables market, whereas Garmin had a score of -2. These variations highlight the importance of benchmarking against similar companies within your industry.
By leveraging tools like Sobot’s unified workspace, you can analyze your NPS survey results and implement strategies to improve customer satisfaction. This approach ensures you stay competitive in your market.
What is a good NPS score for your industry?
Understanding the NPS score range
Net Promoter Score (NPS) ranges from -100 to +100, reflecting customer loyalty and satisfaction. A score above 50 is generally considered good, while 70 or higher is exceptional. However, the interpretation of NPS scores depends on whether you use absolute or relative benchmarks.
-
Absolute NPS:
- Below 0: Indicates a poor customer experience.
- 0 to 30: Represents an acceptable level of customer satisfaction.
- 30 to 50: Suggests solid performance.
- 50 or more: Demonstrates excellent customer loyalty.
-
Relative NPS: Compares your score to industry peers for a more accurate evaluation. For example, a score of 40 might be outstanding in telecommunications but average in retail.

Tracking your NPS over time is equally important. Consistent improvement signals that your efforts to enhance customer experience are paying off. Tools like Sobot’s Voice/Call Center can help you gather actionable customer feedback to boost your NPS.
Industry-specific standards for "good" NPS scores
Different industries have unique benchmarks for what qualifies as a "good" NPS score. These variations stem from differing customer expectations and market dynamics. Below is a table summarizing average NPS scores across industries:
| Industry | Average NPS | Source |
|---|---|---|
| Technology & Software | 50-70 | QuestionPro |
| Retail and E-commerce | 40-60 | Growfrog.io |
| Finance and Banking | 30-50 | Fullview.io |
| Healthcare | 30-60 | Doran |
| Telecommunications | 20-40 | The CX Lead |
| Hospitality and Travel | 50-70 | Fullview.io |
For instance, a score of 50 in healthcare indicates strong performance, while the same score in hospitality might be average. Understanding these benchmarks helps you set realistic goals and measure success effectively.
The role of context in evaluating NPS
Context plays a crucial role in interpreting NPS scores. Factors like demographics, cultural norms, and data collection methods can influence results. For example:
| Contextual Factor | Description |
|---|---|
| Demographic Variations | Older customers may rate services lower despite being satisfied. |
| Cultural Expectations | A score of 8 might be excellent in one region but average in another. |
| Mode of Administration | Online surveys often yield different results than in-person interviews. |
These nuances highlight the importance of tailoring your NPS strategy to your audience. Sobot’s AI-powered Voicebot can help you adapt to these contextual factors by providing personalized customer interactions, ensuring your NPS scores reflect genuine customer satisfaction.
Average NPS benchmarks by industry

NPS benchmarks for retail and ecommerce
Retail and ecommerce businesses often achieve strong Net Promoter Scores due to their focus on customer experience and convenience. The average NPS for this industry ranges between 40 and 60, with top-performing companies exceeding 70. High scores reflect customer satisfaction with fast delivery, easy returns, and personalized shopping experiences. For example, Amazon consistently ranks among the leaders in ecommerce NPS due to its seamless service and customer-centric approach.
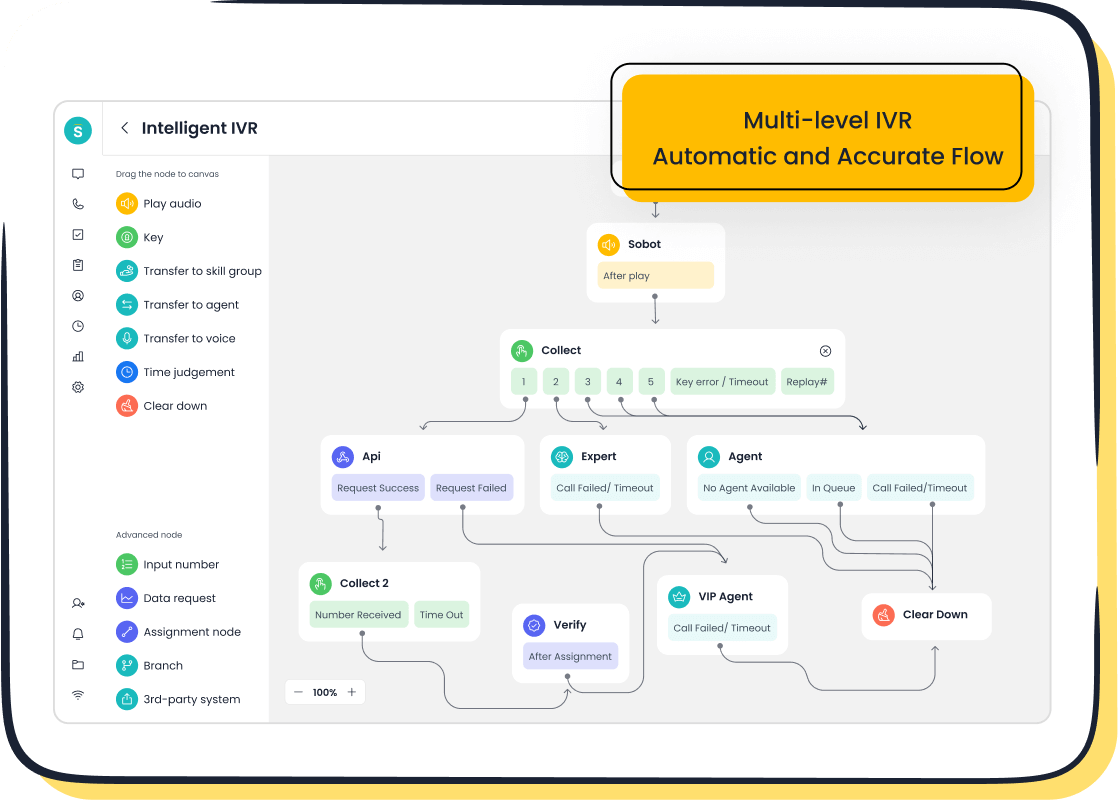
Retailers can improve their NPS by addressing detractor feedback and enhancing customer interactions. Tools like Sobot’s Voice/Call Center help businesses streamline communication and resolve issues quickly. Features such as intelligent IVR and call tracking provide actionable insights, enabling you to deliver better service and boost customer loyalty.
NPS benchmarks for SaaS and technology
SaaS and technology companies face unique challenges in maintaining high NPS scores. Collaboration between product and marketing teams plays a crucial role in driving customer referrals. A good NPS for SaaS typically starts at 30, while scores above 70 indicate world-class customer loyalty. Enterprise SaaS companies often score between 30 and 35, mid-market businesses range from 40 to 50, and startups experience varied results due to fluctuating customer sentiment.
To achieve higher scores, SaaS companies must focus on delivering sustained product value and exceptional customer support. Sobot’s AI-powered Voicebot can assist in this area by providing intelligent interactions and intent recognition. These features help you address customer concerns effectively, ensuring satisfaction and loyalty.
NPS benchmarks for healthcare and financial services
Healthcare NPS benchmarks reveal significant variations across providers and care settings. Hospitals typically score between 35 and 45, while private practices aim for scores above 50. Exceptional institutions like Mayo Clinic achieve scores around 70, reflecting high patient loyalty and advocacy. Health insurers, however, often struggle with lower scores ranging from 10 to 30 due to claims-related issues.
| Category | NPS Score Range | Description |
|---|---|---|
| Good NPS in Healthcare | Above 50 | Indicates high patient satisfaction and loyalty. |
| Exceptional NPS | Above 70 | Considered exceptional in the industry. |
| Hospitals | 35 to 45 | Typical range for hospitals. |
| Health Insurers | 10 to 30 | Lower scores due to claims issues. |
| Mayo Clinic | Around 70 | Recognized for exceptional care. |
In financial services, top banks often exceed an NPS of 50, while the average ranges from 30 to 40. Exceptional scores above 70 highlight outstanding customer loyalty. Sobot’s solutions, such as its unified workspace, can help healthcare and financial institutions improve patient experience and customer satisfaction by streamlining communication and resolving issues efficiently.
NPS benchmarks for entertainment and gaming
The entertainment and gaming industry often sees varied Net Promoter Score (NPS) results due to its diverse customer base and rapidly evolving trends. On average, the entertainment sector achieves an NPS of 41, according to a 2020 CustomerGauge study. This score reflects the industry's ability to engage audiences through immersive experiences and innovative content. However, challenges such as technical issues, delayed updates, or poor customer support can negatively impact customer satisfaction.
Gaming companies, in particular, face unique hurdles. Players expect seamless gameplay, quick issue resolution, and regular updates. A single negative experience can turn promoters into detractors. To stay competitive, businesses must prioritize customer feedback and address concerns promptly. For example, companies that actively resolve technical glitches and enhance user experiences often see higher NPS scores.
Improving your NPS in this industry requires a proactive approach. Tools like Sobot’s Voice/Call Center can help you achieve this by streamlining customer interactions. Features such as intelligent IVR and AI-powered Voicebots enable you to resolve issues quickly and efficiently. By leveraging these tools, you can enhance customer satisfaction and foster loyalty, ultimately boosting your NPS.
How Sobot's Voice/Call Center supports businesses in achieving better NPS
Sobot’s Voice/Call Center offers a comprehensive solution to help businesses improve their NPS. Its advanced features, such as smart call routing and real-time monitoring, ensure that customer inquiries are handled efficiently. This reduces wait times and enhances the overall customer experience.
The platform has already helped over 10,000 brands improve their NPS. For instance, it has reduced inbound discussion volume by 20% while increasing positive feedback to over 96%. Additionally, Sobot’s AI-powered Voicebot delivers accurate responses to more than 80% of customer queries, achieving a customer satisfaction (CSAT) score of 97%. These results demonstrate the platform’s effectiveness in addressing customer needs and improving loyalty.
| Evidence Description | Result/Impact |
|---|---|
| Improved NPS for over 10,000 brands | Reduced costs and increased efficiency |
| Reduced inbound volume by 20%, increased positive feedback to 96%+ | Enhanced customer satisfaction |
| Over 80% accuracy in responses, 95%+ customer satisfaction | High accuracy and loyalty |
| 22.2% of questions answered independently, CSAT score of 97% | Increased self-service rates |
| Solved 85% of problems, 99% customer happiness | High problem resolution rates |
By integrating Sobot’s Voice/Call Center, you can address customer concerns effectively, reduce operational inefficiencies, and achieve higher NPS benchmarks. This approach not only improves customer satisfaction but also strengthens your brand’s reputation in the industry.
How to use NPS benchmarks effectively
Setting realistic NPS goals for your business
Setting realistic goals for your net promoter score begins with understanding your industry’s performance metrics. Comparing your current NPS to industry averages provides valuable context. For example, if your industry’s average NPS is 40, aiming for a score of 50 or higher positions your business as a leader in customer loyalty. This approach ensures your goals are both ambitious and achievable.
To identify areas for improvement, analyze your customer feedback. Segment responses into promoters, passives, and detractors to uncover patterns. For instance, detractors may highlight recurring issues, such as long wait times or poor product quality. Addressing these concerns can significantly boost your score.
A structured plan helps you stay on track. Establish short-term and long-term targets, such as increasing your NPS by 10 points within a year. Regularly review your progress and adjust your strategies as needed. Tools like Sobot’s Voice/Call Center simplify this process by providing real-time insights into customer interactions, enabling you to make data-driven decisions.
| Aspect | Description |
|---|---|
| Contextual assessment | Provides context for your NPS score, allowing comparison with competitors. |
| Identifying areas for improvement | Reveals gaps in customer experience efforts based on industry averages. |
| Setting goals and targets | Helps establish realistic NPS improvement goals by aiming to exceed industry averages. |
Comparing your NPS to industry benchmarks
Comparing your NPS to industry benchmarks helps you evaluate your performance against competitors. This comparison highlights your strengths and weaknesses, offering a clear roadmap for improvement. For instance, if your NPS is below the industry average, focus on addressing customer pain points. Conversely, if your score exceeds the benchmark, identify what you’re doing well and amplify those efforts.
When comparing scores, consider factors like company size, geographic location, and customer demographics. A small business in a niche market may have different benchmarks than a global enterprise. For example, a local coffee shop might aim for an NPS of 60, while a multinational chain could target 50 due to broader operational challenges.
Sobot’s solutions, such as its AI-powered Voicebot, can help you analyze your NPS data effectively. By segmenting feedback and identifying trends, you can tailor your strategies to meet customer expectations. This ensures your efforts align with industry standards and drive meaningful improvements in customer experience.
Strategies for improving NPS with Sobot's solutions
Improving your net promoter score requires a combination of targeted strategies and effective tools. Start by designing structured NPS surveys to gather actionable feedback. Use this data to identify patterns among promoters, passives, and detractors. For example, promoters may appreciate your fast response times, while detractors might cite issues with product quality.
Sobot’s Voice/Call Center offers features that directly address these challenges. Intelligent IVR and smart call routing reduce wait times, enhancing the customer experience. Real-time monitoring and analytics provide insights into customer interactions, helping you identify areas for improvement. Additionally, the AI-powered Voicebot handles repetitive queries, freeing your team to focus on complex issues.
Closed-loop feedback is another powerful strategy. Inform customers how their feedback has led to changes. For instance, if detractors mention long hold times, implement Sobot’s smart call routing to resolve this issue. Then, communicate the improvement to your customers. This approach not only boosts satisfaction but also fosters loyalty.
| Strategy | Description |
|---|---|
| Designing NPS Surveys | Create structured surveys to gather customer feedback effectively. |
| Analyzing NPS Data | Segment feedback into promoters, passives, and detractors to identify patterns. |
| Integrating Feedback | Share insights across departments to foster a unified improvement strategy. |
| Benchmarking Against Standards | Compare NPS with industry averages to set clear success metrics. |
| Utilizing Statistical Methods | Apply hypothesis testing to validate observed differences in feedback over time. |
| Closed-Loop Feedback | Inform customers how their feedback has led to changes, enhancing their engagement. |
| Regular Review Cycles | Establish periodic meetings to assess the effectiveness of implemented changes and refine strategies. |
By leveraging Sobot’s solutions and adopting these strategies, you can improve your NPS and strengthen your brand’s reputation. This not only enhances customer satisfaction but also drives long-term business growth.
Leveraging NPS insights to enhance customer experience
Net Promoter Score (NPS) insights provide a powerful tool for improving customer experience. By analyzing feedback, you can uncover patterns and identify areas that need attention. For example, categorizing responses into promoters, passives, and detractors helps you pinpoint common issues like long wait times or unclear communication. Addressing these pain points leads to measurable improvements in customer satisfaction.
Companies like Wells Fargo and American Airlines use NPS data to track customer behaviors and optimize their services. They focus on actionable strategies, such as reallocating resources to reduce wait times or enhancing service quality. These efforts result in higher customer loyalty and satisfaction. Similarly, you can leverage NPS insights to refine your processes and deliver a better experience.

To make the most of NPS data, start by analyzing survey results. Look for recurring themes in detractor feedback, such as delays or poor support. Use tools like Sobot’s Voice/Call Center to streamline communication and resolve issues efficiently. Features like intelligent IVR and real-time monitoring help you address customer concerns quickly, improving satisfaction rates.
Another effective strategy involves closing the feedback loop. Inform customers about the changes you’ve made based on their input. For instance, if detractors mention long hold times, implement smart call routing to reduce delays. Then, communicate these improvements to your customers. This approach not only enhances their experience but also builds trust and loyalty.
NPS insights also help you anticipate customer needs. By tracking trends over time, you can identify shifts in expectations and adapt your strategies accordingly. For example, if customers increasingly value self-service options, integrating AI-powered tools like Sobot’s Voicebot can meet this demand. These tools handle repetitive queries, freeing your team to focus on complex issues and ensuring a seamless experience.
Finally, use NPS benchmarks to compare your performance with industry standards. This comparison highlights areas where you excel and those needing improvement. For instance, if your NPS is below the average for your industry, focus on addressing detractor feedback. Conversely, if your score exceeds the benchmark, amplify the strategies that contribute to your success.
By leveraging NPS insights effectively, you can transform customer feedback into actionable improvements. This not only enhances customer experience but also strengthens your brand’s reputation and drives long-term growth.
Why NPS benchmarks matter for businesses
The connection between NPS and customer loyalty
Net Promoter Score (NPS) serves as a reliable indicator of customer loyalty. When customers rate your business highly, they are more likely to recommend your services, engage with your brand, and remain loyal over time. Studies confirm this connection. For instance:
- A study published in the Journal of Marketing revealed that a 7-point increase in NPS correlates with a 1% growth in revenue.
- Bain & Company found that businesses achieving long-term profitable growth often have NPS scores twice the industry average.
These findings highlight how NPS benchmarks help you measure loyalty and identify areas for improvement. By analyzing customer feedback, you can uncover patterns that drive satisfaction and loyalty. Tools like Sobot’s Voice/Call Center simplify this process by providing actionable insights into customer interactions. Features such as real-time monitoring and AI-powered Voicebots enable you to address concerns effectively, fostering stronger relationships with your customers.
How NPS impacts business growth and revenue
NPS directly influences business growth and revenue by reflecting customer satisfaction and loyalty. Higher scores often indicate a positive customer experience, which drives repeat purchases and word-of-mouth referrals. Research supports this connection:
| Study | Findings | Correlation | Notes |
|---|---|---|---|
| Baehre et al. (2022) | NPS predicted future revenue | Not specified | Suggests NPS may reflect brand awareness more than loyalty. |
| Mecredy et al. (2018) | Positive correlation with revenue | Positive | Growth came from all NPS classes, though promoters had modest impact. |
| Korneta (2018) | Non-significant relationship with revenue | Non-significant | Higher NPS correlated with profitability, but mechanism unclear. |
| Fiserova et al. (2018) | NPS linked to store sales growth | Positive | Data from a UK furniture retailing chain showed growth for 6 months. |
| Sauro (2019) | Positive correlation in 11 of 14 industries | r = .35 | Companies with higher NPS grew faster over two years. |
These studies demonstrate how NPS benchmarks provide valuable insights into your business’s financial health. By leveraging tools like Sobot’s Voice/Call Center, you can improve customer satisfaction and loyalty, ultimately driving revenue growth. Features such as intelligent IVR and smart call routing reduce wait times, ensuring a seamless experience for your customers.
Using NPS benchmarks to stay competitive in your industry
NPS benchmarks act as a competitive tool, helping you evaluate your performance against industry standards. By comparing your score to competitors, you can identify strengths and weaknesses, refine your strategies, and enhance customer experience. For example:
| Industry | NPS Score | Insights on Competitors' Strengths and Weaknesses |
|---|---|---|
| Tech | 50 | Tailor strategies to outperform competitors in tech. |
| Healthcare | 45 | Identify areas for improvement in patient satisfaction. |
| Retail | 60 | Understand customer loyalty trends in retail. |
Benchmarking NPS against industry averages helps you evaluate customer satisfaction and loyalty. It also informs strategic decisions, such as reallocating resources to address detractor feedback or amplifying efforts that resonate with promoters.
To stay competitive, follow these steps:
- Evaluate your company’s NPS against industry averages.
- Identify strengths and weaknesses compared to competitors.
- Make informed decisions to enhance customer experience.

Sobot’s solutions, such as its AI-powered Voicebot, can help you analyze NPS data effectively. By addressing customer expectations and feedback, you can improve satisfaction rates and maintain a competitive edge in your industry.
Understanding net promoter score benchmarks by industry helps you evaluate your performance and identify areas for growth. By leveraging these insights, you can set realistic goals and enhance customer satisfaction. Tools like Sobot's Voice/Call Center simplify this process by streamlining communication and resolving customer concerns efficiently. For example, its intelligent IVR and real-time monitoring features ensure faster issue resolution, improving customer loyalty.
Continuous improvement in NPS performance drives long-term success. Companies with high NPS scores often outperform competitors in revenue growth and retention. Enhancing customer experience not only increases the number of promoters but also ensures your business adapts to market changes. This focus on customer satisfaction leads to incremental revenues and sustained growth, making NPS a vital metric for your business strategy.
FAQ
What is the difference between NPS and customer satisfaction scores?
NPS measures customer loyalty by asking how likely they are to recommend your business. Customer satisfaction scores focus on immediate experiences, like resolving an issue. For example, NPS reflects long-term loyalty, while satisfaction scores evaluate short-term interactions. Both metrics complement each other for a complete view of customer experience.
How often should you measure your NPS?
You should measure your NPS quarterly or after significant customer interactions. Regular tracking helps you identify trends and address issues promptly. For instance, using tools like Sobot’s Voice/Call Center ensures you gather consistent feedback and act on it effectively to improve customer loyalty.
Can NPS predict business growth?
Yes, NPS can predict growth. Studies show a 7% increase in NPS often leads to a 1% revenue boost. High scores indicate loyal customers who drive referrals and repeat purchases. Sobot’s solutions help businesses improve their NPS, fostering growth through better customer experiences.
How can Sobot help improve your NPS?
Sobot’s Voice/Call Center enhances customer interactions with features like smart call routing and AI-powered Voicebots. These tools reduce wait times and resolve issues efficiently. For example, businesses using Sobot have achieved a 97% customer satisfaction rate, which directly contributes to higher NPS.
What is a good NPS for small businesses?
A good NPS for small businesses depends on the industry. For example, retail averages 40-60, while SaaS scores range from 30-50. Small businesses should aim to exceed their industry average. Tools like Sobot’s unified workspace help you analyze feedback and improve your score.
See Also
Comparative Analysis of Leading Customer Feedback Tools
Best Ten Customer Insight Software Options for 2024
Enhance Retail Engagement Through Effective Live Chat
