Customer Satisfaction Metrics Showdown NPS, CSAT, CES, and More


You will not find a single best metric for customer satisfaction. The metrics used to measure customer satisfaction—such as NPS, CSAT, and CES—each fit different needs and stages in the customer journey. Sobot supports businesses in retail, finance, gaming, and more, helping you track and improve satisfaction. Studies show satisfied customers boost sales, return more often, and recommend your brand. Consider your customer touchpoints and desired outcomes before choosing a metric.
Sales Performance
Customer Retention
Brand Advocacy
Higher satisfaction drives repeat purchases
Satisfied customers return more often
Customers recommend your brand
What Are Customer Satisfaction Metrics?
Definition and Importance
You use metrics to measure customer satisfaction because you want to understand how your customers feel about your business. Customer satisfaction metrics help you track the quality of your service and products. These metrics are key performance indicators that show how well you meet customer needs. You often see customer satisfaction measured through customer feedback at important touchpoints. For example, you might ask customers to rate their experience using smiley faces, thumbs up or down, or star ratings. Customer satisfaction surveys collect this data and help you spot customer satisfaction trends.
Customer experience metrics include several types of measurements. CSAT is the primary metric for assessing customer experience. You use CSAT scores to measure satisfaction with specific aspects of your business. No single metric can capture the full complexity of customer experience. You need to look at different metrics used to measure customer satisfaction to get a complete picture.
Why Businesses Measure Customer Satisfaction
Measuring customer satisfaction helps you improve your business. When you track customer experience metrics, you learn what your customers like and what needs fixing. You use metrics used to measure customer satisfaction to make better decisions and boost your business success.
Here are some reasons why you measure customer satisfaction:
Customers become advocates and share positive word-of-mouth.
Brand loyalty grows as satisfied customers return.
Customer retention rates rise, lowering the risk of losing customers.
Your brand reputation improves, attracting new customers.
Revenue increases because satisfied customers buy again.
Customer satisfaction is a key step toward loyalty. You need satisfied customers before you can build loyalty. Trust plays a big role in customer retention. Firms that focus on relationships beyond satisfaction see more success. Customer loyalty also makes marketing easier and reduces costs.
You use customer experience metrics to guide your strategy. By measuring customer satisfaction, you can spot customer satisfaction trends and act quickly. You build trust and keep customers coming back. Metrics used to measure customer satisfaction help you stay ahead and grow your business.
Key Metrics Used to Measure Customer Satisfaction

You can measure customer satisfaction in many ways. Each customer satisfaction metric gives you a different view of the customer experience. Let’s look at the most common ones.
Net Promoter Score (NPS)
Net promoter score helps you measure customer loyalty. You ask customers, “How likely are you to recommend our company?” on a scale from 1 to 10. NPS groups customers into promoters, passives, and detractors. Promoters are loyal and likely to refer others. Detractors may not return. You calculate NPS by subtracting the percentage of detractors from the percentage of promoters. This customer satisfaction metric shows how well you turn customers into advocates.
Sobot’s contact center and omnichannel solutions let you send NPS surveys through voice, chat, or email. You can track results in real time and see trends with over 300 reports.
Metric | Purpose | Measurement Method | Example Question | Calculation Formula |
|---|---|---|---|---|
NPS | Assesses customer loyalty and likelihood to recommend | One question on a scale of 1-10 | How likely are you to recommend our company? | Total Percentage of Promoters – Total Percentage of Detractors |
Customer Satisfaction Score (CSAT)
Customer satisfaction score tells you how happy customers are with a product or service. You ask, “How satisfied are you with your recent purchase?” Customers answer on a scale from 1 to 5.
“CSAT is typically measured by asking customers a simple question, such as: ‘How satisfied are you with our product?’ Respondents rate their satisfaction on a scale from 1 to 5, with 1 being ‘Very Unsatisfied’ and 5 being ‘Very Satisfied.’”
You find your CSAT by dividing the number of positive ratings (4 or 5) by the total responses, then multiplying by 100. Sobot’s AI-powered chatbots and live chat tools help you collect and analyze CSAT data across all channels.
Customer Effort Score (CES)
Customer effort score measures how easy it is for customers to get help or complete a task. You ask, “How easy was it to resolve your issue?” Customers rate their experience from “Very Easy” to “Very Difficult.” CES works well after support calls, live chats, or using self-service tools. Sobot’s voicebot and ticketing system make it simple to gather CES feedback and spot areas for improvement.
Other Metrics (Churn Rate, Lifetime Value)
You can also use other customer satisfaction metrics. Churn rate shows the percentage of customers who leave over time. Customer lifetime value tells you how much revenue you can expect from a customer during their relationship with your business. Sobot’s reporting tools help you track these numbers and understand your customer experience better.
Comparing Customer Satisfaction Metrics
What Each Metric Measures
You need to know what each metric tells you about your customers. NPS, CSAT, and CES focus on different parts of the customer experience. NPS measures loyalty. CSAT shows satisfaction at a certain moment. CES tells you how easy it was for a customer to get help or finish a task.
Here is a table that shows the focus of each metric:
Metric | Focus | Description |
|---|---|---|
NPS | Loyalty | Measures long-term customer loyalty by asking how likely customers are to recommend a business. |
CSAT | Satisfaction | Captures satisfaction at a specific moment, such as after an interaction or a product purchase. |
CES | Effort | Assesses how easy it was for customers to complete a task, like resolving an issue or making a purchase. |
You can use these metrics together to get a full view of your customer satisfaction. For example, you might use NPS to see if customers will recommend your brand. You can use CSAT to check if they liked their last purchase. CES helps you find out if your support process is easy to use.
Relationship vs. Transactional Feedback
You should understand the difference between relationship and transactional feedback. NPS is a relationship metric. It measures how customers feel about your brand over time. CSAT is a transactional metric. It tells you how a customer feels after a single event, like a purchase or a support call.
Here is a table to help you see the difference:
Attribute | CSAT (Customer Satisfaction) | NPS (Net Promoter Score) |
|---|---|---|
Measurement Focus | Transactional (Specific interaction) | Relational (Overall brand loyalty) |
Primary Goal | Gauge satisfaction with a service, product, or interaction | Measure long-term customer loyalty and predict growth |
Typical Timing | Immediately after a key touchpoint | Periodically (e.g., quarterly, annually) |
Transactional metrics, like CSAT, give you quick feedback. You can use this feedback to fix problems right away. Relationship metrics, like NPS, show you how strong your connection is with your customers. This helps you plan for the future.
You can also look at the bigger picture:
Attribute | Transactional Metrics | Relationship Metrics |
|---|---|---|
Focus | Specific interactions (e.g., purchase, service contact) | Overall customer relationship and brand perception |
Purpose | Evaluate immediate customer satisfaction | Assess long-term loyalty and emotional connection |
Insights Provided | Tactical feedback for operational improvements | Strategic insights into customer loyalty and brand health |
You should use both types of feedback to improve your customer experience. CSAT helps you make quick changes. NPS helps you build long-term loyalty.
Calculation Methods
You need to know how to calculate each metric. Each one uses a different formula. Here is a table that shows how you can calculate NPS, CSAT, and CES:
Metric | Formula | Description |
|---|---|---|
CES | Sum of all effort ratings / number of responses | A lower average indicates less effort required. |
NPS | % Promoters - % Detractors | Ranges from -100 to +100, indicating customer loyalty. |
CSAT | Percentage satisfied | Measures customer satisfaction directly. |
For NPS, you ask customers how likely they are to recommend your business. You count the promoters and detractors. You subtract the percentage of detractors from the percentage of promoters. For CSAT, you ask how satisfied customers are. You divide the number of satisfied responses by the total responses. For CES, you ask how easy it was to solve a problem. You find the average score. Lower scores mean less effort for the customer.
Data Collection Touchpoints
You collect customer satisfaction data at different points in the customer journey. You can ask for feedback after a purchase, after a support call, or at regular times during the year. Each metric works best at certain touchpoints.
Use CSAT right after a customer finishes a purchase or talks to support.
Use CES after a customer completes a task, like resetting a password or getting help from a chatbot.
Use NPS at set times, like every quarter, to see how loyal your customers feel.
Sobot’s omnichannel solution lets you collect feedback across all channels. You can send surveys by voice, chat, email, or even WhatsApp. You can track results in real time and see trends with easy-to-read reports.
Samsung uses Sobot’s all-in-one contact center to collect and analyze customer feedback from many channels. This helps Samsung understand what customers need and improve customer satisfaction. Samsung saw a 30% increase in agent efficiency and reached a 97% customer satisfaction rate. The company uses feedback to make changes and build loyalty.
You can follow Samsung’s example. Use customer feedback and data analytics to improve your service. When you listen to your customers, you build trust and loyalty. This leads to better business results and a stronger brand.
Pros and Cons of Each Customer Satisfaction Metric
Advantages of NPS, CSAT, CES, and Others
You can use different metrics to measure customer satisfaction, and each one brings unique strengths to your business. Here is a table that shows the main advantages:
Metric | Advantages |
|---|---|
NPS | Ideal for periodic measurement to track trends in customer loyalty and satisfaction. |
CSAT | Flexible and detailed, allowing for specific interaction measurement and follow-up questions. |
CES | Provides actionable insights into areas causing unnecessary effort, targeting improvements effectively. |
NPS helps you see how loyal your customers are over time. CSAT gives you quick feedback after a specific event, like a purchase or support call. CES shows you where customers face challenges, so you can make things easier for them. When you use Sobot’s omnichannel solution, you can collect these metrics across voice, chat, email, and WhatsApp. Sobot’s real-time analytics help you spot trends and act fast to improve the customer experience.
Limitations and Considerations
While these metrics are helpful, you should know their limits. Here are some common challenges:
NPS reduces complex feelings into a single score, so you may miss important details.
NPS does not tell you why customers gave a certain score, making it hard to know what to fix.
CSAT only captures how a customer feels right after an interaction and may miss their overall experience.
CES assumes that less effort is always better, but sometimes a little effort is needed for complex purchases.
Sobot’s solutions help you overcome these limits. For example, Sobot’s Voice AI can detect emotional cues and handle complex issues during calls. The unified workspace lets agents see all customer data, so you get more context behind each score. Real-time adaptation means you can respond to feedback quickly and improve customer satisfaction at every touchpoint.
When to Use Each Metric for Measuring Customer Satisfaction
Practical Scenarios by Industry
You need to choose the right metric for each industry and touchpoint. Retail businesses often use CSAT after a purchase. You can ask customers how satisfied they feel with their shopping experience. Finance companies rely on CES after online transactions. You want to know if customers found it easy to complete payments or access support. Gaming companies use NPS to measure loyalty. You ask players if they would recommend your platform to friends.
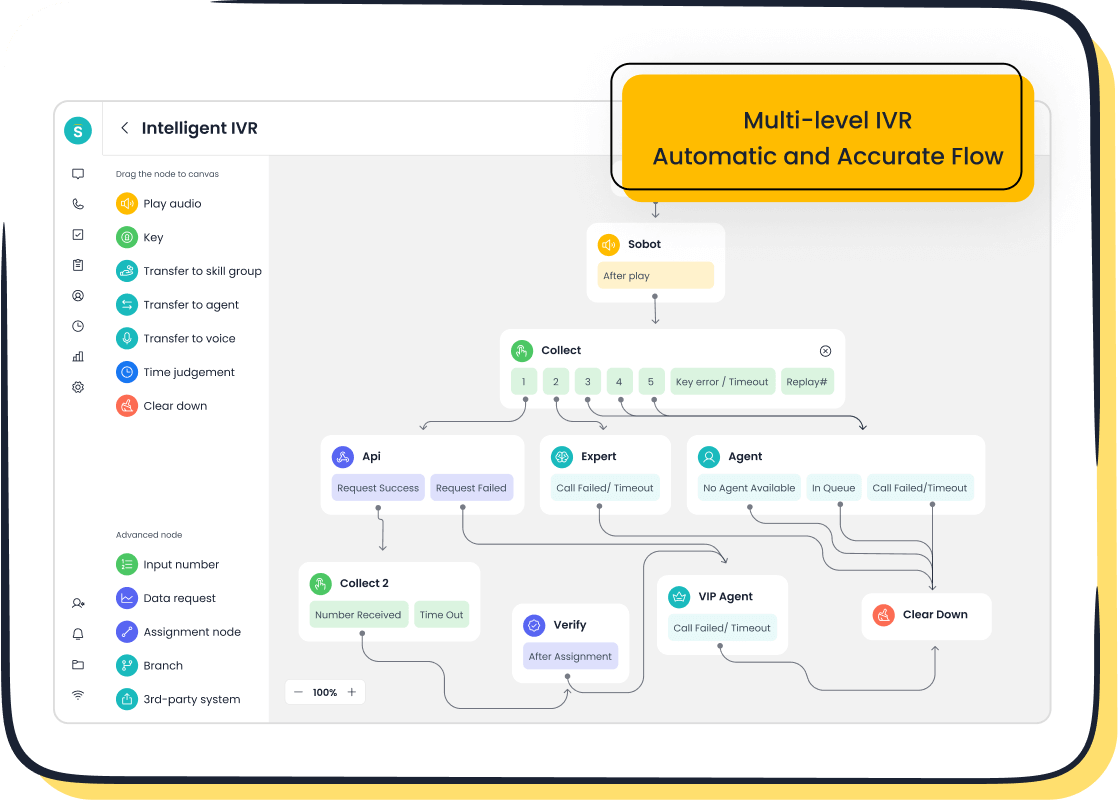
Sobot’s Voice/Call Center and Omnichannel Solution help you collect feedback at every stage. You can send surveys through voice, chat, email, or WhatsApp. You track responses and see trends in real time. Here is how Sobot’s solutions improve customer satisfaction in different industries:
Benefit | Description |
|---|---|
Faster Responses | You interact with customers quickly, reducing wait times and boosting satisfaction. |
Consistent Support | You provide uniform assistance across channels, enhancing the customer experience. |
Actionable Insights | You turn feedback into practical improvements, leading to higher satisfaction. |
Improved CSAT | You see systematic enhancements in satisfaction scores through effective execution. |
You see higher satisfaction, more repeat purchases, and lower churn rates. Satisfied customers help you reduce growth costs.
Sobot Solutions in Action
You can measure the impact of Sobot’s solutions using clear metrics. Businesses report lower costs per interaction and higher first contact resolution rates. You see average handle times drop by up to 50%. Customer satisfaction scores rise to 95%. Call abandonment rates fall by 33%. Agent retention improves, and you reach break-even in 60 to 90 days.
Metric | Pre-Deployment Value | Post-Deployment Value | Improvement |
|---|---|---|---|
Cost per Interaction | $5.00 - $25.00 | $0.50 - $5.00 | Significant reduction |
First Contact Resolution (FCR) | 70-75% | Over 90% | Increased efficiency |
Average Handle Time (AHT) | 100 seconds | 50-75 seconds | 25% to 50% reduction |
Customer Satisfaction (CSAT) | N/A | 95% | High satisfaction |
Call Abandonment Rate | 59% | 26% | 33% drop |
Agent Retention | N/A | Improved | Reduced burnout |
ROI | N/A | Break even in 60-90 days | Quick return on investment |
Samsung’s story shows the power of measuring customer experience. Samsung unified its channels with Sobot and saw a 30% increase in agent efficiency. The company reached a 97% satisfaction rate. You can use Sobot’s tools to collect feedback, analyze data, and improve every touchpoint. You build trust and loyalty with your customers.
Tip: Choose metrics based on your industry and customer journey. Use Sobot’s solutions to track, analyze, and act on feedback for better results.
Summary Table: NPS vs. CSAT vs. CES vs. Others

You want to choose the right customer satisfaction metric for your business. Each metric gives you a different view of your customer experience. The table below helps you compare the most popular options. You can see what each customer satisfaction metric measures, how you collect the data, and when to use it.
Tip: Use this table to match the right customer satisfaction metric to your goals. You can use more than one metric for a complete picture.
Metric | Purpose | Measurement Method | Optimal Usage Scenario |
|---|---|---|---|
NPS (Net Promoter Score) | Measures customer loyalty and advocacy | One question: “How likely are you to recommend our company?” | Best for checking relationship health and long-term loyalty |
CSAT (Customer Satisfaction Score) | Measures satisfaction with a specific interaction | 1-5 or 1-7 scale, percentage of satisfied responses | Ideal for quick feedback after purchases or support |
CES (Customer Effort Score) | Measures ease of completing a task | Customer effort rating, usually “Very Easy” to “Very Difficult” | Best for finding friction points in your process |
Churn Rate | Shows how many customers leave over time | Percentage of lost customers | Good for tracking overall retention |
Customer Lifetime Value | Estimates total revenue from a customer | Calculation based on average spend and retention | Useful for planning long-term strategy |
You can see that each customer satisfaction metric fits a different need. NPS works well when you want to know if customers will recommend your brand. CSAT helps you measure how happy customers feel after a single event. CES shows you if your process is easy or hard for customers. Churn rate and lifetime value give you a big-picture view of your business health.
You can use Sobot’s omnichannel solution to collect every customer satisfaction metric in one place. This helps you spot trends, fix problems, and improve your customer experience. When you choose the right customer satisfaction metric, you make better decisions and grow your business.
Using Multiple Customer Satisfaction Metrics Together
Building a Holistic Strategy
You get the best results when you combine different customer satisfaction metrics. Each metric gives you a unique view of your customers. When you use them together, you see the full picture. For example, you can track loyalty with NPS, measure happiness with CSAT, and spot pain points with CES. This approach helps you make better decisions and improve your service.
Here is a table that shows the main benefits of using multiple metrics:
Benefit | Description |
|---|---|
Comprehensive performance insights | You get a fuller picture by combining numbers and customer comments. |
Human-centered decision making | You focus on what your customers need and expect. |
Identification of improvement opportunities | You find areas to make your service better. |
Enhanced accountability and transparency | You show customers and your team how you deliver value. |
You can also:
Align your business goals with what your customers feel.
Shape better outcomes by understanding both success and experience.
Build long-term loyalty and growth.
Sobot’s unified platform makes this easy. You can collect NPS, CSAT, CES, and more in one place. The platform brings all your channels together, so you do not need separate tools. You can also use the API to create custom reports for your business needs. Many companies see higher agent efficiency and better customer satisfaction scores after using Sobot.
Avoiding Redundancy and Fatigue
You need to watch out for survey fatigue and confusion. If you ask too many questions, customers may stop answering. You might also get mixed signals if you do not choose the right metrics for each touchpoint. Here are some challenges you may face:
Data can get confusing if you collect too much at once.
It can be hard to pick the right metric for each situation.
You may not see what your customers really want if you do not manage your surveys well.
Your data may be incomplete or biased.
To avoid these problems, plan your surveys carefully. Use each metric where it fits best. Sobot helps you manage this process. You can set up smart triggers to send the right survey at the right time. This keeps your feedback clear and useful. You focus on improving customer experience without overwhelming your customers.
You see clear differences between NPS, CSAT, and CES. NPS tracks long-term loyalty, CSAT measures satisfaction after interactions, and CES shows how easy your service feels. The table below highlights their best use cases:
Metric | Type of Study | Focus | Best Use Case |
|---|---|---|---|
NPS | Relationship | Long-term loyalty | Evaluating overall customer sentiment over time |
CSAT | Relationship/Transactional | Short-term satisfaction | Measuring satisfaction with specific interactions or products |
CES | Transactional | Effort required | Improving customer service interactions and reducing friction |
To select the right metric, follow these steps:
Understand what drives customer satisfaction levels in your industry.
Align metrics with your business goals.
Educate your team about the value of customer experience metrics.
Sobot’s solutions help you measure, analyze, and improve satisfaction across all channels. Keep reviewing your metrics as your business grows to stay ahead.
FAQ
What is the best customer satisfaction metric for my business?
You should choose a customer satisfaction metric based on your goals. NPS works well for loyalty. CSAT fits quick feedback. CES helps you find pain points. Use more than one metric for a complete view.
How often should I measure customer satisfaction?
You should measure customer satisfaction after key events, like purchases or support calls. For NPS, check every quarter or twice a year. Regular tracking helps you spot trends and act fast.
Can I use more than one customer satisfaction metric at the same time?
Yes, you can use multiple customer satisfaction metrics together. This gives you a fuller picture of your customer experience. Sobot’s platform lets you track NPS, CSAT, and CES in one place.
Why does my customer satisfaction metric score change over time?
Your customer satisfaction metric score changes because customer needs, service quality, or products change. Tracking scores helps you see what works and where you need to improve.
How does Sobot help me improve my customer satisfaction metric?
Sobot collects feedback across all channels. You get real-time reports and insights. You can act on data to improve your customer satisfaction metric and boost loyalty.
See Also
Comparative Analysis of Leading Voice of Customer Tools
2024's Best 10 Customer Service Software Solutions
Effective Strategies for Quality Management in Call Centers