Your 2025 Guide to Customer Service KPIs

You might feel your customer service is great, but how do you prove it? You need hard data. How can you show your team's value and make smart, data-driven decisions? The answer is customer service KPIs. These KPIs are your essential toolkit. They turn customer interactions into measurable success.
Did you know 90% of American consumers see customer service as a key factor when choosing a business?
Using the right KPIs helps you understand your impact. For instance, you can find key performance indicators examples for customer service that align with your goals. A modern platform like the Sobot call center uses Sobot AI to track these customer service KPIs effectively. Sobot helps you master these KPIs for future success.
Understanding Customer Service KPIs
What Are Key Performance Indicators?
Key Performance Indicators, or KPIs, are focused measurements. They show you how well your team is meeting its main business goals. The idea of using data to measure work is not new. It began over a century ago with scientific management and evolved with concepts like the Balanced Scorecard. Today, effective KPIs connect your daily actions to your company's biggest strategic objectives. They are the vital signs of your customer service department. These indicators help you track progress toward your most important goals.
Why Tracking KPIs is Crucial
Tracking KPIs is essential for success. It moves you from guessing to knowing. You can make smart, data-driven decisions that improve your service and grow your business. When you monitor the right customer service kpis, you can spot problems early and find opportunities for improvement.
For example, one telecommunications company focused on its KPIs. It saw a 149% increase in Net Promoter Score (NPS) and a 93% jump in First Contact Resolution (FCR). These improvements show how tracking KPIs directly boosts customer loyalty and efficiency.
Consistent tracking allows you to prove your team's value and make a clear case for new resources. It is the foundation for making better data-driven decisions.
The Difference Between KPIs and Metrics
People often use the terms "KPIs" and "metrics" interchangeably. However, they are different. A metric is any single measurement of business activity. KPIs are a special type of metric. They are the most important ones tied directly to your strategic goals. Think of it this way: every KPI is a metric, but not every metric is a KPI. The table below clarifies the difference.
| Aspect | Metrics | KPIs |
|---|---|---|
| Purpose | Track operational processes | Measure performance against goals |
| Focus | Broad, day-to-day data | Narrow, strategic outcomes |
| Impact | Inform daily activities | Drive major business decisions |
Choosing the right customer service kpis from all your available metrics helps you focus on what truly matters for success.
A Guide to Setting Up KPIs
Setting up KPIs is a clear, four-step process. This guide will walk you through each stage. Following these steps helps you turn data into decisions. Proper setting up kpis ensures your team focuses on what truly matters.
Step 1: Define Your Objectives
Your journey of setting up kpis begins with clear business goals. You must first know what you want to achieve. Your objectives will depend on your business model. For example, an e-commerce company has different goals than a SaaS company.
E-commerce vs. SaaS Objectives The table below shows how customer service goals can differ. E-commerce focuses on transactions, while SaaS focuses on long-term user engagement.
| Aspect | E-commerce Objectives | SaaS Objectives |
|---|---|---|
| Primary Goal | Drive immediate sales and conversions. | Drive subscriptions and user retention. |
| Customer Support | Handle order tracking and returns. | Provide technical support and onboarding. |
| Feedback Loop | Use product reviews and surveys. | Use NPS scores and in-app feedback. |
Step 2: Choose Relevant KPIs
After you define your objectives, you must choose the right kpis. The kpis you track should directly measure your progress toward your goals. If your goal is to improve customer loyalty, NPS is a great KPI. If you want to increase efficiency, you might track Average Handle Time. The key to setting up kpis is to select indicators that give you actionable insights.
Step 3: Set Benchmarks and Targets
Setting up kpis requires a target. You need benchmarks to know what "good" looks like. For First Contact Resolution (FCR), a good rate is between 70% and 79%. A world-class FCR rate is 80% or higher. Setting realistic targets gives your team a clear goal to work toward. This step in setting up kpis helps motivate your team and measure success accurately.
Step 4: Implement Data Collection
The final step in setting up kpis is to gather the data. You need the right tools to monitor your performance. Many platforms can help you track your chosen kpis. For example, tools like HubSpot, Geckoboard, and SimpleKPI allow you to build dashboards and automate reporting. A reliable system for data collection makes it easy to see your progress and make informed decisions.
Core KPIs for Service Quality and Satisfaction
Once you have a framework for setting up KPIs, you can focus on the indicators that measure service quality. These core kpis help you understand how customers feel about your brand. They directly measure customer satisfaction and loyalty. Let's explore the three most important satisfaction-focused kpis.
Customer Satisfaction Score (CSAT)
The Customer Satisfaction Score (CSAT) measures how happy a customer is with a specific interaction. You typically ask a question like, "How would you rate your overall satisfaction with the service you received?" Customers respond on a scale, such as 1 to 5. This KPI gives you immediate feedback on individual service experiences.
High customer satisfaction is directly linked to higher customer lifetime value. Satisfied customers tend to stay loyal and spend more over time. Each positive service interaction strengthens this relationship. Research shows that happy customers are more likely to buy premium products or add services. This makes tracking customer satisfaction essential for revenue growth.
You can compare your CSAT score to industry benchmarks to see how you stack up.
| Industry | Average CSAT Score |
|---|---|
| E-commerce | 80 |
| Banks | 78 |
| Software and SaaS | 78 |
Note: Excellent service turns satisfied customers into brand advocates. These advocates make repeat purchases and promote your brand through referrals and positive reviews. This advocacy directly increases customer lifetime value.
Net Promoter Score (NPS)
The Net Promoter Score (NPS) measures long-term customer loyalty. It asks one simple question: "On a scale of 0-10, how likely are you to recommend our company to a friend or colleague?" Based on their answers, you group customers into three categories:
- Promoters (9-10): Your most loyal and enthusiastic customers.
- Passives (7-8): Satisfied but not loyal enough to promote your brand.
- Detractors (0-6): Unhappy customers who can damage your brand through negative word-of-mouth.
You calculate your Net Promoter Score by subtracting the percentage of Detractors from the percentage of Promoters. This score shows a strong connection to a company's revenue growth. For example, studies show a 7% increase in NPS can lead to a 1% increase in revenue. Industry leaders often outgrow their competitors by more than double, and NPS can explain a large part of that success.
Industry benchmarks for NPS vary. The hospitality industry often sees high scores, while telecommunications has a wider range.
| Company | 2025 NPS Score |
|---|---|
| Hyatt Hotels | 58 |
| Wyndham Worldwide | 48 |
| Best Western Hotels | 42 |
Customer Effort Score (CES)
The Customer Effort Score (CES) measures how easy it is for a customer to get their issue resolved. You ask a question like, "How much effort did you personally have to put forth to handle your request?" on a scale from "Very Low Effort" to "Very High Effort." The goal is to make interactions as seamless as possible.
Research shows that reducing customer effort is a powerful way to build loyalty.
A landmark study found that 96% of customers with a high-effort service interaction become more disloyal. In contrast, only 9% of those with a low-effort experience become more disloyal.
Customers who have an easy experience are 94% more likely to make a future purchase. A low-effort experience is a strong predictor of retention. Below are some industry benchmarks for CES 2.0, where a lower score is better.
| Industry | Industry Average CES 2.0 | Top Performers CES 2.0 |
|---|---|---|
| Technology & SaaS | 5.0 | 6.0 |
| Travel & Hospitality | 4.6 | 5.7 |
| Retail & E-commerce | 3.9 | 4.7 |
| Financial Services | 4.0 | 4.8 |
Key Performance Indicators Examples for Customer Service
The right kpis depend on your industry and business goals. Looking at key performance indicators examples for customer service can help you choose what to track. Different sectors prioritize different outcomes.
For a B2B software support team, here are some key performance indicators examples for customer service:
- First Contact Resolution (FCR): Resolving issues in a single interaction shows agent expertise and efficiency.
- SLA Compliance Rate: Meeting service-level agreements is critical for maintaining trust with enterprise clients.
- Customer Retention Rate: This shows the direct impact of your support experience on keeping customers subscribed.
- Ticket Volume: Tracking the number of requests helps you manage staffing and identify product trends.
For a healthcare provider's patient support center, these key performance indicators examples for customer service are vital:
- First Response Time (FRT): Minimizing wait times is crucial for patients who may be anxious or in distress.
- Patient Effort Score (PES): Making it easy for patients to resolve issues reduces friction and improves their overall experience.
- Patient Sentiment Score: Using AI to analyze the emotional tone of conversations provides deep insights into the patient experience.
Choosing from these key performance indicators examples for customer service helps you focus on what matters most to your specific customers.
Essential KPIs for Efficiency and Performance

While satisfaction kpis tell you how customers feel, efficiency KPIs show you how well your team operates. These indicators help you optimize workflows, manage resources, and reduce costs. You can use powerful call center analytics to track these metrics. Let's dive into the essential kpis for measuring your team's performance.
First Response Time (FRT)
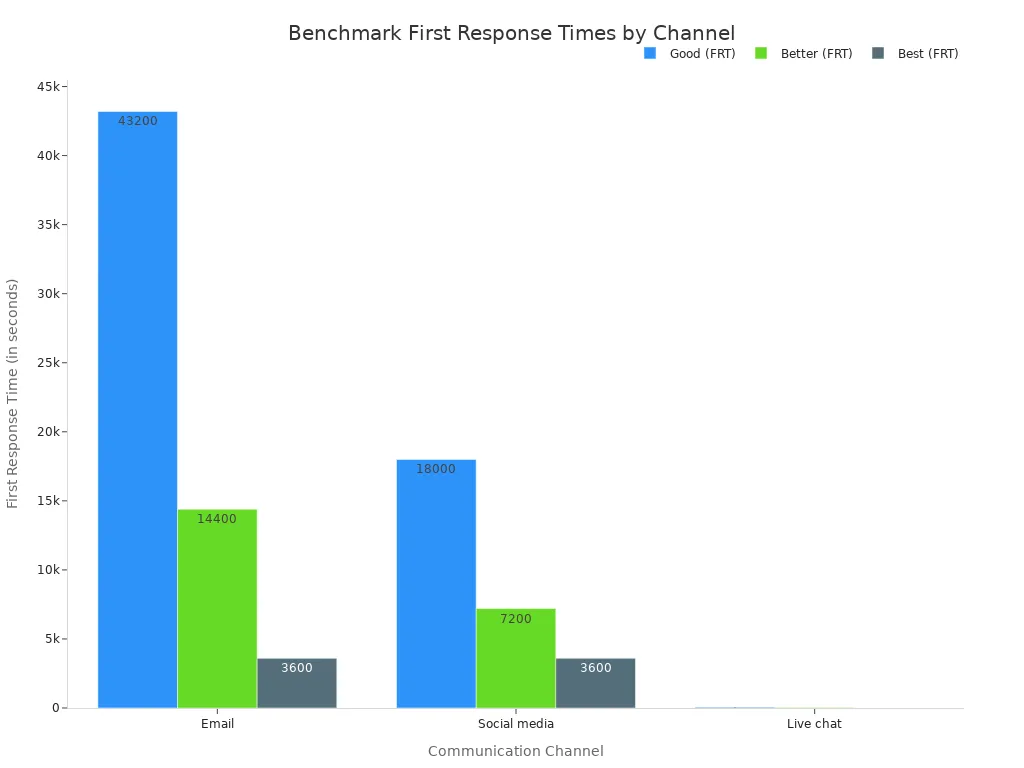
First Response Time (FRT) measures how long a customer waits for an initial reply from your team. This KPI is critical because it sets the tone for the entire customer interaction. A fast response shows you value your customer's time. This simple act can significantly improve customer satisfaction. Customers who reach a human quickly are often more patient while you solve their problem.
Your FRT goals should change based on the communication channel. Customers have different expectations for email, social media, and live chat. Strong call center analytics will help you track performance across all these channels. Here are some benchmarks to aim for:
| Channel | Good (FRT) | Better (FRT) | Best (FRT) |
|---|---|---|---|
| 12 hours or less | 4 hours or less | 1 hour or less | |
| Social media | 5 hours or less | 2 hours or less | 1 hour or less |
| Live chat | 1 minute or less | 40 seconds or less | Instantly |
Average Handle Time (AHT)
Average Handle Time (AHT) is the average duration of a single customer interaction. It includes talk time, hold time, and any after-call work your agent completes. A lower average handle time often means your team is more efficient. However, you should never sacrifice service quality just to reduce this number. The goal is to be both quick and effective. Your call center analytics can help you find the right balance.
AHT benchmarks vary by industry. Complex inquiries in financial services naturally take longer than simple retail questions. Here is a look at typical AHT ranges.
| Industry | Average AHT (Minutes) |
|---|---|
| Financial Services | 4.7 - 6.0 |
| Retail & E-commerce | 3.0 - 5.4 |
You can lower your average handle time without rushing customers. Here are a few strategies:
- Optimize Agent Training: Provide ongoing coaching using real call recordings. This builds agent confidence and knowledge.
- Streamline Workflows: Use call center analytics to identify and remove inefficient steps. Automate repetitive tasks to free up agent time.
- Implement a Knowledge Base: Give agents a powerful tool to find answers quickly. This reduces search time and empowers them to solve issues faster.
- Use Smart Call Routing: Ensure customers connect with the right agent on the first try. This reduces transfers and frustration.
First Contact Resolution (FCR)
First Contact Resolution (FCR) measures the percentage of customer issues solved in a single interaction. This is a powerful KPI because it directly impacts both customer satisfaction and operational costs. When you achieve first-call resolution, customers are happier and your agents can move on to help others. A high first contact resolution rate is a sign of a highly effective team.
The industry average for FCR is around 70%. A rate between 70% and 79% is considered good. If you can push your first contact resolution rate to 80% or higher, you are in the world-class category. You can calculate it with a simple formula:
FCR = (Total tickets resolved in one touch ÷ Total tickets received) x 100
Improving your first-call resolution has huge benefits. For every 1% improvement in FCR, you can see a 1% decrease in operational costs. Better call center analytics can help you pinpoint why contacts are not resolved on the first try.
| Impact Area | The Benefit of High FCR |
|---|---|
| Operational Costs | A 1% FCR improvement can lower operating costs by 1%. |
| Customer Retention | A 1% FCR improvement can increase customer retention by 1-5%. |
| Employee Satisfaction | For every 1% FCR improvement, agent satisfaction improves by 1-5%. |
Agent Productivity Rate
The Agent Productivity Rate is not a single metric. It is a collection of kpis that together show how efficiently your agents work. Tracking this helps you understand your team's capacity, identify top performers, and find coaching opportunities. Good call center analytics make it easy to monitor these different factors.
Several factors influence an agent's productivity. These include:
- Inadequate Training: Agents cannot be productive if they lack the right knowledge or skills.
- Outdated Technology: Slow or clunky systems create friction and waste time.
- Distracting Work Environment: A noisy or uncomfortable workspace can hurt focus.
- Lack of Recognition: Agents who feel unappreciated may become disengaged.
To measure productivity, you should look at a combination of metrics. Your call center analytics dashboard should give you a clear view of these numbers.
| Metric | What It Measures | Why It Matters for Productivity |
|---|---|---|
| Occupancy Rate | The percentage of time agents spend on call-related tasks versus being idle. | A high rate (around 80-90%) shows you are using your team's time effectively. |
| After-Call Work (ACW) | The time an agent spends on follow-up tasks after an interaction ends. | High ACW can point to inefficient processes or tools that slow agents down. |
| Transfer Rate | The percentage of calls an agent transfers to someone else. | A low transfer rate shows agents are knowledgeable and empowered to solve issues. |
| Schedule Adherence | How well an agent sticks to their planned work schedule. | This ensures you have enough coverage during peak hours, making the whole team more productive. |
By tracking these efficiency and performance metrics, you gain a clear, data-driven view of your operations. This allows you to make smart decisions that improve service quality and control costs.
Leveraging Technology with Sobot
Tracking all these kpis manually is nearly impossible. You need modern tools to turn data into actionable insights. The right technology is essential for tracking your performance effectively and making smart decisions.
Using a Unified Omnichannel Platform
Your customers contact you through many channels. A unified platform brings every interaction together. Sobot's Omnichannel Solution provides a single workspace for your agents. It combines Live Chat, email from the Ticketing System, and messages from the WhatsApp Business API. This unified view helps you track KPIs like Average Handle Time (AHT) and First Contact Resolution (FCR) consistently. Your call center analytics become much clearer when all data lives in one place. You get a complete picture of the customer journey from your call center analytics.
The Power of AI and Automation
AI and automation can handle many routine tasks. This frees up your agents to focus on complex problems. Sobot’s AI-powered Chatbot and Voicebot can resolve a significant number of inquiries without human help. In fact, advanced AI can resolve 55-70% of issues automatically.
Real-World Success with OPPO Leading device maker OPPO used Sobot to improve its service. By implementing Sobot's chatbot, they achieved an incredible 83% chatbot resolution rate and a 94% positive feedback rate. This shows how AI directly improves your most important kpis.
Choosing the Right KPI Dashboard
You need a dashboard that gives you real-time information. The best dashboards pull data from your call center analytics to show you what is happening right now. Sobot’s Voice/Call Center includes powerful Monitoring and Analysis features. These features feed directly into your call center analytics. Your call center analytics dashboard should display essential metrics instantly.
Essential features to look for include:
- First Contact Resolution (FCR)
- Customer Satisfaction Score (CSAT)
- Wait Time and Resolution Time
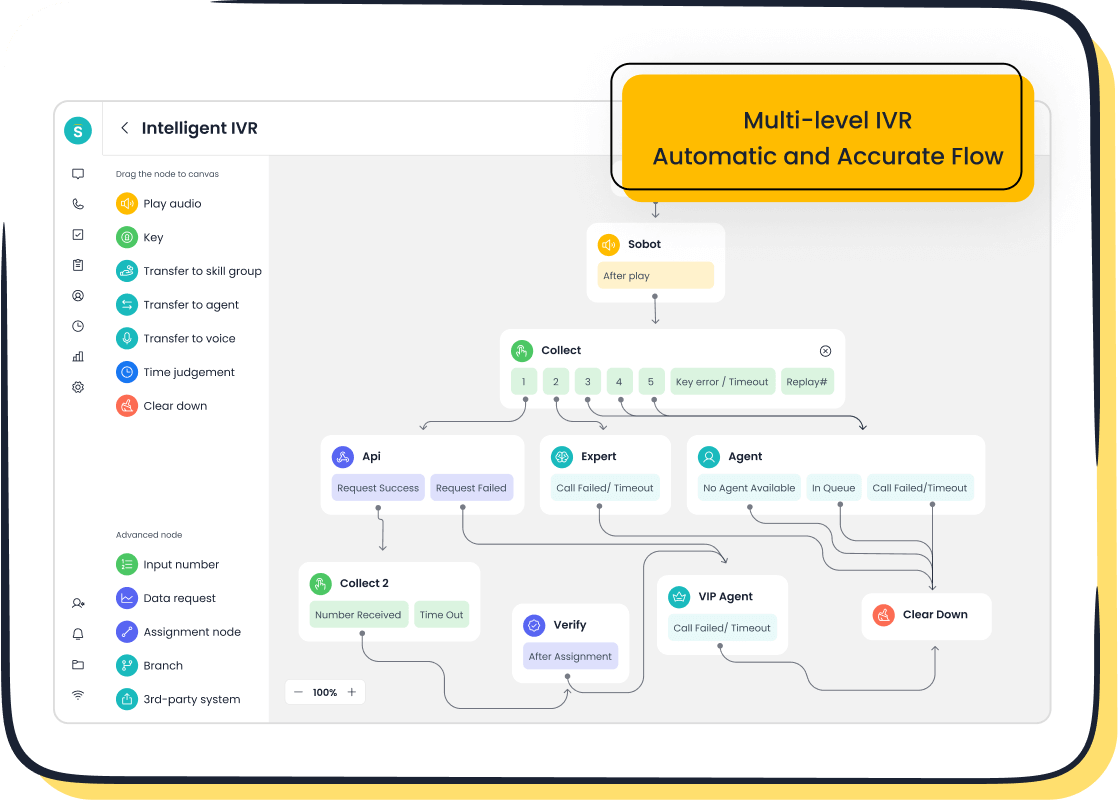
Features like Intelligent IVR also improve performance by routing calls correctly, which your call center analytics will reflect. Strong call center analytics help you see trends. Better call center analytics help you predict them. The best call center analytics empower you to act. Your call center analytics are the brain of your operation.
Setting up customer service kpis is the first step in a cycle. You must measure, analyze, and improve continuously. Do not feel overwhelmed. You can start small. Pick two or three relevant customer service kpis from this guide and begin tracking them now. Mastering these key metrics is essential. This knowledge will prepare your team for the challenges of 2025. Your command of customer service kpis ensures you turn data into success. Strong customer service kpis will guide your future growth.
FAQ
What is the most important customer service KPI?
The best customer service kpis depend on your goals. You should choose the ones that match your main objectives. For loyalty, you might track NPS. For efficiency, you could focus on Average Handle Time (AHT). Your business strategy determines the most important KPI for you.
How often should I review my KPIs?
You should review your customer service kpis regularly. Many teams check their key metrics weekly or monthly. This helps you spot trends early. Consistent reviews allow you to make timely adjustments and keep your team on track toward its goals.
Can I track KPIs without special software?
You can start tracking basic customer service kpis manually. However, this becomes difficult as your team grows. A platform like Sobot automates data collection. It gives you accurate, real-time insights and saves you a lot of time.
How many KPIs should I track at once?
You should start with just a few key indicators.
Focus on 2-3 of the most important customer service kpis first. This prevents you from feeling overwhelmed. You can always add more later as your team gets more comfortable with using data to measure success.
See Also
Discovering the Premier Customer Service Software Solutions for 2024
Exploring the Leading Cloud-Based Contact Center Platforms for 2025
Essential Guide to Quality Management Systems for Call Centers
Implementing Superior Quality Management Practices in Call Centers
Comprehensive Reviews of Leading Cloud Contact Center Services in 2024
