15 Must-Track Metrics for Customer Service Teams
In 2024, tracking key performance indicators for customer service has become essential. Metrics like Customer Satisfaction Score (CSAT) and Average Handle Time (AHT) are no longer optional—they’re critical for improving service quality and creating a customer-first approach. By focusing on these numbers, you can boost satisfaction, streamline operations, and empower your team to perform better. Tools like Sobot’s Chatbot make this process even easier by automating repetitive tasks and providing real-time insights. Why guess when you can measure success?
Customer Satisfaction Metrics

Understanding customer satisfaction is the cornerstone of excellent service. By tracking the right customer service metrics, you can identify what’s working and where improvements are needed. Let’s dive into four key metrics that help you measure and enhance customer satisfaction.
Customer Satisfaction Score (CSAT)
CSAT is one of the simplest ways to gauge how happy your customers are. You ask them a straightforward question: “How satisfied were you with your experience?” They respond using a scale, often from 1 to 5. Higher scores mean happier customers.
To make CSAT even more effective, you should analyze what drives these scores. For example:
- Use key driver surveys to pinpoint what influences satisfaction.
- Analyze customer experience data to uncover trends.
- Apply regression analysis to understand which factors matter most.
Tracking CSAT over time helps you see if your efforts are paying off. It’s a quick, reliable way to keep your finger on the pulse of customer satisfaction.
Net Promoter Score (NPS)
NPS measures how likely your customers are to recommend your business to others. It’s a powerful predictor of loyalty and growth. A study in the U.S. sportswear industry found that NPS effectively forecasted sales growth when responses from all potential customers were considered.
To calculate NPS, ask customers: “On a scale of 0 to 10, how likely are you to recommend us?” Scores of 9 or 10 indicate promoters, while scores of 6 or below signal detractors. The higher your NPS, the more loyal your customers are.
Customer Effort Score (CES)
CES tracks how easy it is for customers to get their issues resolved. The less effort they need to put in, the happier they’ll be. Unlike CSAT or NPS, CES doesn’t have industry benchmarks. Instead, compare your current scores to past ones.
Here’s how to evaluate your CES:
- Are your scores improving over time? If yes, you’re on the right track.
- Are negative scores decreasing? If not, it’s time to rethink your approach.
Lowering customer effort not only boosts satisfaction but also reduces operational costs. It’s a win-win.
First Contact Resolution (FCR)
FCR measures how often you resolve customer issues on the first try. A high first contact resolution rate means fewer follow-ups and happier customers. Did you know that world-class FCR rates exceed 80%, but only 5% of call centers achieve this? The industry average is around 70%, so aim for that as a starting point.
Here’s a quick look at how FCR impacts performance:
| Performance Indicator | Description |
|---|---|
| First Contact Resolution (FCR) Rate | Percentage of customer inquiries resolved on the first interaction. |
| Average Handle Time | Average duration of customer interactions, impacting efficiency. |
| Service Level | Percentage of calls answered within a specific time frame, indicating responsiveness. |
| Abandonment Percentage | Rate at which customers hang up before their call is answered, reflecting potential dissatisfaction. |
| Customer Effort Score (CES) | Measures the ease of customer interaction, correlating with satisfaction levels. |
Improving FCR not only enhances customer satisfaction but also boosts your team’s efficiency. It’s a metric you can’t afford to ignore.
Operational Efficiency Metrics
Operational efficiency is the backbone of any successful customer service team. By tracking the right metrics, you can streamline processes, reduce costs, and deliver faster resolutions. Let’s explore four key metrics that can transform your operations.
Average Handle Time (AHT)
Average Handle Time (AHT) measures how long it takes to resolve a customer inquiry from start to finish. It’s a critical indicator of your team’s productivity and overall efficiency. Lowering AHT can lead to happier customers and better resource management.
Here’s why AHT matters:
- It highlights areas where agents may need additional training.
- It helps you plan staffing and capacity more effectively.
- It directly impacts customer satisfaction, as quicker resolutions often mean happier customers.
By analyzing AHT trends, you can identify bottlenecks and make data-driven improvements. Tools like Sobot’s omnichannel solution can help reduce AHT by unifying communication channels and automating repetitive tasks.
First Response Time (FRT)
First Response Time (FRT) measures how quickly your team responds to a customer’s initial inquiry. Customers expect fast replies, and a low FRT can significantly boost satisfaction.

To improve FRT, focus on optimizing workflows and leveraging tools like Sobot’s AI Chatbot. The chatbot can handle simple queries instantly, allowing your agents to focus on more complex issues. This not only reduces FRT but also enhances the overall customer experience.
Ticket Volume
Ticket Volume tracks the number of customer inquiries your team handles over a specific period. Monitoring this metric helps you understand demand patterns and allocate resources effectively.
| Metric | Description |
|---|---|
| Ticket Volume Trend | Reveals patterns in customer service demands over time. |
| Resource Planning | Helps anticipate the resources needed for effective management. |
| Customer Satisfaction | Impacts satisfaction levels and operational efficiency. |
| Resolution Rate | Balancing ticket volume with a high resolution rate indicates an effective support system. |
| Benchmarking | Aligning ticket volume with historical data aids in resource optimization. |
Tracking ticket volume ensures your team stays prepared, even during peak times.
Cost Per Resolution
Cost Per Resolution measures how much it costs to resolve a single customer inquiry. It’s a vital metric for balancing quality service with operational expenses.
Here’s how tracking this metric benefits your team:
- It helps you identify cost-saving opportunities without compromising service quality.
- A high resolution rate often correlates with lower costs and higher customer satisfaction.
- Benchmarking against industry standards reveals areas for improvement.
For example, resolving 450 out of 500 tickets results in a 90% resolution rate. This indicates high efficiency and can reduce costs associated with customer churn. By focusing on effective resolution strategies, you can enhance both customer satisfaction and operational efficiency.
Retention and Success Metrics
Retention and success metrics are vital for understanding how well your customer service strategies are working. These metrics help you measure loyalty, reduce churn, and improve long-term profitability. Let’s explore four key metrics that can elevate your customer success KPIs.
Customer Retention Rate
Customer retention rate (CRR) shows the percentage of customers who stick with your business over time. It’s especially important for subscription-based industries like SaaS or telecom. A good monthly retention rate for SaaS companies is around 95%. If your retention rate is low, it might signal issues with customer satisfaction or product usability.
To boost CRR, focus on improving customer lifetime value by offering personalized experiences. Tools like Sobot’s omnichannel solution can help unify communication channels, making it easier to provide consistent service. Remember, retaining customers is more cost-effective than acquiring new ones.
Churn Rate
Churn rate measures the percentage of customers who stop doing business with you. Lowering churn is critical because even a 5% increase in retention can boost profits by 25% to 95%. Companies with strong omnichannel strategies, like those using Sobot’s solutions, enjoy retention rates as high as 89%.
One way to reduce churn is by resolving issues during the first interaction. Did you know 67% of churn could be avoided if problems were solved right away? Sobot’s AI Chatbot excels at this by handling repetitive queries instantly, leaving your agents free to tackle complex issues.
Repeat Customer Rate
Repeat customers are the backbone of long-term success. They spend more and order more frequently. For example, repeat customers generate 300% more revenue than first-time buyers and account for 44% of total revenue.
| Metric | Value |
|---|---|
| Revenue from repeat customers vs. first-time customers | 300% more |
| Percentage of repeat customers | 21% |
| Percentage of revenue from repeat customers | 44% |
| Percentage of orders from repeat customers | 46% |
To increase your repeat customer rate, focus on building trust and offering seamless experiences. Sobot’s chatbot can proactively engage customers, boosting satisfaction and encouraging repeat purchases.
Customer Success Metrics with Sobot's Chatbot

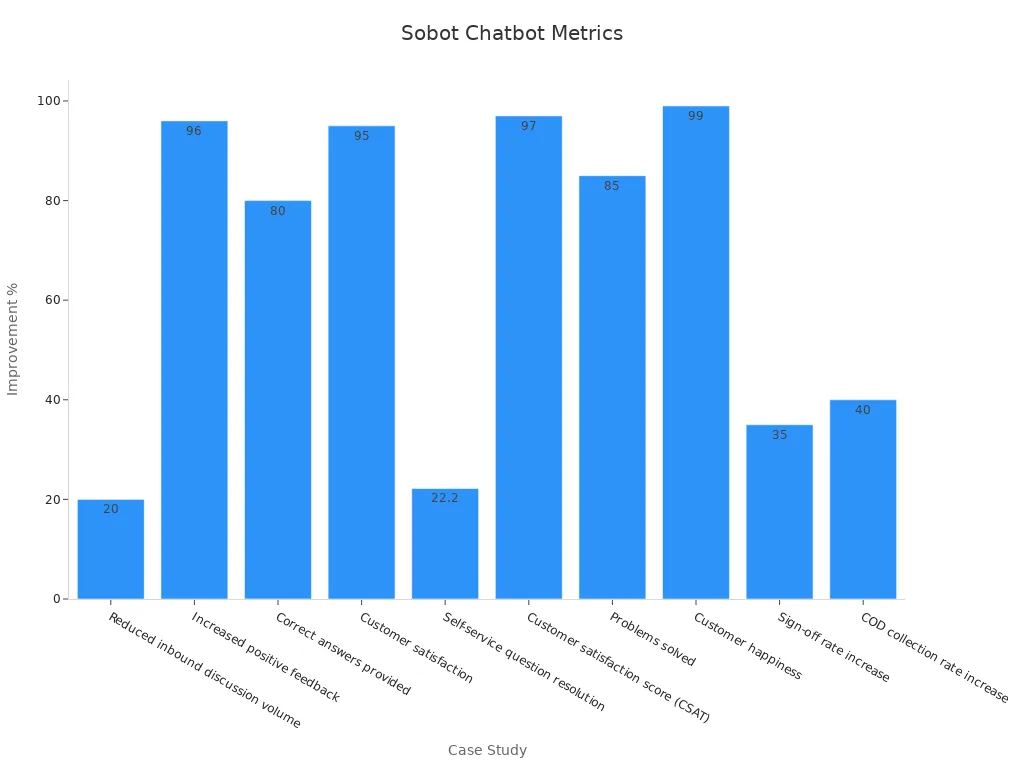
Sobot’s AI Chatbot is a game-changer for customer success KPIs. It reduces inbound discussion volume by 20% and improves customer satisfaction to over 95%. The chatbot also resolves 22.2% of queries through self-service, saving time and resources.
By integrating Sobot’s chatbot, you can enhance customer lifetime value and renewal rates. It’s a smart way to improve efficiency while keeping your customers happy.
Agent Performance Metrics
Tracking agent performance metrics helps you understand how well your team is functioning and where improvements can be made. Let’s explore three key metrics that can boost your team’s productivity and morale.
Agent Utilization Rate
Agent utilization rate shows how much of an agent’s available time is spent actively helping customers. It’s calculated by dividing the hours worked by the total hours available. For example, if an agent spends 6 hours on calls during an 8-hour shift, their utilization rate is 75%.
Maintaining a balanced utilization rate is crucial. Overworked agents can feel burned out, while underutilized ones may feel disengaged. Here’s why this metric matters:
- 🕒 It ensures agents aren’t overwhelmed by ticket volume.
- 😊 It fosters a positive work environment, reducing turnover.
- 📈 It helps you optimize staffing to meet customer demand.
By monitoring this metric, you can create a healthier workload for your team and improve overall efficiency.
Agent Satisfaction Score (ASAT)
Happy agents lead to happy customers. Agent Satisfaction Score (ASAT) measures how satisfied your team feels about their work environment, tools, and processes. You can collect this data through surveys asking questions like, “How satisfied are you with your current role?”
Improving ASAT involves providing better training, tools, and support. For instance, Sobot’s omnichannel solution simplifies workflows, making tasks less stressful for agents. When your team feels supported, they’re more likely to deliver exceptional service.
Average Resolution Time (ART)
Average Resolution Time (ART) tracks how quickly your team resolves customer issues. It’s a direct indicator of efficiency. In industries like SaaS, the average resolution time is 12-24 hours, while telecommunications may take 48-72 hours.
| Industry | Average Resolution Time |
|---|---|
| E-commerce | 24 hours |
| SaaS | 12-24 hours |
| Telecommunications | 48-72 hours |
A shorter ART means your team is functioning well, while longer times might signal staffing or training gaps. Tools like Sobot’s AI Chatbot can reduce ART by handling repetitive queries instantly, freeing agents to focus on complex problems. Faster resolutions keep customers happy and your team productive.
Quality Assurance Metrics
Tracking quality assurance metrics ensures your customer service meets high standards. These metrics help you identify gaps, improve processes, and deliver exceptional experiences. Let’s explore three key metrics that can elevate your service quality.
Quality of Service (QoS) Score
The Quality of Service (QoS) Score measures how well your team meets customer expectations. It evaluates factors like response accuracy, tone, and resolution effectiveness. A high QoS score reflects consistent, reliable service.
To improve this score, focus on training your agents and providing them with the right tools. For example, Sobot’s omnichannel solution equips your team with a unified workspace, making it easier to deliver accurate and timely responses. When agents have everything they need in one place, they can focus on creating positive customer experiences.
Customer Feedback Analysis
Customer feedback is a goldmine for improvement. By analyzing feedback, you can uncover pain points and make meaningful changes.
Here’s how feedback analysis works:
- A SaaS company noticed users struggled with a confusing interface during onboarding.
- They gathered feedback through in-app surveys and support tickets.
- The product team redesigned the interface, simplifying navigation.
- After the update, onboarding completion rates jumped by 30%.
You can achieve similar results by actively listening to your customers. Tools like Sobot’s chatbot can collect feedback in real time, helping you act quickly and improve your service level.
SLA Compliance and Monitoring with Sobot
Service Level Agreements (SLAs) define the standards your team must meet, like response times or resolution rates. Monitoring SLA compliance ensures you consistently deliver on your promises.
Sobot’s omnichannel solution simplifies SLA tracking. It automates workflows, prioritizes urgent tickets, and provides real-time analytics. This ensures your team stays on track and meets critical service level goals. For instance, Samsung used Sobot’s platform to improve SLA compliance, achieving a 97% customer satisfaction rate.
By focusing on SLA compliance, you can build trust and maintain high service standards.
Tracking these 15 customer service metrics isn’t just a good idea—it’s essential for staying competitive in 2024. Poor customer service has already cost industries $1.6 trillion, with 52% of consumers switching providers last year. Don’t let your business fall behind.
Tools like Sobot’s Chatbot and omnichannel solutions make it easier to collect and analyze feedback, helping you improve customer satisfaction and operational efficiency. By integrating these metrics into your 2024 strategy, you’ll create better experiences, retain more customers, and boost your bottom line. Why wait? Start tracking today!
FAQ
What are customer experience metrics, and why are they important?
Customer experience metrics measure how well your service meets customer expectations. They help you identify areas for improvement and ensure your customers stay satisfied and loyal.
How can Sobot's Chatbot improve my team's efficiency?
Sobot's Chatbot automates repetitive tasks, resolves common queries instantly, and reduces inbound discussion volume by 20%. This frees your team to handle complex issues more effectively.
What’s the best way to track customer satisfaction?
Use tools like CSAT surveys and NPS to gather feedback. Sobot’s omnichannel solution simplifies this process by unifying communication channels and providing real-time analytics.
See Also
Enhancing Call Center Efficiency Through Effective Monitoring Strategies
The 10 Most Effective Customer Service Tools for 2024
2024's Leading Call Center Analytics Software Solutions
Essential Practices for Effective Call Center Quality Management
