Essential KPIs for Measuring Customer Service Objectives
Measuring customer service objectives helps you understand how well your business meets customer needs. Key customer service KPIs include Customer Satisfaction Score (CSAT), Net Promoter Score (NPS), First Contact Resolution (FCR), Average Handle Time (AHT), Resolution Rate, Churn Rate, Retention Rate, Customer Lifetime Value (CLV), and First Response Time (FRT). Many industries rely on these customer satisfaction KPIs to boost customer satisfaction and service efficiency. With Sobot AI and the Sobot call center, you can start tracking KPIs and improve customer satisfaction across all service channels.
Customer Service Objectives

Defining Objectives
You need clear customer service objectives to guide your team and improve the customer experience. These objectives help you focus on what matters most for your business and your customers. Most businesses set customer service objectives to achieve important results, such as:
1. Increase sales and customer loyalty by offering friendly and helpful service. 2. Build a team of brand ambassadors who promote your company in every interaction. 3. Meet customer expectations at every touchpoint to build loyalty. 4. Deliver fast solutions to customer problems and reduce wait times. 5. Remove causes of dissatisfaction by solving common issues quickly. 6. Raise customer lifetime value by encouraging repeat purchases. 7. Improve retention by turning negative experiences into positive ones. 8. Boost team productivity with better tools and training. 9. Gain higher ratings and reviews by providing excellent service. 10. Collect feedback to make your service better. 11. Spot ways to improve products and services by analyzing customer service data.
When you define your customer service objectives, you set a clear path for your team. You also make it easier to measure progress with customer service metrics like CSAT or NPS. Companies like OPPO have seen real results by focusing on these objectives and using Sobot’s solutions to support their goals.
Aligning KPIs with Goals
You must align your customer service metrics with your business goals to get the best results. Start by setting concrete goals that match your company’s vision. Work with leaders from every department to make sure everyone agrees on what matters. Choose customer service metrics that reflect your brand values and support your customer service objectives.
- Use both direct metrics, such as first contact resolution and customer satisfaction, and indirect metrics, like feedback or sales leads from support.
- Break down barriers between sales, marketing, and customer service teams so everyone works toward the same goals.
- Create a style guide to keep your brand’s voice and tone consistent in every customer interaction.
- Track customer feedback often and adjust your objectives as your business grows.
To keep your customer service metrics aligned, select KPIs that are relevant and actionable. Embed these KPIs into daily routines with clear communication and real-time dashboards. Educate your team about why these metrics matter and link incentives to performance. Review your KPIs regularly and adjust them as your goals change. Sobot’s unified workspace and analytics tools make it easy to track and adjust your customer service objectives in real time, helping you deliver a better customer experience.
Key Customer Service KPIs
Overview of Customer Service Metrics
You need to understand the difference between customer service metrics and customer service KPIs. Customer service metrics include all the data points you can track about your customer service. These might include the number of calls handled, average wait time, or the number of tickets closed each day. Customer service KPIs, or key performance indicators, are a smaller group of these metrics. You choose KPIs because they connect directly to your business goals and help you improve performance.
Think of customer service metrics as a big book of strategies. Customer service KPIs are the specific moves you pick to win the game. All KPIs are metrics, but not every metric is a KPI. KPIs help you focus on what matters most for your customer and your business.
For example, you might track many customer service metrics, but only use CSAT, NPS, and First Contact Resolution as your main customer service KPIs. These KPIs show how well your team meets customer needs and supports your service goals.
Selecting the Right KPIs
You should select customer service KPIs that match your customer service objectives. Start by thinking about what you want to achieve. Do you want to improve customer satisfaction, reduce churn, or boost efficiency? Your business stage matters too. Early-stage companies often focus on customer acquisition and satisfaction. Established businesses may care more about retention and loyalty.
When you pick customer service KPIs, make sure they are:
- Relevant to your goals
- Easy to measure and understand
- Based on clean and accurate data
- Limited in number so you can focus on what matters
Sobot’s platform helps you track customer service metrics and KPIs in real time. You get clear dashboards and analytics, so your team always knows where to focus. This makes it easier to spot trends and improve your customer service.
Customer Satisfaction KPIs
Customer satisfaction KPIs help you measure how well your service meets customer needs. These customer satisfaction metrics show you what customers think about your business and how they feel after each interaction. When you track these KPIs, you can improve the customer experience, increase loyalty, and boost your business results. Let’s look at the three most important customer satisfaction KPIs: CSAT, NPS, and CES.
CSAT (Customer Satisfaction Score)
CSAT, or Customer Satisfaction Score, is one of the most direct customer satisfaction KPIs. You use CSAT to ask customers how satisfied they feel after a specific interaction. Most companies use a simple question like, “How satisfied were you with your experience?” Customers answer on a scale, often from 1 to 5. You calculate the score as a percentage of satisfied responses.
CSAT is easy to understand and quick to collect. You can send a survey right after a call, chat, or email. This makes CSAT a great way to measure customer satisfaction in real time. Many businesses use CSAT to spot problems early and fix them fast.
Here is a table showing the CSAT benchmark scores for different industries:
| Industry Sector | CSAT Benchmark Score | Year | Notes on Relevance to Customer Service Sector |
|---|---|---|---|
| Software and SaaS | 78 | 2022 | High customer expectations, relevant to customer service |
| E-commerce | 80 | 2023 | Among highest scores, includes pre- and post-sale service |
| Banks (Finance) | 78 | 2022 | Stable benchmark, financial services closely related to customer service |
| Insurance | 76+ | 2023 | Slightly lower but still relevant to service sector |
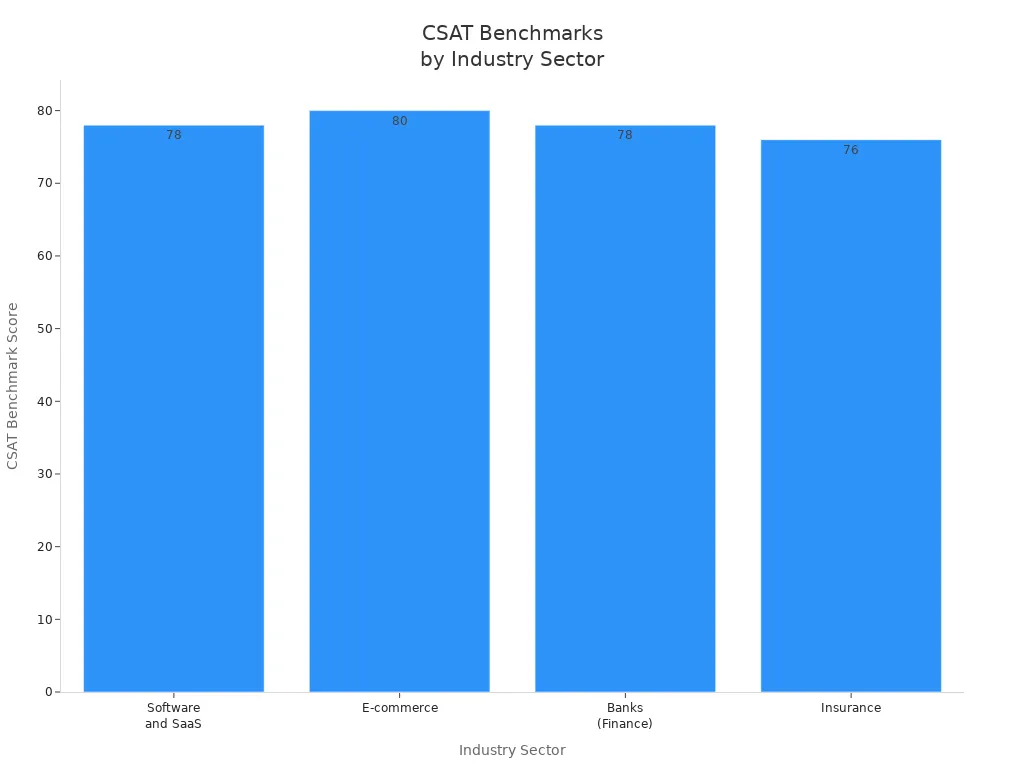
Most customer satisfaction metrics show that a CSAT score between 75 and 80 is competitive. If your score is above 78, you are doing well compared to others in your industry. You can improve your CSAT by reducing response times, solving problems on the first contact, and training your team to communicate clearly.
Tip: Use Sobot’s omnichannel analytics to collect CSAT feedback after every customer interaction. This helps you track customer satisfaction KPIs across all channels and spot trends quickly.
High CSAT scores lead to more loyal customers. Satisfied customers return for future purchases and share positive feedback with others. This boosts your customer lifetime value and helps your business grow. If your CSAT drops, you may see more complaints and higher churn rates. By focusing on customer satisfaction metrics like CSAT, you can keep your customers happy and loyal.
NPS (Net Promoter Score)
NPS, or Net Promoter Score, is another key customer satisfaction KPI. NPS measures how likely your customers are to recommend your business to others. You ask, “How likely are you to recommend us to a friend or colleague?” Customers answer on a scale from 0 to 10. You group the answers into Promoters (9-10), Passives (7-8), and Detractors (0-6). You calculate NPS by subtracting the percentage of Detractors from the percentage of Promoters.
NPS is a powerful customer satisfaction metric because it predicts future growth and customer advocacy. Companies with high NPS scores grow faster and earn more repeat business. NPS helps you find your most loyal customers and spot those at risk of leaving.
Here is a table of average NPS scores for leading customer-focused industries:
| Industry | Average NPS Score | Notes |
|---|---|---|
| Insurance (B2B) | 80 | Leading industry with the highest average NPS among B2B sectors. |
| Financial Services (B2B) | 75 | Second highest in B2B, indicating strong customer loyalty. |
| Consulting (B2B) | High 60s | Maintains a top 3 position in B2B with a solid NPS score. |
| Healthcare (B2C) | 53 | Surpassed the 50 threshold after steady growth, marking strong customer focus. |
| Property Management (B2C) | 52 | Newly included with a good score above 50. |
| Digital Marketing Agencies | Over 50 | Demonstrates that customer-centric approaches yield NPS scores above 50. |
| Ecommerce (B2C) | 59 | Improved after pandemic lows, showing recovery and customer-centric improvements. |
| Retail (B2C) | 59 | Similar to Ecommerce, showing steady growth in customer satisfaction. |
| Technology & Services | 66 | One of the highest in B2C, reflecting steady growth and strong customer engagement. |
NPS does more than measure satisfaction. It helps you understand customer loyalty and predict future business. When you analyze NPS, you can:
- Identify your most loyal customers (Promoters) and encourage them to share their positive experiences.
- Spot at-risk customers (Detractors) and follow up to solve their problems.
- Use customer feedback to improve your products and services.
- Track changes in customer satisfaction over time.
Companies that use NPS as a core customer satisfaction KPI often see higher retention and more referrals. For example, Sobot’s unified workspace lets you collect NPS feedback across all channels, making it easy to see which parts of your service drive loyalty. You can use this data to reward top-performing agents and fix weak spots in your customer experience.
CES (Customer Effort Score)
CES, or Customer Effort Score, is a customer satisfaction KPI that measures how easy it is for customers to get help or solve a problem. You ask, “How easy was it to resolve your issue today?” Customers answer on a scale, usually from “very easy” to “very difficult.” CES is one of the most important customer satisfaction metrics because it shows how much effort your customers must make to get what they need.
Reducing customer effort leads to higher satisfaction and loyalty. When you make things easy for your customers, they feel more confident and are more likely to stay with your brand. Here is a table showing how CES impacts customer satisfaction and retention:
| Metric / Finding | Impact on Customer Satisfaction and Retention |
|---|---|
| 63% of shoppers prefer brands that make issue resolution effortless | Customers favor brands minimizing effort, increasing retention likelihood |
| 94% of customers with low-effort experiences are likely to make future purchases | Low effort strongly correlates with repeat buying behavior |
| 88% higher spending by customers experiencing low effort | Reduced effort leads to increased customer spending |
| 20% reduction in customer churn for CES ratings above 7 | Higher CES scores correspond to lower churn rates |
| 31% increase in repeat purchases within three months for high CES | Improved CES drives more frequent repeat buying |
| Up to 30% improvement in customer satisfaction by lowering CES | Easier interactions significantly boost satisfaction levels |
| 42% less time spent resolving issues with low effort scores | Faster problem resolution enhances satisfaction and loyalty |
| Over 60% of customers stop doing business due to difficult issue resolution | High effort causes customer loss, negatively impacting retention |
| 78% of consumers continue business after mistakes if complaints are handled well | Effective support mitigates negative effects of errors |
| 12% increase in customer retention by reducing customer effort in eCommerce | Lower effort directly improves retention rates |
| Retention costs 5-25 times less than acquisition | Emphasizes financial benefit of retaining customers through effort reduction |
When you lower customer effort, you see more repeat business and fewer complaints. Customers who find it easy to get help spend more and stay longer. Sobot’s AI-powered chatbots and smart call routing help you reduce customer effort by giving fast answers and solving problems on the first try. You can use Sobot’s analytics to track CES and see where you can make things even easier for your customers.
Note: Reducing customer effort not only boosts satisfaction but also lowers your service costs. Happy customers need less support and are more likely to recommend your business.
Customer satisfaction KPIs like CSAT, NPS, and CES give you a complete view of your customer satisfaction metrics. When you track these KPIs, you can improve every part of the customer experience. You see what works, fix what doesn’t, and build stronger relationships with your customers. Sobot’s platform helps you collect, analyze, and act on customer feedback, making it easier to reach your customer satisfaction goals.
Operational Customer Service Metrics
Operational customer service metrics help you measure how well your team handles customer issues. These metrics show you where your service shines and where you can improve. Let’s look at four key metrics: First Contact Resolution (FCR), Average Handle Time (AHT), First Response Time (FRT), and Resolution Rate.
First Contact Resolution (FCR)
First Contact Resolution tells you how often your team solves a customer’s problem on the first try. You want to fix issues without making the customer contact you again. The industry standard for FCR rates sits between 70% and 79%. If your team reaches 80% or higher, you are among the best in the business. Only about 5% of call centers achieve this level. When you improve FCR, you see big benefits:
- Fewer repeat contacts lower your support costs.
- Customers get fast, hassle-free solutions.
- Customer satisfaction rises because people get what they need quickly.
Sobot’s unified workspace and smart call routing help your agents solve problems on the first contact. You can track FCR in real time and spot trends that affect customer happiness.
Average Handle Time (AHT)
Average Handle Time measures how long it takes your team to help a customer from start to finish. In the telecommunications industry, AHT usually ranges from 5 to 7 minutes. This includes talk time, hold time, and any follow-up work. Lowering AHT helps your team work faster and keeps customers happy. Here’s how reducing AHT helps:
- Agents handle more customer requests in less time.
- Customers spend less time waiting, which boosts satisfaction.
- Shorter calls mean lower support costs.
Long AHT often means agents need more training or better tools. Sobot’s call center platform gives your team everything in one place, so they can help customers quickly and efficiently.
First Response Time (FRT)
First response time shows how fast your team replies when a customer reaches out. Customers expect different speeds depending on the channel. For email, most expect a reply within 12 hours, but many want it in just one hour. On social media, a good first response time is under five hours, but the best teams reply in one hour or less. Live chat and phone support should respond in less than one minute.
| Channel | Typical Good FRT | Better FRT | Best FRT |
|---|---|---|---|
| Within 12 hours | Within 4 hours | Within 1 hour | |
| Social Media | Within 5 hours | Within 2 hours | Within 1 hour |
| Live Chat | Within 1 minute | Within 40 seconds | Instantly |
A fast first response time shows customers you value their time. Research shows that 90% of U.S. customers think immediate replies are important, and 60% expect support within 10 minutes. Quick responses build trust and prevent frustration. Sobot’s real-time monitoring and omnichannel analytics help you keep first response time low across all channels.
Resolution Rate
Resolution rate measures how many customer issues your team solves. In e-commerce, the average resolution rate is about 74% for inquiries and 78% for first call resolution. High resolution rates mean your team fixes most problems quickly. This builds customer trust and strengthens your brand’s reputation. Customers who get fast, effective help feel valued and are more likely to return. Sobot’s AI-powered tools and unified workspace help your team resolve more issues on the first try, making customers happier and more loyal.
Tip: Track these metrics regularly to spot trends and improve your customer service. Sobot’s analytics dashboard makes it easy to monitor FCR, AHT, first response time, and resolution rate in real time.
Customer Loyalty and Value Metrics
Churn Rate
Churn rate shows how many customers stop using your service over a certain period. You want to keep this number low because losing customers means losing revenue. Churn rates vary by industry. For example, SaaS companies see an average monthly churn rate of 4-6%, while e-commerce subscriptions can reach 10-15%. Telecom companies often have the lowest churn, around 1-2%.
| Industry | Average Monthly Churn Rate (%) |
|---|---|
| SaaS | 4-6% |
| E-commerce Subscriptions | 10-15% |
| Telecom | 1-2% |
| Media & Entertainment | 5-8% |
| Health & Fitness | 7-10% |
| Financial Services | 2-4% |
| Education & E-learning | 8-12% |
| Retail | 5-7% |
| Gaming | 5-9% |
Reducing churn rate helps your business grow. When you keep more customers, you spend less on finding new ones. Studies show that acquiring a new customer costs five times more than keeping an existing one. If you lower churn by just 5%, you can boost profits by up to 95%. Sobot’s omnichannel analytics help you spot trends and act fast to keep customers happy.
Retention Rate
Retention rate tells you how many customers stay with your business over time. High retention means strong customer loyalty and steady revenue. In SaaS, top companies reach customer retention rates above 85%. The best companies keep more than 90% of their customers each year.
| Metric / Segment | Benchmark Range / Value | Notes |
|---|---|---|
| Best-in-class Customer Retention | Approximately 85-87% | Across all stages of business |
| Customer Retention (Logo Retention) | 80.4% (top quartile for $3-8M ARR) | Improves with scale and product-market fit |
| Customer Retention by ARPA | 85.7% (top quartile for ARPA > $500) | Higher retention typical for B2B SaaS |
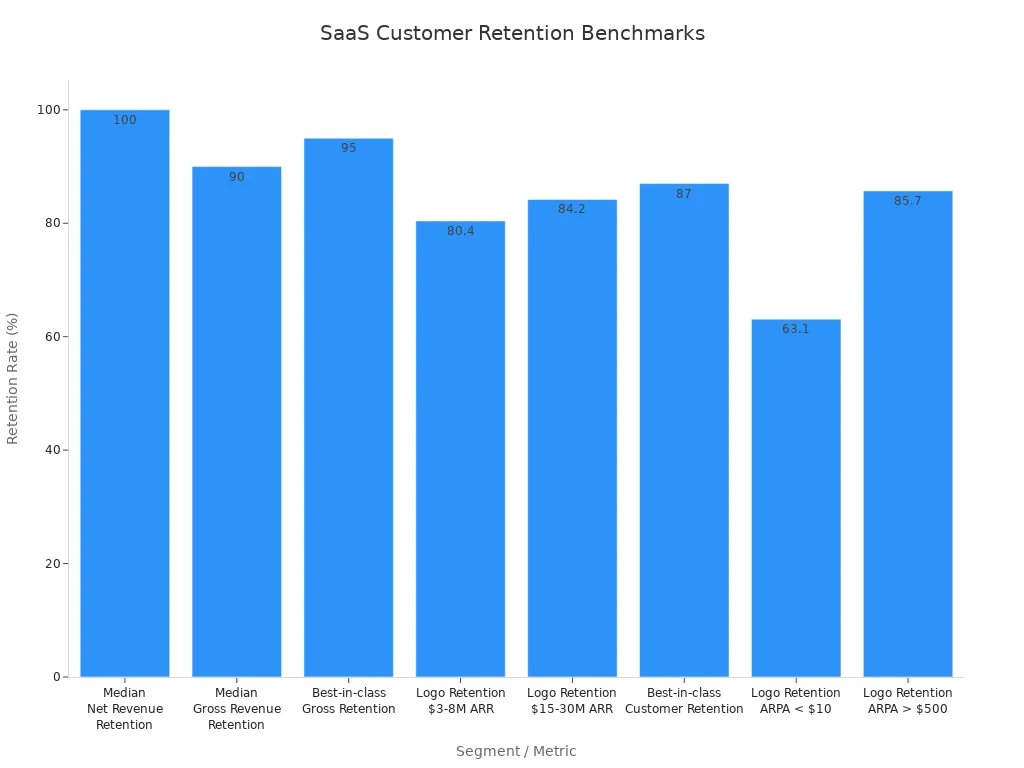
You can improve customer retention by offering personalized support, loyalty programs, and fast service. Sobot’s AI-powered tools help you respond quickly and keep customers engaged. When you focus on retention, you build trust and long-term relationships.
Tip: A 5% increase in customer retention can raise profits by up to 95%. Loyal customers also spend more and refer others.
Customer Lifetime Value (CLV)
Customer Lifetime Value (CLV) measures how much revenue you earn from a customer during their relationship with your business. CLV depends on how often customers buy, how much they spend, and how long they stay. In retail, CLV varies a lot. For example, beauty e-commerce brands see an average CLV of $188, while Starbucks customers can reach $14,099.
| Retail Segment | Average Customer Lifetime Value (CLV) |
|---|---|
| E-commerce (Beauty brands) | $188 |
| Starbucks (Retail Coffee) | $14,099 |
| Amazon Prime Customers | $1,340 per year (annual spend) |
Increasing CLV drives sustainable growth. When you keep customers longer, you earn more from each one. Using Sobot’s analytics, you can track CLV and find ways to increase it, such as offering personalized deals or proactive support. Predictive AI can help you spot at-risk customers and keep them loyal.
Note: Focusing on customer retention and loyalty boosts CLV, which leads to higher profits and long-term success.
Sobot Solutions for Customer Service KPIs

Voice/Call Center Features
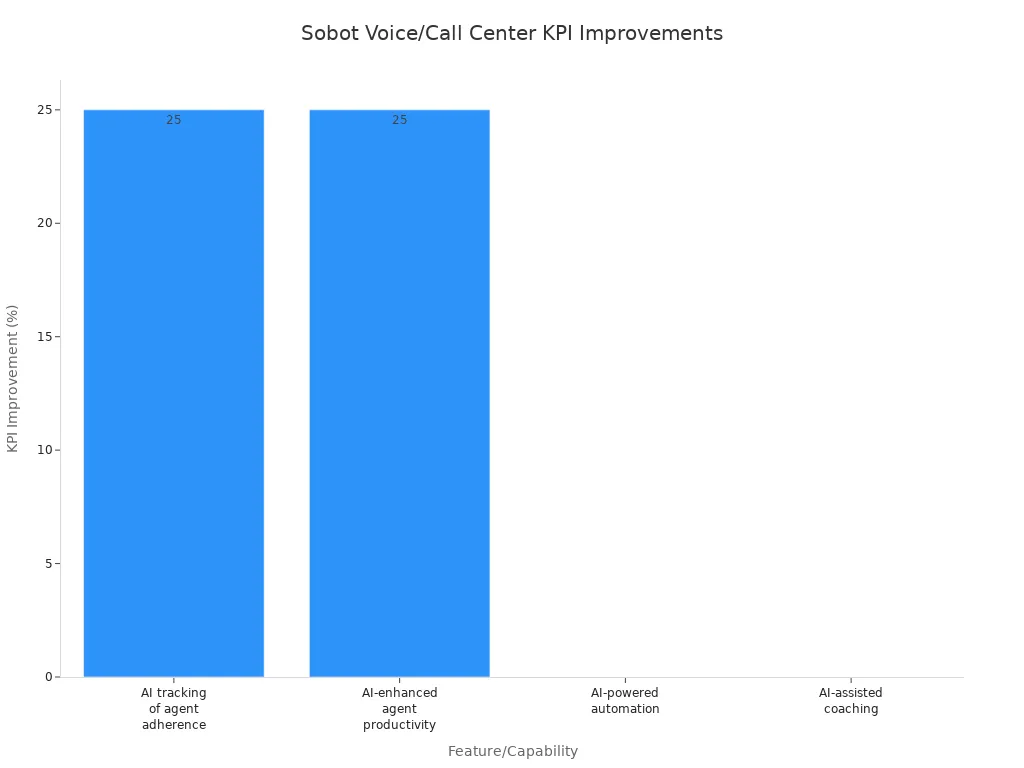
Sobot’s Voice/Call Center gives you powerful tools to improve your customer service. You can use AI tracking to make sure agents follow their schedules. This leads to a 25% increase in agent adherence to key performance indicators. Optimized shift scheduling helps you match staffing to demand, which reduces wait times and call abandonment. AI-powered automation cuts down on average handle time by up to 20%. Your agents can solve customer problems faster and more efficiently.
Here is a table showing how Sobot’s Voice/Call Center features impact customer service KPIs:
| Feature/Capability | Impact on Customer Service KPIs | Supporting Data/Statistics |
|---|---|---|
| AI tracking of agent adherence | Improves schedule compliance and service quality | 25% increase in adherence to agent schedules and KPIs |
| Optimized shift scheduling | Ensures adequate staffing, reduces wait times and call abandonment | Aligns staffing with demand, improving customer experience |
| AI-enhanced agent productivity | Boosts agent efficiency and faster issue resolution | 20-30% increase in agent productivity |
| AI-powered automation | Reduces Average Handle Time (AHT) | 15-20% reduction in AHT |
| AI-assisted coaching | Enhances agent engagement and training, improving CSAT | 20% improvement in Customer Satisfaction (CSAT) scores |
You can see how these features help you deliver a better customer experience. Sobot’s Voice/Call Center also supports global numbers and integrates with your CRM, so you can manage every customer interaction in one place.
Omnichannel Analytics
Sobot’s Omnichannel Solution lets you track customer service KPIs across all channels. You can collect customer feedback from phone, chat, email, and social media. The unified workspace brings all customer data together, so your team can see the full customer journey. This helps you spot trends and improve the customer experience.
For example, OPPO used Sobot’s chatbot and ticketing system to handle more customer requests during busy shopping seasons. The chatbot resolved 83% of customer questions, and OPPO saw a 94% positive feedback rate. Their repurchase rate increased by 57%. These results show how Sobot’s analytics and automation can boost your service KPIs and customer loyalty. Read more about OPPO’s story.
Real-Time Monitoring
With Sobot, you get real-time monitoring of all your customer service activities. You can watch key metrics like first response time, resolution rate, and customer satisfaction as they happen. This helps you react quickly to any issues and keep your service quality high. Real-time dashboards let you see agent performance and customer feedback instantly. You can coach your team on the spot and make changes to improve the customer experience right away.
Tip: Use Sobot’s real-time alerts to catch problems early and keep your customers happy.
Sobot’s solutions give you the tools to track, analyze, and improve every part of your customer service. You can build stronger relationships, get better feedback, and deliver a great customer experience every time.
Best Practices for Customer Service Metrics
Setting Targets
You need clear targets to improve customer service performance. Start by defining what success looks like for your team. For example, you might set a goal to raise customer satisfaction scores by 10% in six months. Use industry benchmarks to guide your targets. In many industries, a CSAT score above 78% shows strong performance. Make your goals specific and measurable. When you set clear targets, your team knows what to aim for and can focus on the right customer service metrics.
Tip: Use Sobot’s analytics dashboard to set and track your targets. You can compare your results to industry standards and adjust your goals as your business grows.
Regular Analysis
You should monitor and analyze performance often. Regular analysis helps you spot trends and fix problems before they grow. Review your customer service metrics weekly or monthly. Look for patterns in customer feedback, response times, and resolution rates. For example, if you see a drop in customer satisfaction, check if response times have increased. Sobot’s real-time reporting tools make it easy to see your data at a glance. You can export reports, share them with your team, and make quick decisions to improve the customer experience.
Note: Companies that review their customer service performance regularly see up to 30% higher retention rates (source).
Team Coaching
You improve customer support performance when you invest in agent training and coaching. Give your team feedback based on real data. Use call recordings and chat transcripts to show what works well and what needs improvement. Sobot’s unified workspace lets you review agent interactions and provide targeted coaching. Celebrate wins when your team meets or exceeds customer service KPIs. Offer extra support if someone struggles. When you focus on team coaching, you build skills and boost customer satisfaction.
Best practices for achieving customer service kpis include setting clear goals, tracking kpis, and supporting your team with ongoing training.
Tools for Measuring Customer Service KPIs
Sobot Platform
You need a reliable platform to measure customer service KPIs. Sobot gives you a complete solution for tracking every customer interaction. The platform collects data from calls, chats, emails, and social media. You can see all customer conversations in one place. This unified view helps you understand what your customer needs and how your team responds. Sobot’s dashboard shows real-time customer metrics, so you can spot trends and act fast. Over 10,000 brands use Sobot to improve customer satisfaction and boost customer loyalty. The platform’s AI features help you analyze customer feedback and predict future needs.
Integration with CRM
You can connect Sobot with your CRM system to get a full picture of each customer. When you link these systems, you see every customer’s history, preferences, and past issues. This helps your team give better support and solve problems faster. Sobot’s integration works with popular CRM tools, making it easy to set up. You do not need to switch between screens to find customer information. Everything you need is in one place. This saves time and helps you deliver a smooth customer experience. Studies show that companies with integrated systems see up to 30% higher customer retention rates (source).
Automated Reporting
You need to track customer KPIs without spending hours on manual reports. Sobot’s automated reporting tools collect and organize customer data for you. You can schedule reports to run daily, weekly, or monthly. The system sends these reports to your email or dashboard. You see key customer metrics like satisfaction scores, response times, and resolution rates. Automated reports help you find areas to improve and celebrate team wins. With Sobot, you always know how your customer service is performing. Automation lets you focus on helping your customer, not just tracking numbers.
Tip: Use Sobot’s unified analytics to compare customer KPIs across channels and time periods. This helps you make smart decisions and keep your customer happy.
You need to choose the right customer service KPIs to understand your customer and improve every interaction. Tracking these KPIs helps you see what your customer values most. For example, companies that monitor customer satisfaction see up to 30% higher retention rates (source). Sobot gives you real-time tools to track customer feedback, agent performance, and customer loyalty. You can use these insights to help your team deliver better customer experiences. When you focus on your customer, you build trust and increase satisfaction. Sobot’s platform supports your goals and helps you drive continuous improvement in customer service.
FAQ
What are the most important customer service KPIs to track?
You should focus on customer satisfaction KPIs like CSAT, NPS, and CES. Operational customer service metrics such as First Contact Resolution (FCR), Average Handle Time (AHT), and First Response Time (FRT) also matter. These KPIs help you measure and improve your customer experience.
How can Sobot help you improve customer service KPIs?
Sobot gives you real-time dashboards, omnichannel analytics, and AI-powered tools. You can track customer service KPIs across all channels. For example, OPPO used Sobot to reach an 83% chatbot resolution rate and a 94% positive feedback rate. Learn more here.
Why do customer satisfaction KPIs matter for your business?
Customer satisfaction KPIs show how happy your customers feel after each interaction. High scores mean loyal customers and more repeat business. Studies show that a 5% increase in retention can boost profits by up to 95% (source).
How often should you review customer service metrics?
You should review customer service metrics weekly or monthly. Regular analysis helps you spot trends and fix problems early. Companies that check their customer service KPIs often see up to 30% higher retention rates (source).
