Efficient Call Center Metrics Every Manager Should Track

An efficient call center relies on tracking the right metrics to boost efficiency and deliver excellent customer experiences. You need to use real-time data to make smart decisions that improve both agent performance and customer satisfaction. Sobot AI empowers you to increase operational efficiency and streamline every customer interaction. For example, Agilent achieved a sixfold increase in efficiency with Sobot call center solutions, showing how data-driven management transforms customer service.
Key Call Center Metrics
What Are Call Center Metrics
Call center metrics are the numbers and data points you use to measure how well your call center works. These metrics help you see how your team handles calls, how quickly they solve problems, and how happy your customers feel after each interaction. Some of the most common call center metrics include First Contact Resolution (FCR), Customer Satisfaction Score (CSAT), Net Promoter Score (NPS), Average Handle Time (AHT), and Call Abandonment Rate. For example, FCR measures if your team solves a customer’s issue on the first call. The industry standard for FCR is about 77% (source). Tracking these call center kpis helps you understand both agent performance and customer experience.
Why Metrics Matter for Efficiency
You need to track call center metrics to improve efficiency and deliver better service. When you monitor contact center metrics like AHT, Occupancy Rate, and Call Transfer Rate, you can spot problems early. High transfer rates or long after-call work times can slow down your team and frustrate customers. If you keep an eye on call center kpis such as CSAT and NPS, you can see how your service impacts customer loyalty. Using these metrics, you can balance efficiency and quality, making sure your agents stay productive without burning out. Automated tools and real-time dashboards help you track call center metrics and make quick decisions that boost performance.
Tip: Tracking multiple call center kpis together gives you a full picture of your team’s strengths and areas for improvement.
Sobot’s Approach to Metrics

Sobot’s Voice/Call Center gives you powerful tools to track call center metrics in real time. You get a dashboard that shows all your key call center kpis, from call volume to agent utilization rate. You can set alerts for calls that last too long or for certain keywords, so you can step in right away if needed. Sobot’s platform lets you analyze hundreds of contact center metrics, helping you make data-driven decisions. Role-based access means team leaders can monitor performance and support agents as needed. With Sobot, you can track call center metrics, improve efficiency, and deliver better customer experiences every day.
Customer Experience Metrics
You need to track customer experience metrics to understand how your call center impacts customer satisfaction and loyalty. These metrics show you what your customers feel after each interaction and help you improve your service. When you focus on the right metrics, you can boost satisfaction, increase retention, and build long-term relationships.
| Customer Experience Metric | Description | Correlation with Customer Loyalty |
|---|---|---|
| Customer Satisfaction Score (CSAT) | Measures customer satisfaction post-interaction, typically via surveys. | High CSAT scores indicate positive experiences leading to loyalty. |
| Customer Effort Score (CES) | Assesses ease of issue resolution during the call. | Lower effort correlates with higher loyalty and reduced churn. |
| Net Promoter Score (NPS) | Gauges likelihood of customers recommending the company. | High NPS predicts strong customer advocacy and retention. |
| First Call Resolution (FCR) | Percentage of issues resolved on the first call. | Higher FCR improves satisfaction and retention rates. |
Customer Satisfaction (CSAT)
Customer satisfaction is the most direct way to measure how happy your customers feel after calls. You usually collect the customer satisfaction score through a quick survey at the end of each call. In call centers, a CSAT score above 75% is good, and 80% or higher means your performance stands out (source). High customer satisfaction scores show that your team delivers great experiences. Sobot’s omnichannel solution helps you gather and analyze customer satisfaction data from every channel, so you always know how your customers feel.
Net Promoter Score (NPS)
Net Promoter Score is a key customer experience metric that tells you how likely your customers are to recommend your service. You ask customers to rate their experience on a scale from 0 to 10. High NPS scores mean your customers trust your call center and want to share their positive experience. Tracking NPS helps you spot trends in customer satisfaction and loyalty. Sobot’s unified workspace lets you view NPS results alongside other metrics, making it easy to see the full picture of your performance.
First Call Resolution (FCR)
First call resolution measures how often your team solves customer issues on the first call. This metric is critical for customer satisfaction and efficiency. The industry average for first call resolution is about 70%, but top-performing call centers reach 80% or higher (source). High FCR means your customers get answers fast, which boosts satisfaction and reduces repeat calls. Sobot’s intelligent routing and AI-powered tools help you improve first call resolution by connecting customers to the right agent every time.
Customer Effort Score (CES)
Customer effort score shows how easy it is for your customers to resolve their issues. Lower effort means higher satisfaction and loyalty. Studies show that 94% of customers with low-effort experiences will buy again, while 96% of those with high-effort interactions feel disloyal. You can lower customer effort by offering self-service options and using intelligent call routing. Sobot’s omnichannel platform gives your customers quick answers and connects them to the right agent, reducing effort and improving satisfaction.
Note: Agilent used Sobot’s omnichannel solution to boost customer satisfaction and efficiency. By combining AI chatbots and smart routing, Agilent achieved a 95% customer satisfaction score and a sixfold increase in service efficiency. This real-world example shows how tracking customer experience metrics and using the right tools can transform your call center performance.
Agent Performance Metrics
Tracking the right agent performance metrics is essential for improving call center performance. You need to focus on metrics that reflect both productivity and quality. Sobot’s unified workspace and AI-powered tools help you monitor these metrics in real time, making it easier to optimize agent performance and deliver better customer experiences.
Average Handle Time (AHT)
Average Handle Time (AHT) measures the total time agents spend on calls, including talk time, hold time, and after-call work. This metric helps you understand how efficiently your team manages customer interactions. The industry benchmark for AHT varies by sector:
| Industry | Average Handle Time (AHT) Range (minutes) |
|---|---|
| General Call Centers | 4 - 6 |
| Banking / Telecom | 5 - 7 |
| Retail / E-commerce | 2 - 4 |
| Technical Support | 7 - 10 |
A balanced AHT means your agents resolve issues quickly without sacrificing quality. Sobot’s AI Copilot suggests replies and drafts summaries, helping agents reduce AHT while maintaining high service standards.
Occupancy Rate
Occupancy rate shows the percentage of time agents spend handling calls compared to their total available work time. An ideal occupancy rate falls between 80% and 90%. High occupancy boosts productivity but can cause stress and burnout if not managed well. Low occupancy signals underutilization and higher labor costs. Sobot’s real-time dashboards let you track occupancy and adjust staffing to maintain optimal call center performance.
Tip: Use forecasting and scheduling tools to keep occupancy rates balanced and avoid agent burnout.
Utilization Rate
Utilization rate measures how much of an agent’s scheduled time is spent on productive tasks, including calls and after-call work. High-performing call centers aim for utilization rates between 80% and 90%. This range supports efficiency and agent well-being. Sobot’s unified workspace streamlines workflows, helping you achieve excellent utilization rates and improve overall call center performance metrics.
After-Call Work (ACW)
After-Call Work (ACW) is the time agents spend completing tasks after calls, such as updating records or sending follow-up emails. Shorter ACW times mean agents return to handling calls faster, reducing customer wait times. Sobot’s AI-powered tools automate routine documentation, allowing agents to focus on more complex issues and boosting call center performance.
You can use these agent performance metrics to identify coaching needs, optimize scheduling, and improve both agent satisfaction and customer outcomes. Sobot’s platform provides the analytics you need to make data-driven decisions and elevate your call center performance.
Operational and Financial Metrics
Tracking operational and financial metrics gives you a clear view of your call center’s performance. These metrics help you manage costs, improve service, and make smart decisions. Sobot’s Voice/Call Center provides real-time analytics and reporting, so you can monitor these metrics and boost operational efficiency.
| Metric Name | Description |
|---|---|
| Service Level | Percentage of calls answered within a set time (e.g., 80% in 20 seconds). |
| Average Speed of Answer | Average time it takes for agents to answer calls. |
| Call Abandonment Rate | Percentage of calls where customers hang up before reaching an agent. |
| Cost Per Call | Average cost to handle each call, including labor and technology. |
| Call Volume | Total number of calls received in a given period. |
Service Level
Service level measures how quickly your team answers calls. Many call centers use the 80/20 rule, aiming to answer 80% of calls within 20 seconds. This standard helps you set expectations, but you should also consider customer satisfaction and call abandonment rates. Sobot’s real-time dashboards let you track service level and adjust staffing to meet your goals. Learn more about service level standards.
Average Speed of Answer (ASA)
Average Speed of Answer shows how fast agents pick up calls. Keeping ASA under 20 seconds often leads to higher customer satisfaction. Fast answers show customers you value their time. Sobot’s analytics help you spot trends and keep ASA in the ideal range for strong call center performance.
Call Abandonment Rate
Call abandonment rate tells you how many customers hang up before speaking to an agent. The industry average is about 5%. High rates can signal long wait times or staffing issues. Sobot’s monitoring tools alert you when abandonment rates rise, so you can act quickly.
Cost Per Call
Cost per call measures how much you spend to handle each call. You can lower this by using AI, self-service options, and smart routing. Sobot’s Voice/Call Center uses automation and AI to reduce costs while keeping performance high.
Call Volume
Call volume tracks the number of calls your call center handles. The average call center manages about 4,400 calls per month. Sobot’s reporting tools help you spot peak times and plan resources, so you always deliver top performance.
Tip: Use Sobot’s real-time analytics to monitor all your call center operational metrics and make data-driven decisions for better performance.
Improving Efficiency with Sobot
You can transform your call center into an efficient call center by using the right call center metrics and Sobot’s advanced tools. This section gives you a step-by-step guide to identify improvement areas, set meaningful goals, implement data-driven changes, and maintain continuous monitoring for lasting efficiency. Sobot’s unified workspace, real-time monitoring, and AI-powered analytics help you improve call center metrics and deliver a better customer experience.
Identifying Areas for Improvement
You need to start by finding where your call center can do better. Consistent tracking of call center metrics over time helps you spot trends and areas that need attention. Here are the most effective methods you can use:
- Track key call center metrics like first contact resolution, customer satisfaction, average handle time, and call abandonment rate. Look for patterns or sudden changes.
- Set clear, metric-based goals for your team, such as answering 80% of calls within 20 seconds.
- Collect customer feedback through post-call surveys and detailed questionnaires. This feedback highlights pain points in the customer experience.
- Use Sobot’s real-time dashboards to monitor contact center KPIs such as call volume, satisfaction scores, and agent utilization. These dashboards give you instant visibility into performance gaps.
- Review quality assurance scorecards and call recordings to assess service quality and identify training needs.
- Leverage Sobot’s AI-powered analytics to analyze customer-agent interactions, predict trends, and uncover workflow bottlenecks.
- Create anonymous feedback channels for agents. Honest input from your team can reveal hidden issues and improvement opportunities.
Tip: Regularly review both customer and agent feedback. This helps you understand the full experience and drives meaningful improvement.
Setting Goals and KPIs
Once you identify areas for improvement, you need to set realistic and impactful goals. Use industry benchmarks to guide your targets. For example, many efficient call centers aim for a first contact resolution rate above 77% and a call abandonment rate below 5% (ICMI). Here’s how you can set effective goals and KPIs:
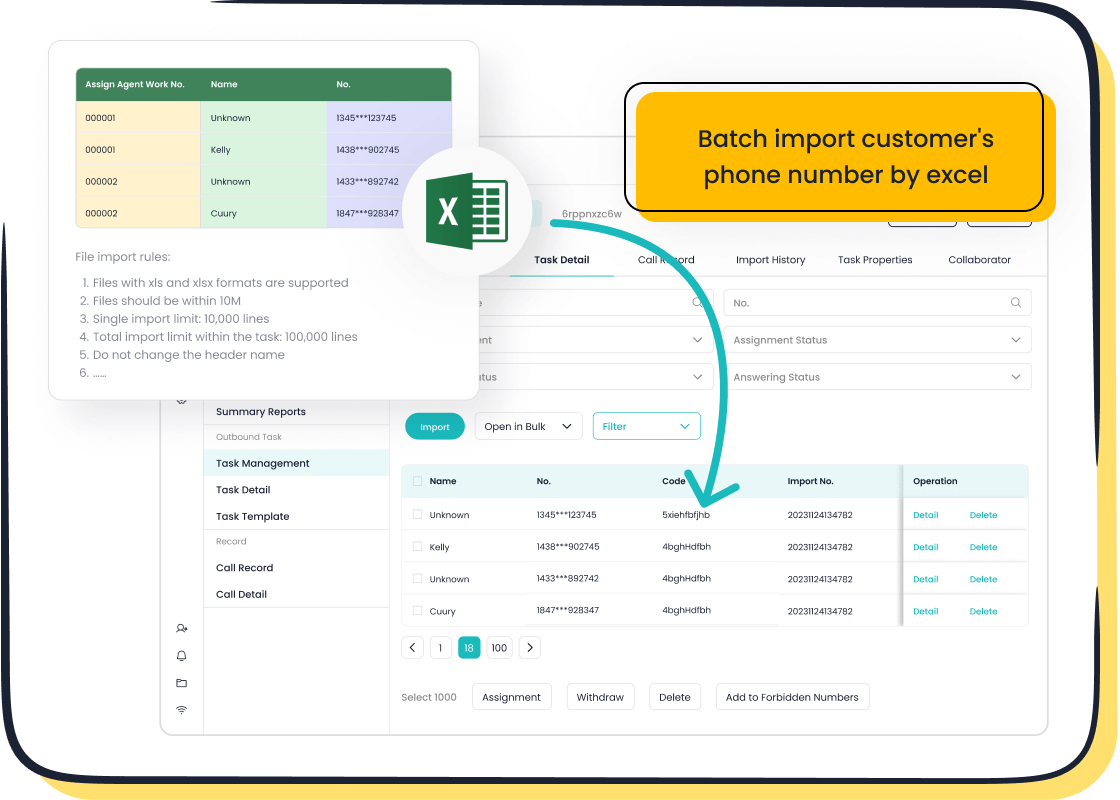
- Collect accurate data using Sobot’s automated tracking tools. This ensures you base your goals on real performance.
- Analyze your data to find trends and performance issues.
- Set SMART goals—Specific, Measurable, Attainable, Relevant, and Time-bound. For example, “Increase customer satisfaction score to 85% within six months.”
- Align your KPIs with your business objectives. Focus on metrics like customer satisfaction, average handle time, and contact center KPIs that matter most to your customer experience.
- Involve your agents in the goal-setting process. Ask for their feedback and review goals together in team meetings.
- Balance short-term and long-term goals to keep your team motivated and focused on continuous improvement.
- Use Sobot’s unified workspace to track progress toward your KPIs in real time.
Note: Different industries have unique benchmarks. For example, healthcare call centers may have longer average speed to answer due to complex needs. Always set goals that fit your specific environment.
Implementing Data-Driven Changes
You can drive real improvement by making changes based on data, not guesswork. Sobot’s AI and automation features make this process easier and more effective. Follow these best practices:
- Use Sobot’s AI-powered workforce management to forecast call volumes and schedule agents efficiently. This balances service levels and agent satisfaction.
- Start with small pilot programs when testing new processes or technologies. This reduces risk and helps you gather feedback before a full rollout.
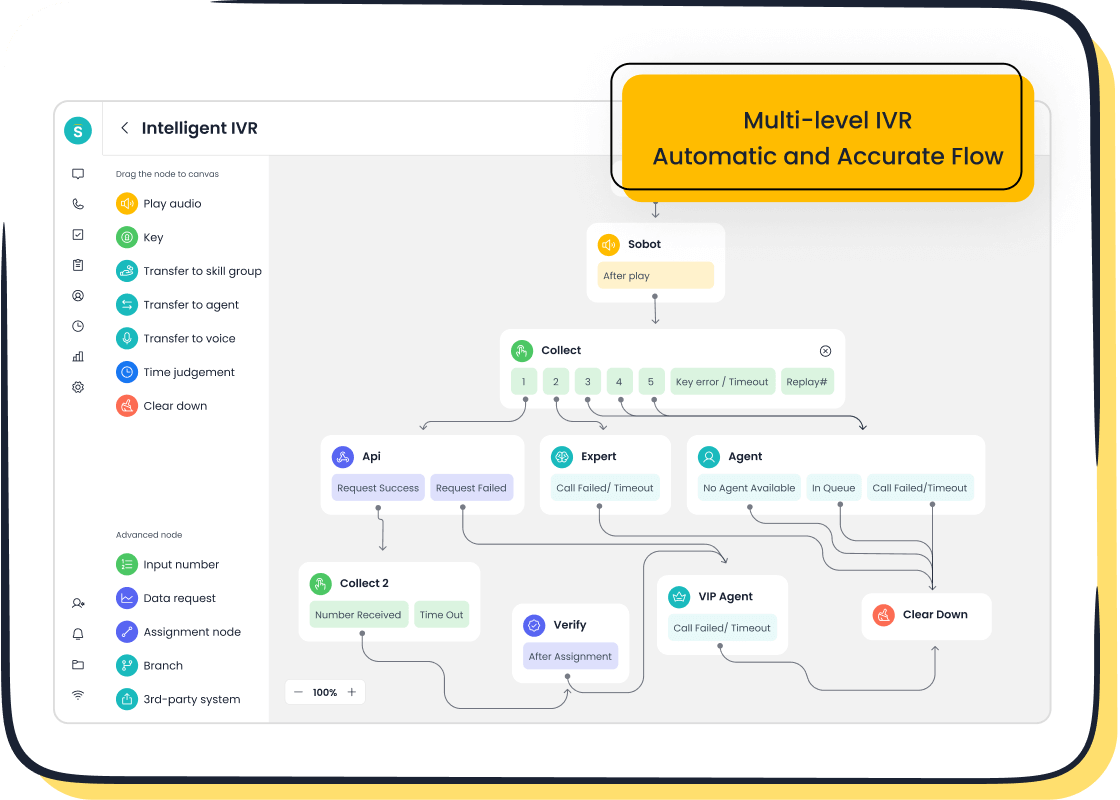
- Implement intelligent call routing with Sobot’s smart IVR and AI voicebot. Match customers with the best agent based on call reason and customer history.
- Provide agents with comprehensive customer data in Sobot’s unified workspace. This enables personalized service and improves the customer experience.
- Integrate your CRM with Sobot to give agents quick access to customer information, making every interaction more efficient.
- Use quality management tools like call recording, speech analytics, and automated scoring to identify performance gaps and target training.
- Empower team leaders with real-time data and coaching resources. Sobot’s dashboards make it easy to spot issues and support agents.
Callout: The MultiChannel Review Manager, integrated with Sobot AI, has helped companies reduce response times by up to 90% and increase customer satisfaction by 25%. This shows the power of data-driven changes in boosting efficiency and satisfaction.
Continuous Monitoring
Sustained efficiency requires ongoing monitoring of your call center metrics. Sobot’s real-time analytics and AI-driven insights make continuous improvement possible. Here’s how you can keep your call center performing at its best:
- Use Sobot’s real-time monitoring to track key metrics like average handle time, first contact resolution, customer satisfaction, and call volume.
- Set up alerts for performance dips or spikes, so you can act quickly.
- Regularly review performance dashboards with your team. Celebrate wins and address challenges together.
- Automate repetitive tasks with Sobot’s AI tools. This frees up agents to focus on complex customer needs and improves overall efficiency.
- Leverage predictive analytics to forecast demand and allocate resources proactively.
- Foster a culture of continuous improvement by encouraging feedback, recognizing achievements, and sharing best practices.
- Benchmark your performance against industry standards and adapt your strategies as needed.
Note: Agilent’s story shows the impact of continuous monitoring and improvement. By using Sobot’s omnichannel solution, Agilent achieved a sixfold increase in efficiency and a 95% customer satisfaction score. Their team used real-time data to make quick adjustments and deliver a better customer experience.
| Company | Sobot Feature Used | Measurable Efficiency Gain |
|---|---|---|
| Agilent | Omnichannel, AI Chatbot, Real-Time Monitoring | 6x increase in efficiency, 95% satisfaction |
| MultiChannel Review Manager | AI-driven review management | 90% faster response, 25% higher satisfaction |
You can achieve similar results by using Sobot’s advanced tools and focusing on the right call center metrics. Continuous monitoring, data-driven decisions, and a commitment to improvement will help you build an efficient call center that delivers outstanding customer experience and satisfaction.
Tracking and acting on the right call center metrics shapes a high-quality experience for both agents and customers. You gain long-term benefits like improved agent engagement, consistent service quality, and a better overall experience. Sobot’s real-time analytics and AI tools help you spot trends, optimize operations, and deliver a seamless experience. Use these insights to drive continuous improvement and position your call center for lasting success.
FAQ
What are the most important call center metrics for an efficient call center?
You should focus on call center metrics like First Call Resolution (FCR), Customer Satisfaction Score (CSAT), Net Promoter Score (NPS), Average Handle Time (AHT), and Call Abandonment Rate. These call center KPIs help you measure both efficiency and customer experience.
How does Sobot help you track call center metrics in real time?
Sobot’s Voice/Call Center provides real-time dashboards and analytics. You can monitor call center metrics such as call volume, agent utilization, and service level instantly. This helps you make quick decisions and maintain an efficient call center at all times.
Why should you track call center KPIs regularly?
Tracking call center KPIs helps you spot trends, identify issues, and improve performance. For example, monitoring AHT and FCR lets you see where agents need support. Regular tracking ensures your efficient call center meets customer expectations and business goals.
Can Sobot’s solutions improve customer satisfaction and reduce costs?
Yes! Sobot’s omnichannel solution and AI-powered tools help you automate routine tasks, route calls smartly, and provide 24/7 support. Agilent used Sobot to achieve a 95% customer satisfaction score and cut costs by 25%. Read Agilent’s story.
What is the industry benchmark for First Call Resolution (FCR)?
The industry standard for FCR is about 77% (source). Efficient call centers using Sobot’s intelligent routing often reach higher FCR rates, which leads to better customer satisfaction and fewer repeat calls.
Tip: Review your call center metrics weekly to keep your team on track and your customers happy.
See Also
Effective Strategies To Enhance Call Center Performance Monitoring
Essential Best Practices For Managing Call Center Quality
Leading Call Center Analytics Tools To Use In 2024
Understanding The Efficient Functioning Of Call Center Automation
Comprehensive Guide To Quality Management System Principles For Call Centers
