CSAT vs NPS vs CES Which Metric to Use in 2025

Choosing the right customer satisfaction metrics depends entirely on your business goal. You use NPS to measure customer loyalty. You should use CSAT for feedback on specific interactions. You can use CES to check your process efficiency. The core difference between CSAT and NPS is their focus on transactions versus overall brand perception. A powerful customer experience strategy combines these metrics. This approach turns data into action. For example, leaders in customer experience see significant growth over competitors.
| Metric | CX Leaders | CX Laggards | Advantage/Impact |
|---|---|---|---|
| Compound Average Growth | 17% | 3% | 14 percentage point difference |
Platforms like the Sobot call center, powered by Sobot AI, help you track every metric in one place, giving your customer a better experience and boosting satisfaction.
The Three Core CX Metrics Defined

To choose the right tools, you first need to understand what they do. The three main customer experience metrics—CSAT, NPS, and CES—each measure a different aspect of the customer experience. Let's define these core customer satisfaction metrics.
What is CSAT?
CSAT, or Customer Satisfaction Score, measures a customer's satisfaction with a specific product, service, or interaction. The idea of a measurable CSAT metric emerged in the 1980s, turning the concept of customer happiness into actionable data. You typically ask a question like, "How satisfied were you with your experience today?"
You can collect this feedback using different formats:
- Rating Scales: A 1-5 or 1-7 scale.
- Binary Questions: Simple Yes/No answers.
- Multiple-Choice Questions: Predefined options for the customer.
This metric gives you immediate feedback on individual touchpoints. For example, the average CSAT score for e-commerce was 80 in 2023, showing a high level of satisfaction in that industry. A high customer satisfaction score is a great sign.
Understanding Net Promoter Score (NPS)
Net Promoter Score (NPS) measures long-term customer loyalty and advocacy. Fred Reichheld introduced this metric in a 2003 Harvard Business Review article, "The One Number You Need to Grow." It asks one simple question: "On a scale of 0-10, how likely are you to recommend our company to a friend or colleague?"
Based on their answers, you group customers into three categories:
- Promoters (9-10): Your most loyal and enthusiastic customers.
- Passives (7-8): Satisfied but not loyal enough to promote your brand.
- Detractors (0-6): Unhappy customers who can damage your brand through negative word-of-mouth.
You calculate your NPS by subtracting the percentage of Detractors from the percentage of Promoters.
NPS = % Promoters - % Detractors
A score above 30 is generally considered good, but this varies by industry. Strong advocacy from promoters is key to growth.
What is CES?
CES, or Customer Effort Score, measures how much effort a customer had to put in to get an issue resolved, a request fulfilled, or a question answered. The modern CES 2.0 question is phrased as a statement: "To what extent do you agree with the following statement: The company made it easy for me to handle my issue?" Customers rate their agreement on a 1-7 scale.
Gartner research shows that low-effort experiences build loyalty. In fact, 96% of customers with a high-effort experience become more disloyal. A low CES score is a strong predictor of future purchases and customer advocacy. This makes CES one of the most important customer experience metrics for service-focused teams.
The Core Difference Between CSAT and NPS
The core difference between CSAT and NPS is their scope. CSAT is a transactional metric, while NPS is a relationship metric.
- CSAT measures short-term satisfaction with a specific interaction. It helps you pinpoint issues at individual touchpoints.
- NPS measures overall customer loyalty and their long-term feeling about your brand. It predicts business growth and customer advocacy.
Think of the difference between CSAT and NPS this way: CSAT tells you how a customer felt about a single conversation, while NPS tells you if that customer is likely to stick with you for years to come. Understanding the difference between CSAT and NPS is key to building a complete customer feedback strategy.
Choosing Your Metric: A Goal-Oriented Guide
Now that you understand what each metric does, you can choose the right one for the job. The best approach is to start with your goal. Different goals require different customer satisfaction metrics. Let's explore which metric to use based on what you want to achieve.
Goal: Improve Specific Touchpoints
Your Best Metric: CSAT (Customer Satisfaction Score)
If your goal is to improve a specific part of the customer journey, CSAT is your most direct tool. This metric gives you immediate, targeted feedback on individual interactions. You can find out exactly how a customer feels about their experience with a support agent, their checkout process, or a new feature you just launched.
To get the most accurate CSAT data, timing is everything. You should send surveys at key moments in the customer journey, not on a fixed schedule.
- Send surveys immediately: The experience is fresh in the customer's mind. This leads to more honest and detailed feedback. In fact, real-time feedback is up to 40% more accurate than feedback collected just 24 hours later.
- Automate your triggers: You can set up systems to automatically send a CSAT survey within minutes of an interaction ending, like after a live chat session closes.
- Focus on key touchpoints: Gathering feedback right after a product delivery or a support call gives you relevant insights you can act on instantly.
Pro Tip: Using in-app or on-site surveys for these interactions can boost response rates and improve the user experience, especially for mobile users. A high CSAT score at a specific touchpoint tells you what's working, while a dip in satisfaction points you directly to the problem area.
Goal: Track Brand Loyalty and Growth
Your Best Metric: NPS (Net Promoter Score)
When your goal is to measure long-term customer loyalty and predict business growth, the Net Promoter Score is the industry standard. This metric doesn't ask about a single transaction; it asks about the customer's overall relationship with your brand. A high NPS indicates strong customer loyalty and a powerful engine for organic growth through word-of-mouth advocacy.
Research from Bain & Company, the creators of NPS, established a clear link between a high Net Promoter Score and revenue growth. Their studies found that companies with the highest customer loyalty grew at more than double the rate of their competitors. Promoters buy more, stay longer, and create positive advocacy for your brand.
Many leading companies use NPS to drive strategic change and build lasting retention.
| Company | NPS Strategy | Impact on Loyalty/Business |
|---|---|---|
| Apple | Managers personally call unhappy customers (Detractors) within 24 hours. | Rebuilds relationships and turns a negative experience into a positive one, boosting customer retention. |
| Amazon | Obsessively tracks customer sentiment to improve the entire experience. | Achieves repeat purchase rates above 90% for Prime members, creating powerful customer loyalty. |
| HotelTonight | Uses NPS feedback to quickly document and address customer problems. | Fixes the root causes of issues, which fosters loyalty and keeps the brand tuned into customer needs. |
Tracking your NPS gives you a high-level view of customer health and your potential for growth. It is the ultimate metric for measuring brand advocacy.
Goal: Reduce Customer Friction
Your Best Metric: CES (Customer Effort Score)
If your goal is to make your processes smoother and more efficient for your customers, CES is the perfect metric. This metric measures how easy it is for a customer to get something done, whether it's resolving an issue, finding information, or making a purchase. A low-effort experience is a massive driver of loyalty.
Gartner's research reveals a surprising truth: reducing customer effort is more predictive of loyalty than "delighting" them.
- 96% of customers who have a high-effort experience become more disloyal.
- In contrast, only 9% of those with a low-effort experience become disloyal.
- CES is 1.8x more predictive of customer loyalty than CSAT and 2x more predictive than NPS.
Making things easy for your customer directly impacts their decision to come back. A high CES score is a red flag that a process is broken. For example, many e-commerce brands use CES to pinpoint and fix issues in their checkout flow.
| Brand | Challenge | CES-Driven Solution | Outcome |
|---|---|---|---|
| Beauty Brand | Confusing coupon application during checkout. | Added clearer UI instructions and simplified the entry field. | 30% reduction in checkout effort scores. |
| Body Care Retailer | Mobile users struggled with the payment process. | Redesigned the mobile checkout flow for simplicity. | 15% increase in mobile conversions. |
| Cosmetics Company | Unclear shipping options caused frustration. | Added transparent shipping information earlier in the process. | 25% drop in post-purchase effort scores. |
By using the CES metric, you can identify and eliminate friction, which increases repurchase intent and strengthens customer satisfaction and retention.
How Sobot's Platform Powers Your CX Metrics
Tracking these metrics is simple when you have the right tools. Sobot's Omnichannel Solution gives you a unified platform to collect, analyze, and act on all your customer feedback. You can manage CSAT, NPS, and CES from one central place. This approach provides a complete view of the customer experience and helps you improve satisfaction.
Collecting CSAT with Sobot's Live Chat
You can capture immediate feedback on agent performance with Sobot's Live Chat. After a chat session ends, you can automatically trigger a CSAT survey. This gives the customer a quick way to rate their experience while it is still fresh in their mind. This instant feedback helps you measure agent effectiveness and identify areas for training. A high CSAT score shows your team is delivering great service.
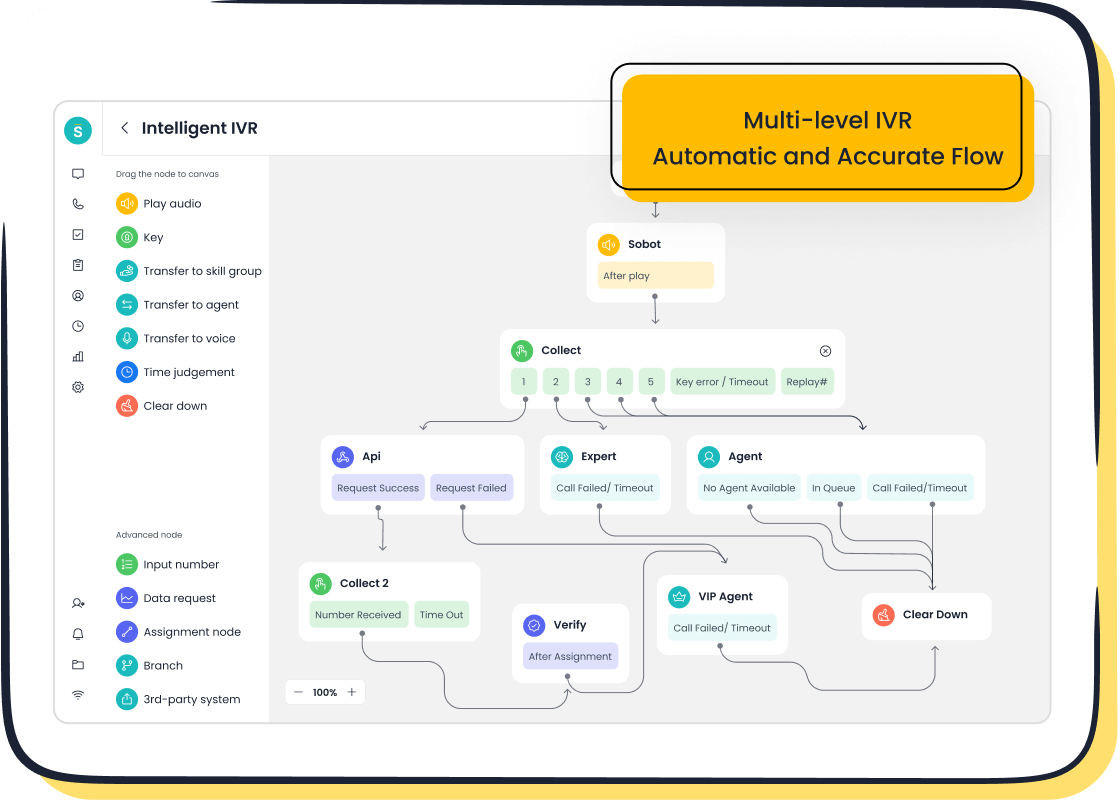
Gathering CES with the Voice/Call Center
You can easily measure customer effort with the Sobot Voice/Call Center. The platform includes a drag-n-drop IVR builder. You can use this tool to create a simple post-call survey.
Example: After a support call, you can ask the customer to rate how easy it was to solve their problem. This CES feedback pinpoints friction in your support processes. You can also use this feature to gather CSAT data for a specific call.
Tracking NPS Across the Customer Journey
You can use Sobot to send NPS surveys at key points in the customer journey. This helps you track long-term loyalty. Combining these metrics delivers powerful results. For example, our client Agilent used Sobot's solution to streamline their service.
| Customer | Challenge | Sobot Solution | Result |
|---|---|---|---|
| Agilent | High inquiry volume | Omnichannel workbench & AI | 95% customer satisfaction |
By using Sobot to manage customer interactions and gather feedback, Agilent achieved a 95% satisfaction score. This shows how a unified platform for all your metrics can turn a complex customer journey into a seamless experience.
Combining Metrics for a Complete Picture

The most effective customer satisfaction measurement strategy does not treat CSAT, NPS, and CES as competitors. Instead, you should use these customer satisfaction metrics together. They are complementary tools that give you a complete, 360-degree view of the customer experience. Combining them allows you to move from identifying a problem to finding its root cause. Think of it as a diagnostic process: NPS tells you what is wrong, CSAT shows you where it happened, and CES explains why it was a problem.
From a Low NPS Score to a Solution
A drop in your NPS is a high-level alarm bell. It signals a decline in overall customer loyalty and advocacy. This metric tells you what the problem is: your customers are becoming less likely to recommend you. For example, Peloton's NPS fell significantly after customers faced delivery delays and hardware issues. The low NPS score was the first clear indicator of widespread customer dissatisfaction, even before digging into specific complaints. A falling NPS demands investigation to protect your brand and prevent customer churn.
Using CSAT to Diagnose Touchpoint Issues
Once your NPS alerts you to a problem, you can use CSAT to find where the issue is located. By analyzing CSAT scores at different stages of the customer journey, you can pinpoint the exact interaction that is causing frustration.
For instance, if your overall NPS is low, you might find that CSAT scores are particularly poor after support calls. This tells you the problem isn't your product or website, but your support experience. Analyzing this customer experience data helps you focus your efforts on the right area. This is a key step in turning feedback into action and improving customer satisfaction.
Using CES to Pinpoint Process Flaws
After CSAT shows you where the bad experience is, CES tells you why it happened. A high CES score for a specific interaction reveals that your process was too difficult for the customer. This friction is a major source of poor satisfaction and eroding loyalty.
If customers report low satisfaction (CSAT) after a support call, a follow-up CES question might reveal the process to resolve their issue required too much effort. This insight allows you to fix the underlying process, not just retrain an agent. By combining these three powerful metrics—NPS, CSAT, and CES—you create a clear path from a general problem to a specific, actionable solution, boosting both satisfaction and advocacy.
You should match the right metric to your mission. This helps you understand your customers better.
- Use NPS for customer loyalty.
- Use CSAT for interaction satisfaction.
- Use CES for customer effort.
The best strategy for 2025 is using them together. This gives you a complete view of the customer experience. Platforms like Sobot provide the tools you need for this comprehensive approach. You can start your successful contact journey today and give every customer a great experience.
FAQ
Which customer satisfaction metric is the best?
The "best" metric depends on your goal. Use NPS for loyalty, CSAT for specific interactions, and CES for process ease. The most powerful strategy uses all three customer satisfaction metrics together to get a complete view of your customer's experience.
How often should you send surveys?
You should send surveys based on customer actions, not a fixed schedule. Trigger a CSAT survey immediately after a support chat. Send an NPS survey after a key milestone, like a second purchase. This gives you relevant, timely feedback.
Can you use just one metric instead of all three?
Yes, you can start with one. If your goal is to fix a specific touchpoint, CSAT is a great starting point. However, combining metrics gives you a much deeper understanding of the "what," "where," and "why" behind your customer satisfaction scores.
What is a good score for these metrics?
Good scores vary by industry.
For NPS, a score above 30 is generally good. For CSAT, aim for 80% or higher. For CES, you want the lowest score possible, as it measures effort. You can use platforms like Sobot to track your scores against benchmarks.
How can you improve a low score?
A low score is an opportunity. Use the data to find the problem. A low NPS score can be investigated with CSAT data to find the touchpoint. CES then tells you if the process was too hard. This helps you make targeted improvements.
See Also
Leading Call Center Analytics Software Solutions for 2024 Reviewed
Best Speech Analytics Tools for Call Centers in 2024
Comprehensive Review of Top Contact Center Solutions for 2024
Implementing Effective Quality Management Best Practices in Call Centers
