15 Key Customer Service Performance Indicators for Modern Teams
Here are 15 key performance indicators that modern teams use to improve customer experience:
- Customer Satisfaction (CSAT)
- Net Promoter Score (NPS)
- Customer Effort Score (CES)
- First Contact Resolution
- Customer Retention Rate
- Average Response Time
- Average Handle Time
- Ticket Volume
- Abandonment Rate
- Self-Service Usage Rate
- Agent Productivity
- Agent Utilization Rate
- Quality Assurance Score
- Training Completion Rate
- Employee Satisfaction Score
Tracking these customer service metrics helps you increase customer satisfaction, boost team efficiency, and drive business growth. When you focus on customer experience, you see benefits like higher loyalty, better retention, and more upselling opportunities. Systematic tracking of customer service performance indicators lets you spot trends, make informed decisions, and deliver services tailored to your customers’ needs.
In omnichannel environments, customer service KPIs give you a full view of the customer journey. You can measure satisfaction, efficiency, and channel performance across every touchpoint. For example, Sobot AI and the Sobot call center help you monitor metrics in real time, unify customer data, and improve customer experience for every interaction.
Review your current KPIs and consider adopting these customer experience benchmarks for 2025. With Sobot, you can set new standards for satisfaction and operational excellence.
Customer Experience KPIs
Modern customer service teams rely on a set of customer experience kpi metrics to measure and improve every interaction. These KPIs help you understand how well your team meets customer needs, builds loyalty, and drives business growth. Let’s explore the five most important customer experience indicators and see how you can use them to deliver outstanding service.
Customer Satisfaction (CSAT)
Customer satisfaction is the most direct measure of how happy your customers feel after an interaction. You usually collect this score through a simple survey asking, “How satisfied were you with your experience?” Customers respond on a scale, often from 1 to 5 or 1 to 10. The customer satisfaction score gives you a clear snapshot of your service quality.
High customer satisfaction scores show that your team meets or exceeds expectations. Low scores signal problems that need quick attention.
CSAT Benchmarks by Industry
| Industry | Average CSAT Score (%) |
|---|---|
| Software | 78 |
| E-commerce | 80 |
| Travel | 76 |
| Social Media | 73 |
| Internet Providers | 68 |
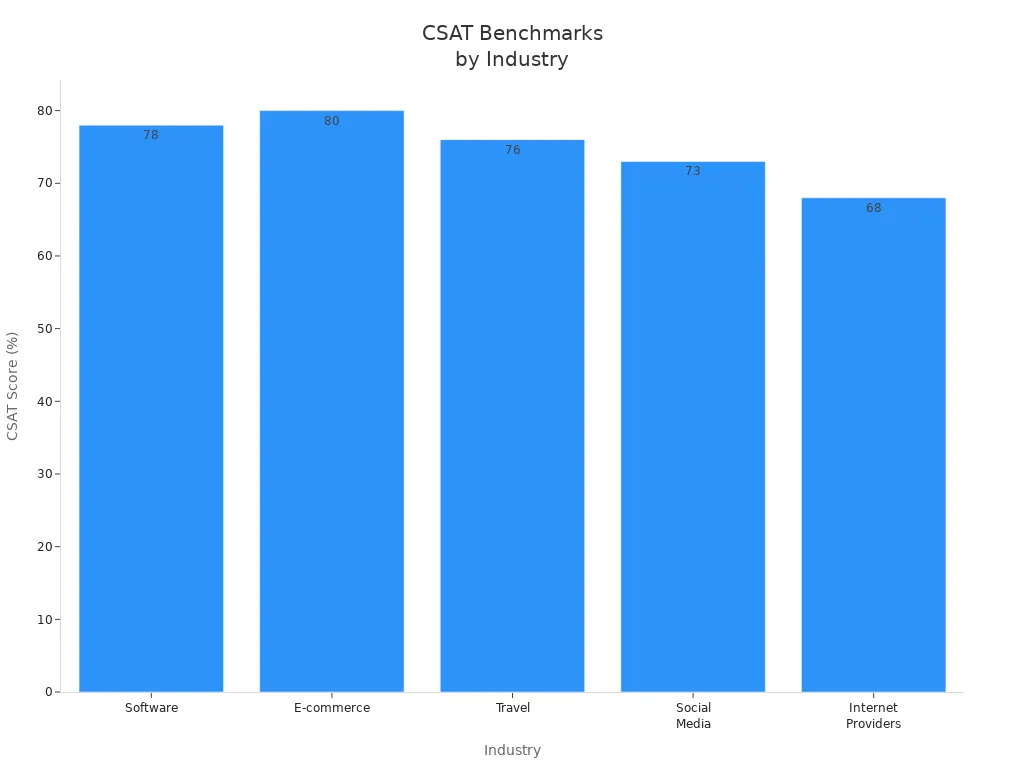
Scores above 80% are good, and above 90% are exceptional. You should compare your customer satisfaction score to your industry average to set realistic goals.
Why CSAT Matters for Customer Experience
Improving customer satisfaction leads to stronger loyalty and more repeat business. Here’s how:
- Loyal customers stay longer and refer others, reducing your acquisition costs.
- Measuring CSAT right after an interaction predicts if a customer will buy again.
- Combining CSAT with other customer experience kpi metrics gives a full view of loyalty.
- Real-time customer feedback helps you fix issues fast and boost satisfaction.
- Consistent experiences across all channels build trust and long-term relationships.
When you use Sobot’s omnichannel solution, you can collect and analyze CSAT data from every channel—voice, chat, email, and social media. This unified approach helps you spot trends, act on feedback, and deliver seamless customer experiences.
Net Promoter Score (NPS)
Net Promoter Score measures how likely your customers are to recommend your business to others. You ask, “How likely are you to recommend us to a friend or colleague?” Customers answer on a scale from 0 to 10. You then group responses into promoters (9-10), passives (7-8), and detractors (0-6). NPS is a powerful customer experience kpi because it predicts growth and loyalty.
Companies with high NPS scores grow faster and enjoy stronger customer relationships.
NPS and Revenue Growth
- A 7% increase in NPS can lead to a 1% increase in revenue.
- A 10-point jump in NPS often results in a 3.2% rise in upsell revenue.
- Satisfied customers identified by NPS spend 140% more and refer others.
- Companies leading in NPS outgrow competitors by more than twice the rate.
- Research shows NPS explains up to 60% of the difference in organic growth rates between companies.
NPS does not just measure satisfaction; it shows how well you turn customers into advocates. Sobot’s analytics tools help you track NPS across all channels, so you can identify promoters and address detractors quickly.
Customer Effort Score (CES)
Customer Effort Score measures how easy it is for your customers to get help or solve a problem. You ask, “How easy was it to resolve your issue today?” Customers respond on a scale, usually from 1 (very difficult) to 7 (very easy). CES is a key customer experience kpi because customers want fast, simple solutions.
| CES Scale | Score Range | Interpretation | Typical Scores for High-Performing Teams |
|---|---|---|---|
| 1-7 scale | 1-2 | Very high effort (critical) | N/A |
| 1-7 scale | 3-4 | High effort (needs improvement) | N/A |
| 1-7 scale | 5-6 | Low effort (good) | High-performing teams consistently score above 6.0 |
| 1-7 scale | 7 | Very low effort (excellent) | Top-performing companies achieve 6.2+ |
| Average CES across industries | ~5.5 | Industry average | High-performing teams exceed this average |
Why Reducing Customer Effort Matters
- Simple, smooth experiences increase satisfaction and loyalty.
- Lower effort means fewer customers leave and more stay loyal.
- Companies that make things easy for customers see higher retention and more positive reviews.
- Harvard Business Review found that 88% of customers who had an easy experience plan to spend more.
- Reducing effort also lowers your operational costs and frees up resources.
Sobot’s AI-powered chatbots and unified workspace help you reduce customer effort by providing instant answers and seamless handoffs between channels. This leads to higher satisfaction and better retention.
First Contact Resolution
First contact resolution (FCR), sometimes called first call resolution, tracks the percentage of customer inquiries resolved during the first interaction. This customer experience kpi is critical because customers want quick solutions without having to follow up.
Leading organizations achieve FCR rates between 70% and 79%. Only about 5% of contact centers reach or exceed 80%, making that an exceptional benchmark.
Research shows that resolving issues on the first contact can prevent up to 67% of customer churn. Each extra contact needed to resolve a problem drops customer satisfaction by 15%. High FCR rates mean your team solves problems fast, which boosts satisfaction and loyalty.
How FCR Impacts Customer Experience and Costs
- High FCR reduces frustration and increases satisfaction.
- Fewer repeat contacts lower your call volumes and operational costs.
- Agents can focus on new inquiries, improving productivity.
- High FCR also improves employee morale and reduces burnout.
Sobot’s omnichannel solution and intelligent routing features help you achieve high first contact resolution by connecting customers to the right agent or resource the first time. For example, OPPO used Sobot’s chatbot and ticketing system to reach an 83% chatbot resolution rate, which led to a 94% positive feedback rate and a 57% increase in repurchase rate. This shows how strong FCR drives both satisfaction and customer retention.
Customer Retention Rate
Customer retention rate measures how many customers stay with your business over time. This kpi is vital for long-term growth because keeping existing customers costs less than finding new ones. High retention means your customers are satisfied and see value in your service.
| Industry | Average Customer Retention Rate |
|---|---|
| IT & Managed Services | 83% |
| Business Consulting | 85% |
| Telecom | 75% |
| Legal Services | 75% |
| Healthcare | 80% |
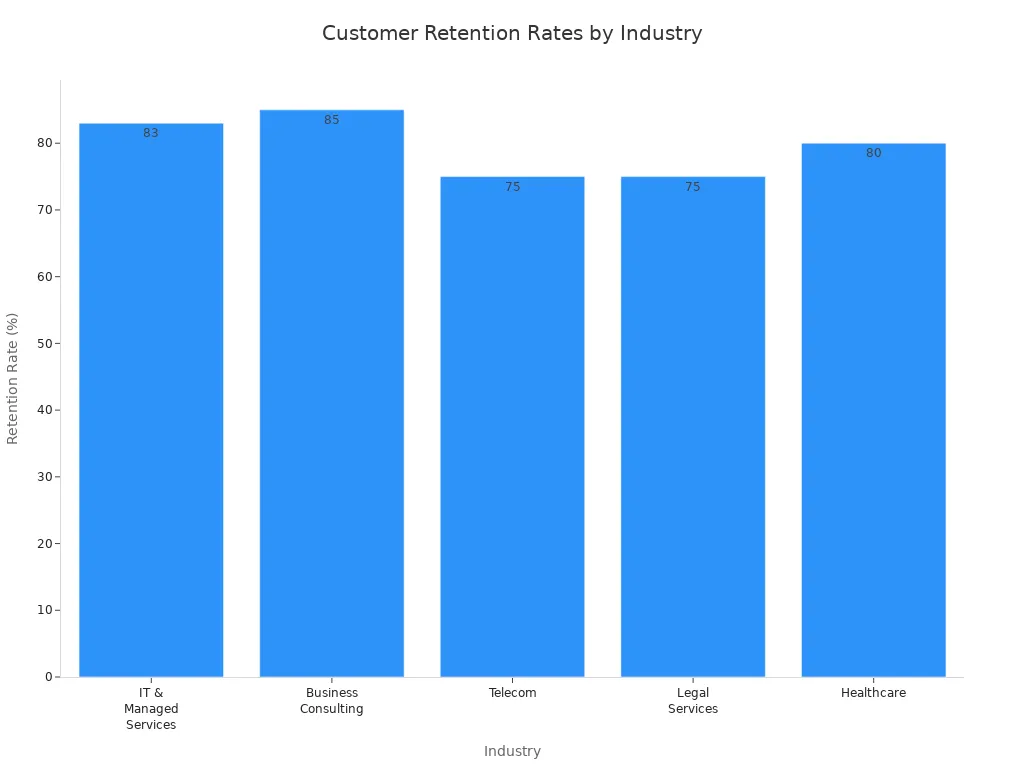
Most service industries see customer retention rates between 75% and 85%. You should aim for the higher end of this range to stay competitive.
How to Boost Customer Retention
- Deliver consistent, high-quality customer experiences across all channels.
- Use real-time customer feedback to identify and fix pain points.
- Offer self-service options and fast issue resolution to keep customers happy.
- Personalize interactions using unified customer data.
Sobot’s omnichannel platform helps you increase customer retention by unifying all customer interactions and data. The OPPO case study shows the impact: after adopting Sobot’s AI-driven chatbot and marketing solutions, OPPO saw a 57% increase in repurchase rate and an 83% chatbot resolution rate. Companies using omnichannel AI strategies retain an average of 89% of their customers, compared to only 33% for those with weaker strategies. This proves that seamless, personalized customer experiences drive loyalty and retention.
Tip: Focus on customer retention as a core customer experience kpi. Loyal customers spend more, refer others, and help your business grow.
Operational Customer Service Metrics


Operational customer service metrics help you measure the efficiency and quality of your support operations. By tracking these call center metrics, you can identify areas for improvement and deliver better experiences to your customers. Sobot’s Voice/Call Center and automation features make it easy to monitor and optimize these key metrics.
Average Response Time
Average response time, also known as first response time, measures how quickly your team replies to customer inquiries. Fast responses show customers you value their time. Industry standards vary by channel:
| Customer Service Channel | Industry Standard Average Response Time | Customer Expectation / Notes |
|---|---|---|
| Live Chat | Under 30 seconds | Customers expect responses within seconds during live chat sessions. |
| Phone Support | Around 2 minutes | Acceptable wait time; under 2 minutes in urgent sectors like healthcare and finance. |
| Within 1 hour (general), 1-2 hours (best-in-class) | 89% expect response within 1 hour; leading companies respond within 1-2 hours. | |
| Social Media (Twitter) | Within 1 hour | 78% of customers expect a response within 1 hour. |
| Social Media (Facebook) | Within 4 hours | Customers anticipate replies within 4 hours. |
Reducing average speed of answer and first response time increases customer satisfaction and builds trust. Sobot’s unified workspace and real-time alerts help your team respond faster across all channels.
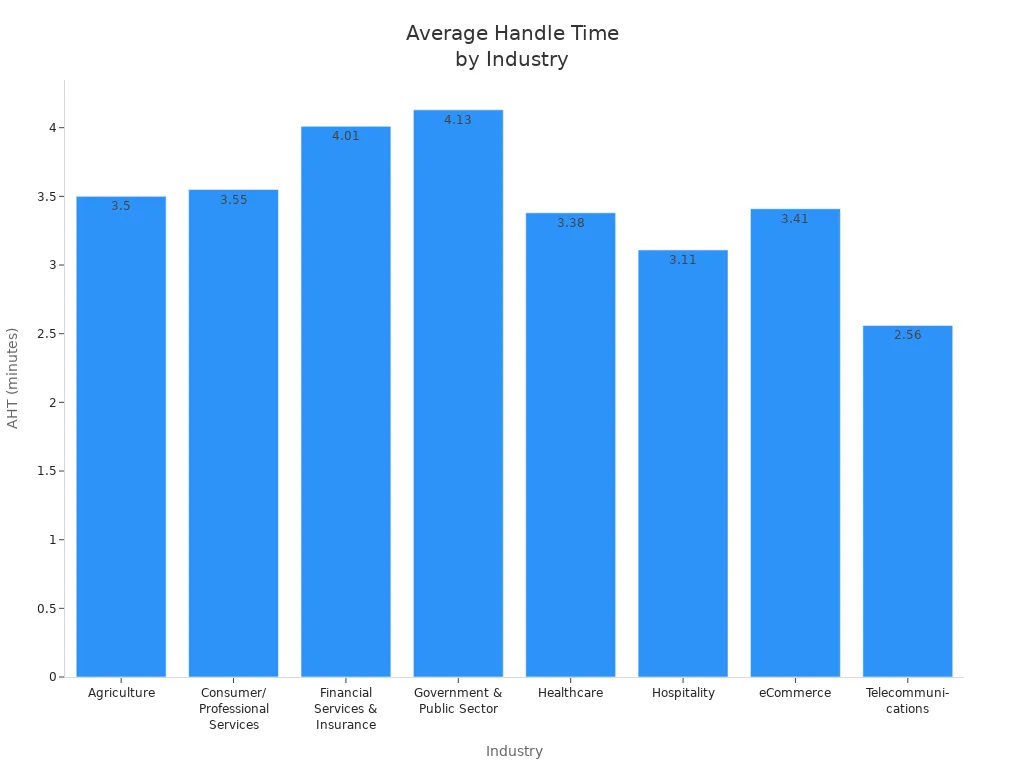
Average Handle Time (AHT)
Average handle time is a core call center metric that tracks how long it takes to resolve a customer issue from start to finish. The industry benchmark for AHT is about 6 minutes, but it varies by sector.
| Industry | Average Handle Time (minutes) |
|---|---|
| Retail | 3–4 |
| Banking and Financial | 4–6 |
| Telecommunications | 5–7 |
| Technical Support | 8–10 |
Sobot’s automation features, like AI-powered agent assistance and intelligent IVR, reduce average handle time by streamlining workflows and providing instant access to customer data.
Ticket Volume
Ticket volume shows the total number of support requests your team handles. High ticket volume can signal product issues or increased customer demand. Tracking this call center metric helps you allocate resources and maintain service quality.
- Monitoring ticket volume by channel helps you optimize staffing.
- Automation and prioritization features in Sobot’s platform help manage large volumes efficiently.
- Comparing tickets opened versus resolved helps you spot backlogs and adjust your strategy.
Abandonment Rate
Abandonment rate measures how many customers leave before getting help. The industry standard for call abandonment is 2% to 5%. High abandonment rates often mean long wait times or poor call routing.
Sobot’s average speed of answer and callback features reduce abandonment by connecting customers quickly or offering to call them back. Well-designed self-service options also lower abandonment rates by resolving simple issues instantly.
Self-Service Usage Rate
Self-service usage rate tracks how many customers solve issues without agent help. High-performing organizations deflect up to 70% of routine tickets with AI-powered self-service. Sobot’s chatbots and knowledge base empower customers to find answers fast, reducing ticket volume and average resolution time.
Companies that increase self-service usage see a 45% boost in customer satisfaction and up to 40% lower support costs.
Tracking these customer service metrics with Sobot’s Voice/Call Center gives you the insights needed to improve first response time, average resolution time, and overall customer experience.
Team Performance Indicators
Tracking team performance is essential for modern customer service teams. You need to measure the right customer service performance indicators to ensure your team delivers high-quality support and drives customer satisfaction. Sobot’s unified workspace and analytics make it easy to monitor these customer service kpis and improve both agent and customer experience.
Agent Productivity
Agent productivity measures how efficiently your team handles customer interactions. You can track several kpis to get a clear picture:
| Metric | Description | Indicator of Productivity |
|---|---|---|
| Post-Call Work Time | Time spent on follow-up tasks after a call | Shorter times suggest higher productivity |
| Occupancy Rate | Time spent on customer contacts vs. idle time | High rates mean less wasted time |
| First Call Resolution | Issues solved on first contact | High rates show effective agents |
| Average Handle Time | Total time per customer interaction | Shorter times, if quality is maintained |
| Customer Satisfaction | Ratings after each interaction | High scores reflect productive agents |
You can use Sobot’s analytics to track these metrics in real time. This helps you spot trends and coach agents for better results.
Agent Utilization Rate
Agent utilization rate shows how much time your agents spend helping customers. High-performing teams keep this rate between 70% and 90%. If the rate is too low, agents are underused. If it goes above 90%, you risk burnout and lower quality. Sobot’s workforce management tools help you balance workloads and maintain high customer experience standards.
| Utilization Rate | Performance Level |
|---|---|
| Below 70% | Underutilized |
| 70-80% | Good |
| 80-90% | Excellent |
| Above 90% | Burnout Risk |
Quality Assurance Score
Quality assurance (QA) scores measure how well agents follow best practices and deliver consistent service. Most customer service teams aim for QA scores between 75% and 90%. Regular call reviews help you maintain high quality and improve customer satisfaction. Sobot’s QA analytics let you review interactions and give targeted feedback to agents.
Training Completion Rate
Training completion rate tracks how many agents finish required training. High rates mean your team is ready to handle customer needs. Well-trained agents resolve more issues on the first contact, reduce repeat calls, and improve overall customer service performance indicators. Sobot’s platform makes it easy to assign, track, and report on training progress.
Employee Satisfaction Score (ESAT)
Employee Satisfaction Score (ESAT) measures how happy your team feels at work. Scores above 80% are excellent. High ESAT leads to better agent performance, lower turnover, and higher customer satisfaction. Sobot’s unified workspace supports agent well-being by reducing repetitive tasks and providing clear goals. Happy agents deliver better customer experience and higher quality service.
Tip: Regularly review these customer service performance indicators to keep your team motivated and your customer service kpis on track. With Sobot, you can easily monitor, analyze, and act on these kpis to drive quality and satisfaction for both your team and your customers.
Best Practices for Customer Service KPIs
Aligning KPIs with Business Goals
To get the most value from customer service kpis, you need to align them with your company’s main goals. Start by choosing kpis that match your business strategy, such as Net Promoter Score, Customer Satisfaction Score, or Customer Lifetime Value. These kpis help you see how your support kpis connect to growth and retention.
- Break down silos between sales, marketing, and support teams so everyone works toward the same kpis.
- Align incentives and goals at every level, from agents to managers, to keep everyone focused on customer service kpis.
- Share insights from kpis across departments to help everyone understand customer needs.
- Keep a consistent brand voice in support by using a style guide for tone and communication.
- Track customer feedback often and adjust your kpis as your business changes.
When you connect customer service kpis to your business goals, you create a clear path to success.
Leveraging Sobot Technology
Sobot’s technology makes it easier to track and improve customer service kpis. With AI, Sobot can manage up to 95% of customer interactions, which reduces response and resolution times. This automation leads to a 25% increase in customer satisfaction and helps you reach your kpis faster.
- Automated QA systems in Sobot give real-time feedback to agents, improving performance and compliance with support kpis.
- Companies using Sobot report up to a 68% reduction in staffing needs during busy seasons, which saves money and keeps service levels high.
- Emotion AI and Sentiment Analysis in Sobot help you deliver more personal and empathetic service, boosting loyalty and retention.
- Sobot’s analytics dashboard lets you monitor all your customer service kpis in one place, making it easy to spot trends and act quickly.
By using Sobot, you can improve first response time, agent productivity, and customer satisfaction—all key kpis for modern teams.
Continuous Improvement
Continuous improvement is one of the best practices for achieving customer service kpis. You should review your kpis regularly to make sure they still fit your customers’ needs. Analyze trends in your kpi data to find new ways to improve support kpis and service quality.
- Set up a quality assurance program to monitor agent performance and give feedback, which boosts kpis like CSAT and First Contact Resolution.
- Encourage feedback and teamwork to keep improving your processes and motivate your team.
- Invest in ongoing training to help agents handle more issues on the first try, improving kpis like Average Handle Time.
- Use technology like Sobot’s real-time analytics and omni-channel tools to support agents and optimize operations.
- Make strategic changes based on data to keep your customer service kpis moving in the right direction.
Tip: Use customer service kpis as a guide for continuous improvement. When you track, analyze, and act on these kpis, you build a stronger, more responsive support team.
You drive customer experience by tracking these 15 KPIs. When you focus on customer experience, you see higher satisfaction and loyalty. Sobot’s omnichannel platform gives you real-time insights, helping you improve customer experience at every touchpoint. Teams using Sobot report a 25% increase in satisfaction and a 57% boost in customer experience retention. Start integrating KPI tracking into your daily workflow. You will see measurable gains in customer experience, satisfaction, and business results.
FAQ
What are the most important customer service performance indicators for modern teams?
You should focus on customer satisfaction score, first contact resolution, average response time, and customer retention. These key performance indicators help you measure quality, efficiency, and customer experience. Sobot’s analytics dashboard tracks these customer service metrics in real time for better decision-making.
How can I improve first response time and average resolution time?
You can use automation, unified workspaces, and AI-powered chatbots to reduce first response time and average resolution time. Sobot’s omnichannel platform helps you respond faster and resolve issues quickly, which boosts customer satisfaction and retention.
Why is customer feedback essential for customer service kpis?
Customer feedback gives you direct insight into satisfaction and service quality. You can use this data to improve support kpis like first call resolution and issue resolution rate. Sobot collects feedback across all channels, helping you spot trends and act fast.
How does Sobot help increase customer retention and satisfaction?
Sobot unifies customer data and automates workflows, making it easy to deliver seamless experiences. Companies using Sobot report a 25% increase in customer satisfaction and a 57% boost in retention. You can read more about these results in the OPPO customer story.
What are best practices for achieving customer service kpis?
You should align kpis with business goals, leverage technology like Sobot, and review metrics regularly. Focus on continuous improvement, agent training, and using customer feedback to refine your approach. These best practices for achieving customer service kpis drive long-term success.
See Also
The Best Customer Service Software Solutions For 2024
Effective Ways To Improve Call Center Performance Using Monitoring
Proven Best Practices For Managing Call Center Quality
