Customer Churn Rate Formula and Practical Examples

You can calculate customer churn rate using this formula:
Churn Rate = (Number of customers lost during a period ÷ Total customers at the start of the period) × 100%.
This churn rate formula helps you understand how many customers leave your business over time. Losing customers has a big impact. For example:
- 52% of customers switch to a competitor after just one negative experience.
- Acquiring a new customer can cost up to 25 times more than keeping an existing one.
- Companies focusing on customer experience see profits 60% higher than others.
Tracking your churn rate lets you spot problems and take action. With Sobot’s all-in-one contact center solutions, you can measure, analyze, and drive customer churn reduction using accurate data and smart tools.
Customer Churn Rate Basics
What Is Customer Churn?
You experience customer churn when people stop using your products or services during a set period. The customer churn rate tells you how many customers leave compared to the total you had at the start. For example, if you start the month with 100 customers and lose 10, your churn rate is 10%. You can measure customer churn monthly, quarterly, or yearly, depending on your business. Different industries use different time frames based on how often customers buy or use services. Companies often look at customer demographics, purchase patterns, and reasons for leaving to understand customer attrition. Predictive models can help you spot customers at risk of leaving, so you can act early to improve customer retention.
Why Churn Rate Matters
Tracking churn rate helps you see how well you keep customers and where you might lose them. High customer churn can hurt your business. For example, Netflix lost 4% of U.S. subscribers, which meant $8 million in lost revenue each month. Blue Apron saw its customer lifetime value drop from 26 to 6 months, leading to a $210 million net loss and a 50% drop in stock price. These numbers show that customer attrition can damage both revenue and company value. Different industries have different average churn rates:
| Industry | Average Customer Churn Rate |
|---|---|
| All Industries (average) | 4% |
| Digital Media and Entertainment | 6.9% |
| Software | 3.5% |
You should compare your churn rate to your industry’s average. This helps you spot problems and set goals for customer retention. Breaking down churn by region, product, or customer group lets you focus on the areas that need the most attention.
Sobot’s Role in Customer Retention
You can use Sobot’s all-in-one contact center to improve customer retention and reduce churn rate. Sobot helps you track customer churn rate with real-time analytics and unified data. Many companies, such as OPPO and J&T Express, have seen big gains in customer loyalty and customer experience by using Sobot. For example, OPPO reached a 93% customer satisfaction score, while J&T Express increased its sign-off rate by 35%. Sobot’s platform supports fast responses, personalized service, and better customer engagement. The chart below shows how Sobot boosts customer retention and satisfaction:
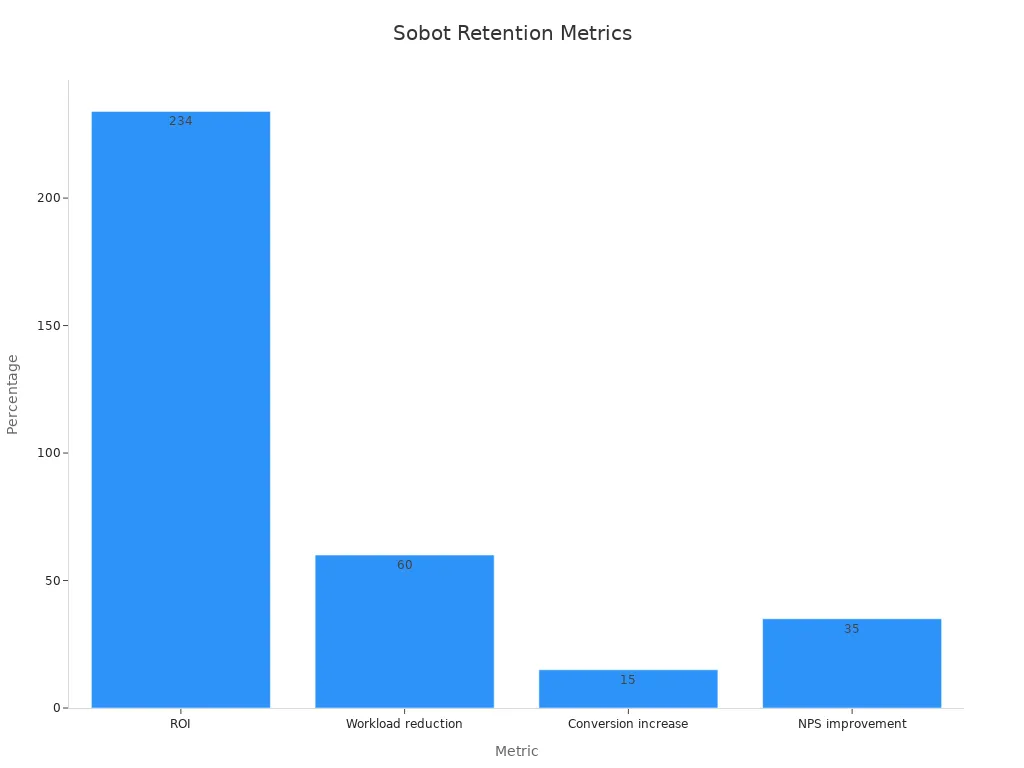
Sobot’s tools help you understand customer churn, improve your customer retention rate, and build stronger customer loyalty.
Calculate Customer Churn Rate
Churn Rate Formula
You can calculate customer churn rate using a simple formula. The churn rate formula looks like this:
Churn Rate = (Number of customers lost during a period ÷ Total customers at the start of the period) × 100%
This formula helps you see what percentage of your customers leave during a set time. For example, if you start with 200 users and lose 30 in a month, your monthly churn rate is 15%. If you begin with 3,000 customers and lose 150, your churn rate is 5%. You can use this formula to track customer churn every month, quarter, or year. Many businesses use the monthly churn rate to spot trends quickly.
Tip: Always use the number of customers at the start of the period for the most accurate churn rate calculation.
Key Variables
Several key variables affect how you calculate customer churn rate. These variables help you understand why customers leave and how to improve retention.
| Variable | Description |
|---|---|
| Customers at Start | The total number of customers at the beginning of the period |
| Customers Lost | The number of customers who left during the period |
| Tenure | How long a customer has stayed with your business |
| Contract Type | Whether customers have month-to-month or long-term contracts |
| Monthly Charges | The amount customers pay each month |
| Customer Contacts | The number of times customers reach out for support |
| Product Usage | How often customers use your product or service |
You can see that contract type, tenure, and monthly charges often have the biggest impact on customer churn. For example, customers with month-to-month contracts or shorter tenure are more likely to leave. Sobot’s analytics tools let you track these variables in real time, so you can spot risks early.
Calculating Customer Churn Rate: Step-by-Step
You can follow these steps to calculate customer churn rate and use the results to improve your business:

- Collect Data: Start by gathering the number of customers at the beginning of the period and the number lost during that period. Sobot’s Voice/Call Center makes this easy by tracking all customer interactions and account statuses.
- Apply the Formula: Use the churn rate formula. For example, if you had 5,000 customers at the start of August and lost 150, your churn rate is (150 ÷ 5,000) × 100 = 3%.
- Analyze Trends: Look at your churn rate over several months. If your monthly churn rate rises, you may need to improve customer service or product quality.
- Segment Your Data: Break down churn by customer group, region, or product. Sobot’s analytics dashboard lets you filter and compare these segments.
- Use Advanced Analytics: Sobot’s platform provides tools like session replays, conversation analytics, and customer journey mapping. These features help you find patterns in customer churn and identify at-risk customers.
- Take Action: When you spot a high churn rate, use Sobot’s unified workspace to reach out to customers, solve problems, and improve satisfaction.
- You can also use predictive modeling to find customers who might leave soon. Sobot’s analytics combine operational data (like declining purchases) and experience data (like Net Promoter Score) to help you act fast.
- Closed-loop follow-up processes let you respond to churn risks right away, keeping more customers loyal to your brand.
Note: Calculating customer churn rate regularly helps you make better decisions and keep your business growing.
Interpreting Customer Churn Rate
High vs. Low Churn
You can learn a lot by looking at different levels of customer churn. A low churn rate shows that your customers feel loyal and satisfied. This means your service or product meets their needs. When you see a high churn rate, you may have problems with pricing, product quality, or customer experience. For example, a subscription business with a 20% churn rate will lose a big part of its recurring revenue. If you track churn rate by product or region, you can find weak spots and fix them. Over time, you can use cohort analysis to see how changes in your service affect customer retention and customer lifetime value. Lowering your churn rate helps you keep more customers, which leads to higher profits and stronger relationships. You can also use churn prediction tools to spot customers who might leave soon.
Industry Benchmarks
Comparing your customer churn rate to industry benchmarks helps you see if you are ahead or behind. Here are some average churn rates by industry:
| Industry / Sector | Average Churn Rate (%) |
|---|---|
| SaaS (good target) | 3-5 |
| Subscription Services | 6-8 |
| Media & Entertainment | 5.23 |
| Consumer Packaged Goods | 40 |
| Wholesale | 56 |
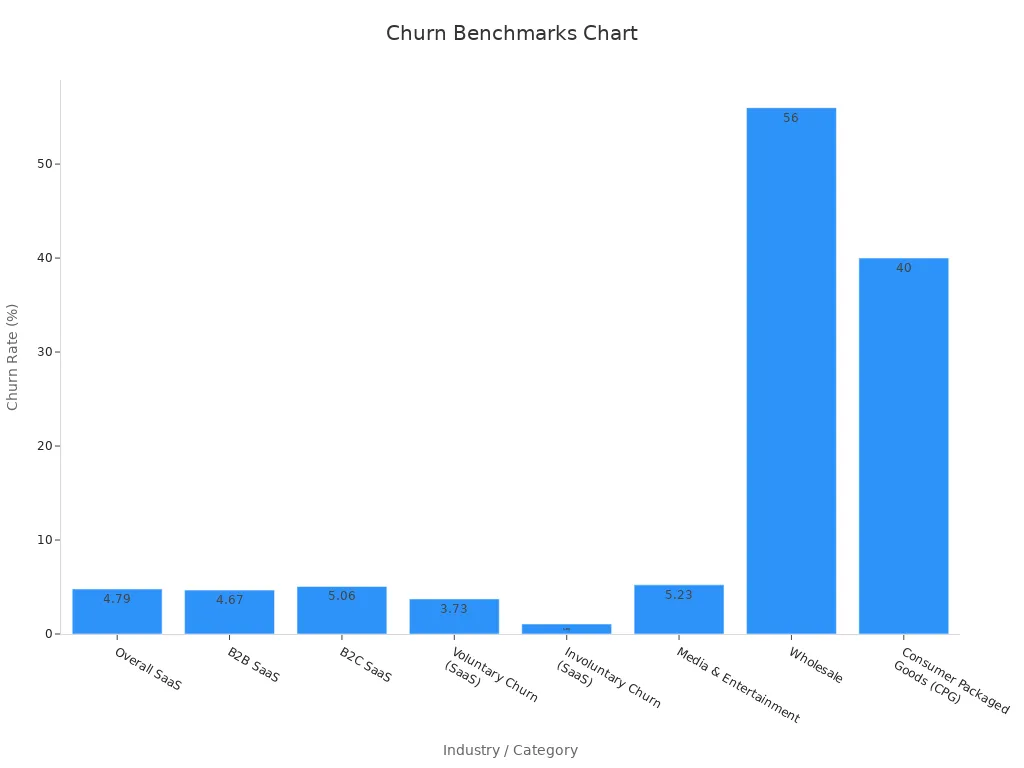
If your churn rate is higher than the average for your industry, you may need to improve your customer experience or review your pricing. For example, SaaS companies often aim for an annual churn rate below 5%. In contrast, wholesale and consumer packaged goods see much higher churn due to trends and pricing changes. You should always compare your numbers to the right industry group.
Insights for Customer Service Teams
You can use customer churn data to make your service better. Here are some ways to turn churn insights into action:
- Analyze feedback and customer data to find out why people leave.
- Use churn prediction and analytics tools, like those in Sobot’s platform, to identify at-risk customers.
- Improve onboarding and communication to boost customer experience.
- Personalize support and respond quickly to issues.
- Work with other teams to create strong retention strategies.
Tip: Personalizing customer experiences and acting on feedback can increase customer lifetime value and reduce churn. For example, 97% of customers stay loyal if you solve their problems quickly.
Customer Churn Rate vs. Revenue Churn
Key Differences
You need to understand the difference between customer churn rate and revenue churn. Customer churn rate tells you the percentage of customers who leave your business during a period. Revenue churn shows the percentage of revenue lost from those customers. These two metrics can give you very different pictures of your business health.
- Customer churn rate focuses on the number of customers lost.
- Revenue churn measures the financial impact of those losses.
- Losing many low-paying customers can cause a high customer churn rate but a low revenue churn.
- Losing one high-paying customer can cause a low customer churn rate but a high revenue churn.
For example, if you lose 10 customers who each pay $1 per month, your customer churn rate is 10%, but your revenue churn is only 1%. If you lose one customer who pays $100 per month, your customer churn rate is 1%, but your revenue churn jumps to 10%.
| Scenario | Number of Customers Lost | Customer Churn Rate | Revenue Lost | Revenue Churn Rate |
|---|---|---|---|---|
| Lose 10 customers paying $1/month each | 10 | 10% | $10 | 1% |
| Lose 1 customer paying $100/month | 1 | 1% | $100 | 10% |
Formulas Compared
You can calculate these two metrics using different formulas:
- Customer churn rate = (Number of customers lost ÷ Total customers at start) × 100
- Revenue churn rate = (Revenue lost ÷ Total recurring revenue at start) × 100
Let’s look at a real-world example. Imagine you start the month with $50,000 in monthly recurring revenue (MRR) and lose $7,000 from cancellations. Your gross revenue churn rate is 14%. If you gain $5,000 from upsells, your net revenue churn rate drops to 4%. This shows that revenue churn captures the financial impact, not just the number of customers lost.
Net revenue churn = ((Revenue lost – Expansion revenue) ÷ Total revenue at start) × 100
Sobot Use Cases
Sobot’s analytics help you track both customer churn rate and revenue churn. You can use Sobot’s Voice/Call Center to monitor customer departures and lost revenue in real time. The unified dashboard lets you segment churn by customer value, region, or product. For example, if you see a spike in revenue churn, you can quickly identify which high-value customers left and take action. Sobot’s marketing solution also helps you re-engage at-risk customers with targeted offers, reducing both churn rate and revenue loss.
Customer Churn Reduction Strategies
Identifying Churn Causes
You can only achieve customer churn reduction if you know why customers leave. Start by defining what churn means for your business. Some customers cancel their accounts, while others stop using your service. You need to collect and clean customer data, including interactions, engagement, transactions, and customer feedback. This helps you find patterns and spot the main drivers of churn.
Follow these steps to identify the causes of customer churn:
- Define churn clearly for your business, such as cancellations or inactivity.
- Gather and organize customer data from all touchpoints.
- Segment your customers by tenure, behavior, and pricing tier.
- Watch for early warning signs like fewer logins or more complaints.
- Use analytics tools like cohort analysis and journey mapping to find trends.
- Take action with personalized outreach and loyalty programs.
- Track your results and adjust your customer retention strategies as needed.
You can also look at key behavioral indicators to predict churn. The table below shows what to watch for:
| Behavioral Indicator | Description | Implication for Churn Prediction |
|---|---|---|
| Declining Engagement | Less frequent logins or shorter sessions | Higher risk of churn |
| Limited Product Adoption | Customers use only basic features | Possible dissatisfaction |
| Support Ticket Patterns | More unresolved or basic support requests | Frustration may lead to churn |
| Negative Feedback | Low NPS or bad reviews | Direct sign of churn risk |
| Contract-Related Behaviors | Requests for shorter terms or cancellations | Early sign of intent to leave |
You can use these insights to reduce churn rate and improve customer loyalty.
Sobot Solutions for Churn Reduction
Sobot gives you powerful tools to reduce churn rate and boost customer retention. You can use the Voice/Call Center to track every customer interaction. The unified workspace lets you see all support tickets, call logs, and chat messages in one place. This helps you spot unhappy customers early and respond quickly.
Here are some actionable tips for customer churn reduction using Sobot’s solutions:
- Set up smart call routing and IVR to connect customers with the right agent fast. This reduces waiting times by up to 35%.
- Use AI-powered analytics to monitor engagement and spot at-risk customers. Sobot’s system improves customer experience for over 60% of clients.
- Launch targeted marketing campaigns with Sobot’s marketing solution. You can send personalized offers to re-engage customers and reduce customer churn.
- Track customer feedback and support tickets in real time. This helps you fix problems before customers decide to leave.
- Segment your customers by value, region, or behavior. Focus your efforts on high-value groups to maximize customer churn reduction.
- Use journey mapping to see where customers drop off and improve those touchpoints.
Sobot’s platform also increases interactive marketing touchpoints by 40%, making it easier to keep customers engaged. You can use these features to reduce churn rate and build stronger customer loyalty.
Tip: Regularly review your churn data and customer feedback. Small changes in your support process or marketing can lead to big gains in customer retention.
Real-World Example: Opay
Opay shows how you can achieve customer churn reduction with the right tools. Opay used Sobot’s omnichannel platform to manage customer service across voice, email, and social media. The company also used WhatsApp for targeted marketing.
After switching to Sobot, Opay increased customer satisfaction from 60% to 90%. The company reduced costs by 20% and saw a 17% rise in conversion rates. Opay’s team handled more inquiries, solved problems faster, and kept more customers loyal. The WhatsApp integration led to an 85% message reading rate, helping Opay reduce churn rate and improve customer retention.
You can read more about Opay’s success with Sobot here.
Monitoring customer churn rate drives business growth and protects profits. Even a 5% increase in retention can boost profits by up to 95%. You can see that 66% of consumers leave after poor service, so tracking customer churn rate and acting fast is vital. Sobot’s all-in-one solutions help you spot at-risk customers, improve experiences, and build loyalty. Use these strategies to keep more customers and grow your business.
Small changes in retention lead to big gains. Retaining customers costs less and delivers long-term value.
FAQ
What is a good customer churn rate for most businesses?
A good customer churn rate depends on your industry. For SaaS, aim for under 5% yearly. Retail and consumer goods often see higher rates. You should compare your customer churn rate to industry averages to set realistic goals.
How often should you calculate customer churn rate?
You should calculate customer churn rate every month. Monthly tracking helps you spot trends and act quickly. Sobot’s analytics dashboard lets you monitor your customer churn rate in real time for better decision-making.
Can Sobot help reduce customer churn rate?
Yes! Sobot’s all-in-one contact center helps you track, analyze, and reduce customer churn rate. You can use features like smart call routing, unified workspaces, and targeted marketing to keep more customers loyal.
What are the main causes of a high customer churn rate?
Common causes include poor service, high prices, or lack of product value. For example, 66% of customers leave after a bad experience. Sobot’s tools help you find these issues and improve your customer churn rate.
Why does customer churn rate matter for business growth?
A high customer churn rate means you lose revenue and spend more on finding new customers. Even a 5% increase in retention can boost profits by up to 95%. Sobot helps you lower your customer churn rate and grow your business.
See Also
Top Strategies To Enhance Customer Satisfaction Through Live Chat
How To Excel At Live Chat Support In Retail
Effective Techniques For Managing Live Chat Support Teams
