CSAT vs NPS vs CES Key Metrics for Customer Experience

Customer satisfaction metrics like CSAT, NPS, and CES are essential for shaping your customer experience strategy. The CSAT customer satisfaction score evaluates satisfaction at specific touchpoints, NPS measures loyalty through net promoter score calculations, and CES assesses effort using customer effort score surveys. These metrics provide valuable insights to identify pain points, boost customer retention, and elevate overall brand perception.
Research shows that customers with high effort scores are four times more likely to churn. By leveraging these metrics, businesses can gain a deeper understanding of the customer journey and satisfaction, leading to improved outcomes. Sobot’s Voice/Call Center simplifies the process of gathering CSAT customer satisfaction scores, enabling you to effectively measure customer feedback and implement actionable strategies to enhance satisfaction.
What Are CSAT, NPS, and CES?

CSAT: Customer Satisfaction Score Explained
CSAT, or Customer Satisfaction Score, measures how satisfied customers are with a specific interaction or experience. It is one of the most straightforward customer satisfaction metrics, often collected through a survey asking, “How satisfied were you with your experience?” Customers rate their satisfaction on a scale, typically from 1 to 5 or 1 to 10.
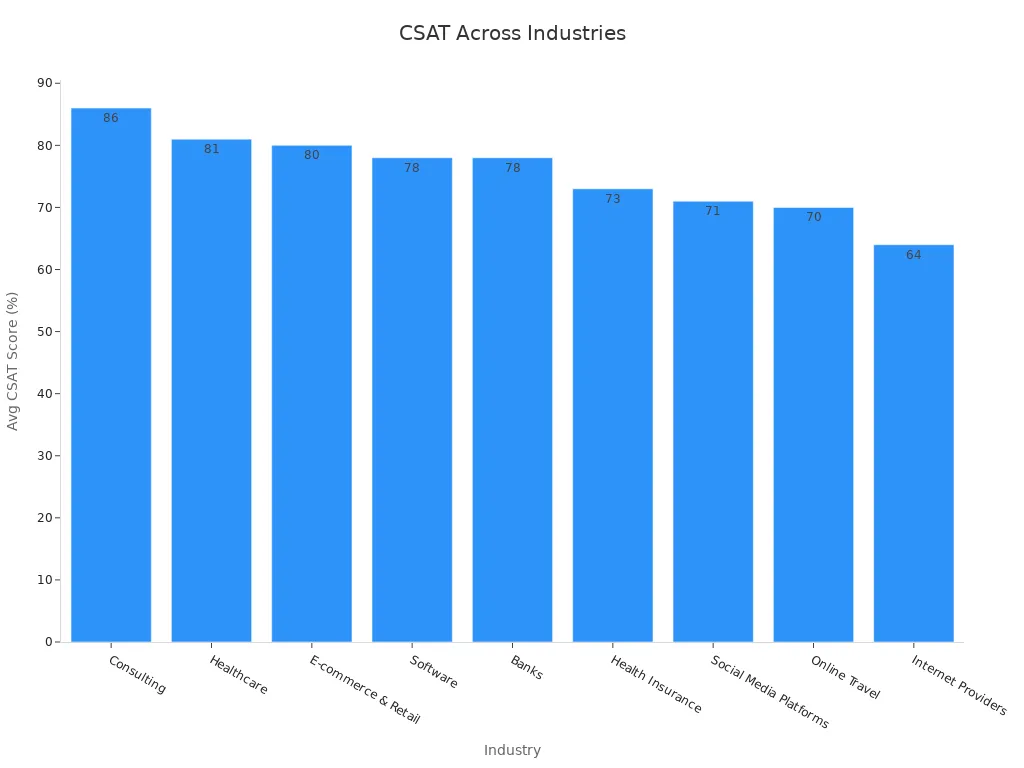
This metric provides immediate insights into customer sentiment, helping you identify pain points in the customer journey. For example, deploying a CSAT survey after a purchase or service interaction allows you to capture timely customer feedback. Industries like consulting and healthcare often achieve high CSAT scores, with averages of 86% and 81%, respectively.
| Industry | Average CSAT Score |
|---|---|
| Consulting | 86% |
| Healthcare | 81% |
| E-commerce & Retail | 80% |
| Software | 78% |
| Banks | 78% |
CSAT surveys are simple to design and interpret, making them a practical tool for benchmarking satisfaction and tracking trends over time.
NPS: Understanding Net Promoter Score
NPS, or Net Promoter Score, evaluates customer loyalty by asking a single question: “How likely are you to recommend our product or service to others?” Customers respond on a scale from 0 to 10, with scores grouped into three categories: Promoters (9-10), Passives (7-8), and Detractors (0-6).
This metric focuses on long-term customer loyalty and advocacy. While NPS is widely used, research suggests it should not be the sole predictor of growth. Combining NPS with other customer experience metrics provides a more comprehensive view of customer loyalty behaviors.
NPS surveys help you understand whether customers are likely to become brand advocates. For instance, a high NPS score indicates strong customer loyalty, which can drive referrals and repeat business. However, relying solely on NPS may overlook other factors influencing customer satisfaction.
CES: Customer Effort Score Overview
CES, or Customer Effort Score, measures how much effort customers expend to resolve issues or complete tasks. This metric highlights areas where high effort negatively impacts satisfaction. A CES survey typically asks, “How easy was it to resolve your issue?” Customers rate their experience on a scale, with lower scores indicating less effort.
CES is particularly useful for identifying pain points in processes like onboarding or returns. For example, a major retailer improved customer satisfaction by streamlining its returns process based on CES insights. Similarly, a SaaS company enhanced user retention by simplifying onboarding, reducing customer effort.
- CES helps assess satisfaction with specific interactions.
- NPS evaluates long-term loyalty and brand ambassadorship.
- CSAT gauges immediate sentiment at specific touchpoints.
By understanding CES, you can focus on reducing effort in critical areas, improving customer retention and overall satisfaction.
Key Differences Between CSAT, NPS, and CES
Purpose and Focus of Each Metric
Each customer experience metric serves a distinct purpose and focuses on different aspects of customer interactions. CSAT measures satisfaction at specific touchpoints, such as after a purchase or service interaction. It provides instant feedback, helping you identify pain points in the customer journey. For example, a CSAT survey after a support call can reveal whether the resolution met customer expectations.
NPS, on the other hand, tracks long-term customer loyalty and advocacy. It evaluates whether customers are likely to recommend your brand to others, offering insights into overall satisfaction and loyalty. This metric is widely used in B2B industries, where customer relationships often span years.
CES focuses on the ease of customer interactions. It highlights areas where reducing effort can improve satisfaction and retention. For instance, simplifying your returns process or onboarding experience can lower effort scores and boost customer loyalty.
| Metric | Purpose | Focus |
|---|---|---|
| CSAT | Measures satisfaction after specific touchpoints | Instant feedback on interactions |
| NPS | Tracks long-term loyalty | Overall customer satisfaction |
| CES | Assesses ease of customer experience | Customer effort in interactions |
Timing and Application of Surveys
The timing of surveys plays a crucial role in capturing accurate customer feedback. CSAT surveys are best sent immediately after key touchpoints, such as a support conversation, sales demo, or in-store purchase. For web apps, you can send CSAT surveys after onboarding and repeat them quarterly to track trends.
NPS surveys are typically sent via email within a week of a significant event, such as product delivery or service completion. Brick-and-mortar stores often use physical machines for immediate feedback. This timing ensures you capture customer loyalty insights when the experience is fresh in their minds.
CES surveys are most effective when applied to processes that require effort, such as resolving issues or completing transactions. For example, sending a CES survey after a customer navigates your returns process can reveal whether the experience was seamless or frustrating.
- CSAT: Immediate follow-ups after touchpoints like purchases or support calls.
- NPS: Email surveys within a week of delivery or service completion.
- CES: Post-interaction surveys for effort-heavy processes like onboarding or returns.
Question Format and Scoring Systems
The format and scoring systems of these metrics differ significantly, shaping how you interpret customer feedback. CSAT surveys ask straightforward questions like, “How satisfied were you with your experience?” Customers rate their satisfaction on a scale, typically from 1 to 5 or 1 to 10. The score is calculated by dividing the number of satisfied customers by the total number of respondents.
NPS surveys use a single question: “How likely are you to recommend our product or service to others?” Responses range from 0 to 10, with scores grouped into Promoters (9-10), Passives (7-8), and Detractors (0-6). The net promoter score is calculated by subtracting the percentage of Detractors from Promoters.
CES surveys focus on effort, asking questions like, “How easy was it to resolve your issue?” Customers rate their experience on a scale, with lower scores indicating less effort. This metric helps you pinpoint areas where reducing effort can enhance satisfaction.
| Metric | Description |
|---|---|
| Customer Satisfaction Score (CSAT) | Measures customer happiness through a rating scale, calculated by dividing happy customers by total customers. |
| Customer Effort Score (CES) | Assesses the ease of using products/services, aimed at reducing effort and increasing loyalty. |
| Net Promoter Score (NPS) | Indicates customer satisfaction and loyalty, and likelihood of recommending the brand to others. |
By understanding these formats, you can tailor surveys to your goals and gain actionable insights into customer satisfaction, loyalty, and effort.
Actionability and Insights for Businesses
Understanding customer feedback is only the first step. The real value lies in transforming this data into actionable insights that drive meaningful change. CSAT, NPS, and CES surveys provide businesses with the tools to identify pain points, improve processes, and enhance customer satisfaction. Here’s how you can leverage these metrics effectively:
Turning Data into Action
CSAT surveys offer immediate feedback on specific interactions, helping you pinpoint areas that need improvement. For example, if your CSAT score drops after support calls, it signals a need to refine your resolution process. Similarly, CES surveys highlight friction points in customer journeys, such as complex onboarding or returns processes. By addressing these issues, you can reduce customer effort and boost retention.
NPS surveys, on the other hand, reveal long-term customer loyalty trends. A high net promoter score indicates strong advocacy, while a low score suggests dissatisfaction. Businesses can use this data to identify loyal customers and engage them further, while also addressing detractors' concerns to prevent churn.
Real-World Examples
ClearlyRated demonstrates how analytics can transform customer feedback into actionable insights. Their reports help businesses identify problem areas and opportunities, enabling teams to make informed decisions. For instance, a community bank replaced assumptions with data-driven strategies by measuring customer experience. They identified strengths and weaknesses, monitored perception gaps, and prioritized actions to enhance engagement and allocate budgets effectively.
AccessPay provides another compelling example. By focusing on customer experience metrics like NPS, they increased their score from 15 to 50 in just two years. Daily reviews of customer feedback allowed them to understand the reasons behind their scores and implement targeted improvements.
Leveraging Sobot’s Solutions
Sobot’s Voice/Call Center simplifies the process of gathering CSAT scores through intelligent IVR and real-time monitoring. Its AI-powered tools help businesses analyze CES data to reduce customer effort, while omnichannel solutions enhance NPS by providing seamless communication across platforms. For example, Samsung achieved a 97% customer satisfaction rate and a 30% increase in agent efficiency by using Sobot’s integrated contact center solutions.
Key Takeaways
- Use CSAT surveys to identify immediate pain points and track satisfaction trends.
- Apply CES insights to streamline processes and reduce customer effort.
- Leverage NPS data to strengthen customer loyalty and advocacy.
- Integrate tools like Sobot’s Voice/Call Center to automate surveys and analyze feedback efficiently.
By focusing on actionable insights, you can transform customer experience metrics into strategies that drive growth and satisfaction.
Use Cases for CSAT, NPS, and CES
When to Use CSAT for Customer Satisfaction
CSAT is ideal for measuring customer satisfaction at specific milestones in the customer journey. For example, you can deploy a CSAT survey immediately after a purchase, a support interaction, or a product delivery. This approach captures real-time customer feedback, helping you identify areas that need improvement.
Key moments to implement CSAT include:
- After completing a sales transaction.
- Following a customer service interaction.
- At regular intervals, such as quarterly, to track satisfaction trends over time.
For instance, industries like e-commerce and retail often use CSAT surveys to evaluate the shopping experience. A high CSAT customer satisfaction score indicates that customers are happy with their interactions, while a low score signals potential issues.
| Metric | Purpose | Benefits | Challenges |
|---|---|---|---|
| CSAT | Measures customer satisfaction with specific interactions | Provides insights into customer interactions | May not create a direct course of action for improving customer experience |
By focusing on specific touchpoints, CSAT helps you understand how well your business meets customer expectations. Tools like Sobot’s Voice/Call Center simplify the process by automating CSAT surveys and providing real-time analytics. This allows you to act quickly on customer feedback and improve satisfaction.
Leveraging NPS for Customer Loyalty
NPS is a powerful tool for gauging customer loyalty and identifying brand advocates. It measures how likely customers are to recommend your product or service to others. Businesses often use NPS surveys to monitor long-term loyalty and uncover opportunities for growth.
Successful examples of NPS implementation include:
- H&R Block Canada: Launched a referral program based on NPS data, achieving a 13% year-on-year growth.
- Bonobos: Used NPS to identify shipping issues, preventing customer dissatisfaction.
- Taylor & Hart: Analyzed NPS scores to improve their manufacturing process, enhancing both product and service satisfaction.
Companies with high NPS scores often experience better retention and referral rates. According to Fred Reichheld, NPS leaders grow more than twice as fast as their competitors. Loyal customers also tend to spend more over time, making NPS a critical metric for profitability.
Sobot’s omnichannel solutions enhance NPS by providing seamless communication across platforms. For example, Samsung achieved a 97% customer satisfaction rate and a 30% increase in agent efficiency by integrating Sobot’s tools. These solutions help you engage loyal customers and address detractors’ concerns effectively.
Applying CES to Measure Customer Effort
CES focuses on the ease of customer interactions, making it an essential metric for identifying friction points. A CES survey typically asks, “How easy was it to resolve your issue?” Lower scores indicate less effort, which correlates with higher satisfaction and loyalty.
Quantitative data highlights the importance of reducing customer effort:
| Statistic | Value | Description |
|---|---|---|
| 96% | Customers with high-effort interactions become disloyal | Highlights the importance of minimizing customer effort |
| 94% | Customers with low-effort experiences likely to repurchase | Indicates strong correlation between low effort and customer loyalty |
| 40% | Reduction in repeat calls due to CES | Demonstrates cost-saving benefits of implementing CES |
For example, a SaaS company improved user retention by simplifying its onboarding process based on CES insights. Similarly, a retailer streamlined its returns process, reducing customer effort and boosting satisfaction.
Sobot’s AI-powered tools analyze CES data to pinpoint areas where effort can be minimized. Features like intelligent IVR and smart call routing make interactions smoother, enhancing the overall customer experience. By focusing on reducing effort, you can improve loyalty, reduce churn, and even lower operational costs.
How Sobot Enhances Customer Experience Metrics
Sobot's Voice/Call Center for CSAT Surveys
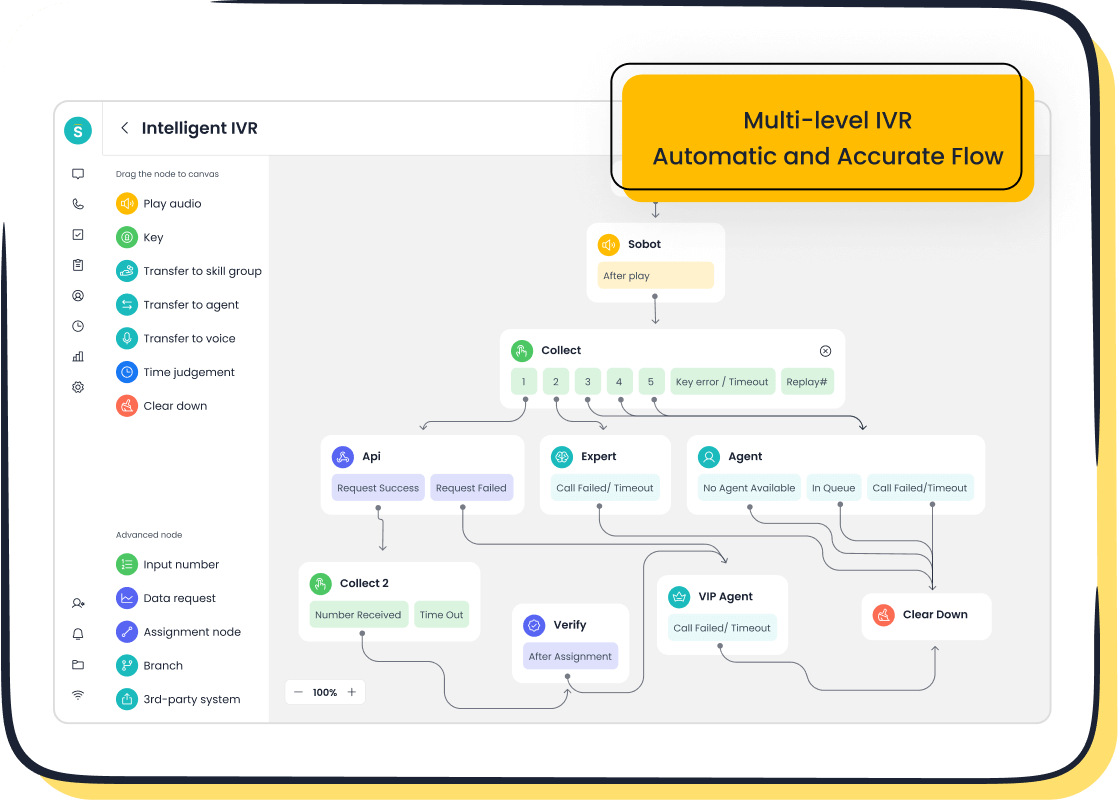
Sobot’s Voice/Call Center simplifies the process of gathering and analyzing CSAT surveys. Its intelligent IVR system allows you to customize greetings and route calls efficiently, ensuring customers receive prompt and personalized service. Real-time monitoring and analytics provide actionable insights into customer satisfaction, helping you identify areas for improvement.
For example, Samsung achieved a 97% CSAT customer satisfaction score by integrating Sobot’s Voice/Call Center into its operations. The platform’s AI-powered Voicebot handles repetitive queries, freeing agents to focus on complex issues. This approach not only improves satisfaction but also boosts agent efficiency by 30%.
Sobot’s Voice/Call Center also supports global telephony contacts, enabling businesses to collect customer feedback from diverse markets. With a 99.99% system uptime, you can rely on its stability to maintain seamless operations.
| Metric Description | Result |
|---|---|
| Reduction in inbound discussion volume | 20% |
| Increase in positive feedback | 96% + |
| Customer satisfaction rate | Over 95% |
| Self-service question resolution | 22.2% |
| Customer satisfaction score (CSAT) | 97% |
Improving NPS with Sobot's Omnichannel Solutions
Sobot’s Omnichannel Solutions enhance NPS by connecting all communication channels into one unified desk. This integration ensures customers experience seamless interactions, whether they reach out via email, social media, or voice calls. The platform’s AI-powered engagement tools automate responses, providing smart and timely interactions that improve customer loyalty.
Top brands like Samsung have leveraged Sobot’s Omnichannel Solutions to achieve a 97% customer satisfaction rate. Features like multi-language support make it ideal for businesses operating in overseas markets. By offering 24x7 service, Sobot ensures customers always have access to assistance, which strengthens their loyalty and advocacy.
| Feature | Benefit |
|---|---|
| Omnichannel | Connects all channels into one desk |
| AI-Powered Engagement | Smart and automatic engagement with customers |
| 24x7 Service | Always available for customer interactions |
| Improved Efficiency | Increases productivity of customer service teams |
| Customer Satisfaction Focus | Helps top brands enhance customer satisfaction |
| Multi-language Support | Matches user coverage in overseas markets |
Reducing Customer Effort with Sobot's AI-Powered Tools
Sobot’s AI-powered tools focus on reducing customer effort, a critical factor in improving CES. The platform’s intelligent IVR and smart call routing streamline interactions, ensuring customers resolve issues quickly. Its AI-driven automation handles repetitive tasks, reducing the need for escalation to human agents.
Metrics like first response time and resolution rate highlight the effectiveness of Sobot’s tools. For instance, faster response times lead to higher customer satisfaction, while automated resolutions reduce operational costs. By simplifying processes like onboarding and returns, Sobot helps you lower effort scores and boost customer loyalty.
| KPI | Description |
|---|---|
| First Response Time | Measures how quickly customers receive an initial response, impacting satisfaction. |
| Resolution Time | Total time taken to fully resolve a customer's issue, from initial contact to final solution. |
| Customer Satisfaction | Directly gauges customer happiness with their support experience. |
| Resolution Rate | Percentage of customer issues successfully resolved through automation. |
| Escalation Rate | Frequency of automated interactions requiring escalation to a human agent. |
By leveraging Sobot’s AI-powered tools, you can transform customer effort score insights into actionable strategies that enhance satisfaction and retention.
CSAT vs NPS vs CES: A Quick Comparison

Summary of Key Features and Differences
Each metric—CSAT, NPS, and CES—offers unique insights into customer satisfaction and loyalty. CSAT focuses on immediate feedback after specific interactions, helping you understand how satisfied customers are with a particular touchpoint. NPS evaluates customer loyalty by measuring their likelihood to recommend your brand, providing a broader view of long-term satisfaction. CES highlights the ease of customer interactions, pinpointing areas where reducing effort can improve retention.
| Metric | Description |
|---|---|
| Customer Satisfaction Score (CSAT) | Evaluates overall satisfaction with your service. |
| Net Promoter Score (NPS) | Measures customer loyalty and likelihood to recommend your service. |
| Customer Effort Score (CES) | Assesses the ease of doing business with your company. |
By comparing these metrics side by side, you can identify which one aligns best with your business goals. For example, CSAT is ideal for tracking satisfaction at specific touchpoints, while NPS helps you gauge loyalty over time. CES is perfect for identifying friction points in processes like onboarding or returns.
Real-World Applications of Each Metric
Businesses across industries have successfully implemented these metrics to enhance customer experience. McDonald’s used customer feedback to introduce healthier menu options and digital ordering kiosks, improving satisfaction. Hilton Honors revamped its loyalty program with personalized rewards, boosting customer engagement. Uber launched Uber Pro to improve driver satisfaction, while Sephora integrated digital tools to personalize shopping experiences. Delta Airlines enhanced transparency with real-time flight updates, increasing customer loyalty.
| Company | Industry | Objective | Implementation | Outcome |
|---|---|---|---|---|
| McDonald’s | Fast Food | Understand customer preferences | Introduced healthier menu options and digital ordering kiosks | Enhanced customer experience through better menu options and ordering processes. |
| Hilton Honors | Hospitality | Enhance loyalty program | Revamped Honors program with flexible rewards and personalized offers | Increased member satisfaction and engagement, boosting loyalty to the brand. |
| Uber | Ride-Sharing | Improve driver-partner experience | Launched Uber Pro and improved in-app communication tools | Increased driver satisfaction and retention, maintaining a reliable network of drivers. |
| Sephora | Beauty Retail | Enhance in-store shopping experience | Integrated digital tools like in-store tablets and the Sephora Virtual Artist app | Higher customer satisfaction and increased sales due to personalized shopping experiences. |
| Delta Airlines | Airlines | Enhance overall travel experience | Introduced real-time flight status updates and easier rebooking options | Higher customer satisfaction and loyalty due to improved communication and transparency. |
These examples demonstrate how CSAT, NPS, and CES can drive meaningful improvements in customer satisfaction and loyalty.
Choosing the Right Metric for Your Business Goals
Selecting the right metric depends on your specific objectives. If you aim to improve checkout ease or streamline onboarding, CES is the best choice. For tracking customer loyalty and advocacy, NPS provides valuable insights. CSAT works well for measuring satisfaction at specific touchpoints, such as after a purchase or service interaction.
- Identify your business goals, such as enhancing loyalty or reducing effort.
- Choose metrics that align directly with these objectives.
- Use these metrics as KPIs to benchmark and improve customer experience.
- Monitor customer feedback continuously to refine your strategies.
- Apply different metrics at various stages of the customer journey. For example, CES at the beginning and NPS for established customers.
Your success depends on how effectively you use the data collected. By focusing on actionable insights, you can transform customer feedback into strategies that drive satisfaction and loyalty.
CSAT, NPS, and CES each serve unique roles in understanding customer experience. CSAT captures immediate customer satisfaction at specific touchpoints, while the net promoter score evaluates long-term customer loyalty. CES focuses on the customer effort score, highlighting areas where reducing effort can improve satisfaction. Together, these metrics provide a comprehensive view of customer feedback.
To maximize their impact, align these metrics with your business goals. Use NPS to identify loyal customers, CSAT to measure satisfaction after key interactions, and CES to streamline processes. Analyze the data to uncover actionable insights, share results across teams, and foster a customer-centric culture. Sobot’s solutions, like its Voice/Call Center, simplify survey implementation and help you optimize customer satisfaction strategies effectively.
FAQ
What is the best metric to measure customer loyalty?
NPS is the most effective metric for tracking customer loyalty. It measures how likely customers are to recommend your brand. A high NPS score indicates strong loyalty and advocacy, which can drive referrals and repeat business.
Can I use CSAT, NPS, and CES together?
Yes, combining these metrics provides a comprehensive view of customer experience. Use CSAT for immediate feedback, NPS for long-term loyalty, and CES to identify friction points. Together, they help you improve satisfaction, retention, and advocacy.
How often should I send CSAT surveys?
Send CSAT surveys immediately after key interactions, such as purchases or support calls. For ongoing tracking, quarterly surveys work well. This timing ensures you capture accurate feedback while monitoring trends over time.
Why is CES important for customer retention?
CES highlights how easy it is for customers to interact with your business. Lower effort leads to higher satisfaction and loyalty. By reducing effort in processes like onboarding or returns, you can improve retention and reduce churn.
How can Sobot help improve these metrics?
Sobot’s tools simplify survey collection and analysis. The Voice/Call Center automates CSAT surveys, omnichannel solutions enhance NPS, and AI-powered tools reduce effort for CES. These features help you optimize customer satisfaction strategies effectively.
💡 Tip: Explore Sobot’s solutions to streamline your customer experience metrics and drive better results!
See Also
Comparative Analysis of Leading Customer Voice Software
Best 10 Customer Voice Software Options for 2024
Leading 10 Customer Support Software Solutions for 2024
