How to Use Call Flow Completion CFC in Programming
A Call Flow Completion (CFC) visually represents the sequence of steps in a program. It helps you understand how processes flow, decisions are made, and tasks are executed. By mapping out logic, CFCs simplify programming and reduce errors. For example, control flow testing can detect nearly 50% of defects during unit testing and uncover one-third of program-wide issues. In customer service automation, tools like Sobot utilize CFCs to streamline workflows. This approach reduces inbound discussion volume by 20% and boosts customer satisfaction scores to 97%, ensuring efficient and reliable service.
Why Use a Control Flow Chart (CFC)?
Benefits of Visualizing Logic
Simplifies understanding of complex programming tasks.
A control flow chart helps you break down intricate programming tasks into manageable steps. By visualizing the flow of a program, you can focus on the logic rather than getting overwhelmed by syntax. For example, flowchart-based systems like eALGO have shown that students grasp programming fundamentals more effectively when they use diagrams. This approach simplifies the learning curve, especially for beginners, and makes even complex tasks easier to understand.
Helps identify and resolve logical errors early.
When you map out a program using a control flow chart, you can spot potential errors before writing any code. Decision points and flowlines in the chart highlight areas where logic might fail. Automated tools like eALGO provide immediate feedback on flowchart designs, helping you refine your logic early. This proactive approach reduces debugging time and ensures smoother execution of your program.
Debugging and Troubleshooting
Provides a clear roadmap for identifying and fixing errors.
A control flow chart acts as a visual guide during debugging. It outlines the sequence of operations, making it easier to trace where an error occurs. For instance, in a PLC (programmable logic controller) system, a well-designed flowchart can pinpoint the exact step where a malfunction happens. This clarity saves time and effort, especially in complex systems.
Enhances efficiency in debugging processes.
Using a control flow chart streamlines the debugging process. You can quickly isolate faulty logic by following the flowlines. Studies have shown that flowchart-based environments improve problem-solving skills by focusing on design rather than syntax. This efficiency is particularly valuable in customer service automation, where tools like Sobot's Chatbot rely on precise workflows to handle queries effectively.
Improving Code Structure
Encourages modular and organized programming.
A control flow chart promotes a structured approach to programming. By dividing a program into smaller, manageable modules, you can ensure each part functions independently. This modularity is crucial in PLC systems, where programmable logic controllers execute specific tasks. Organized programming not only improves readability but also simplifies maintenance.
Facilitates collaboration among team members and tools like Sobot's Chatbot.
When working in a team, a control flow chart serves as a universal language. It helps everyone understand the program's logic, regardless of their coding expertise. Tools like Sobot's Chatbot benefit from this clarity. By integrating CFCs into its workflow design, the chatbot automates customer interactions seamlessly, enhancing efficiency and reducing costs.
Key Components of a Control Flow Chart
A control flow chart (CFC) consists of several essential components that help you visualize and organize the logic of a program. These components ensure clarity and precision, whether you're working on a simple application or a complex system like a PLC (programmable logic controller).
Start and End Symbols
Represent the beginning and conclusion of a process.
Start and end symbols mark the boundaries of your program's flow. These symbols, often represented as ovals or rounded rectangles, clearly indicate where the process begins and ends. For example, in a PLC system, the start symbol might represent the activation of a machine, while the end symbol could signify the completion of a task. This clarity ensures that you can easily identify the scope of your program.
Tip: Always include start and end symbols in your CFC to avoid confusion about where the process begins or terminates.
Decision Points
Indicate where a choice or condition is evaluated.
Decision points, depicted as diamonds, represent moments in your program where a condition must be evaluated. These points guide the flow based on "yes" or "no" outcomes. For instance, in customer service automation, a decision point might determine whether a query requires human intervention or can be resolved by Sobot's Chatbot. This structure ensures that your program handles all possible scenarios effectively.
| Component Type | Description |
|---|---|
| Start/End Symbols | Ovals or rounded rectangles representing the beginning and end of the flow. |
| Decision Points | Diamonds indicating stages where a decision should be made. |
Processes and Actions
Represent tasks or operations in the program.
Processes and actions are the core of any control flow chart. Represented by rectangles, they define the specific tasks your program performs. For example, in a PLC system, a process might involve turning on a conveyor belt or recording sensor data. Similarly, in a customer service workflow, processes could include receiving a query, analyzing it, and providing a response. These steps ensure that your program operates smoothly and achieves its objectives.
- Flowcharts: These diagrams represent processes in sequential order, making it easy to pinpoint decision points.
- Swimlane Diagrams: These charts organize tasks across different departments or roles, clarifying responsibilities and enhancing accountability.
By understanding these components, you can create a CFC that simplifies programming, improves efficiency, and ensures error-free execution.
Arrows and Flowlines
Show the direction of the process flow.
Arrows and flowlines are essential components of a control flow chart. They guide you through the sequence of steps in a program, ensuring clarity and precision. Each arrow connects two symbols, such as processes or decision points, and indicates the order in which tasks occur. Flowlines, represented as lines with arrows, show the direction of the process flow, making it easier to follow the logic.
For example, in a PLC system, arrows might connect a start symbol to a process box that activates a machine. From there, another arrow could lead to a decision point, such as checking if the machine has completed its task. This visual representation ensures that you can trace the program's flow without confusion.
Tip: Always use arrows to connect symbols in your control flow chart. This practice eliminates ambiguity and ensures that the process flow is easy to understand.
Flowlines and arrows simplify complex procedures by breaking them into manageable steps. They visually represent the flow from one step to another, enhancing your understanding of the program's logic. Studies show that diagrams with clear flowlines improve comprehension, especially in systems like programmable logic controllers. By using arrows effectively, you can create a CFC that is both functional and easy to interpret.
| Component | Description |
|---|---|
| Flowline | Shows the step's direction. Each flowline connects two blocks, represented by lines with arrows. |
| Arrow | Indicates the order of tasks within the process, pointing from one symbol to another. |
When designing a control flow chart, remember that arrows and flowlines are not just visual aids. They are tools that help you organize and communicate the logic of your program. Whether you're working on a PLC system or automating customer service workflows with tools like Sobot's Chatbot, these elements ensure that your CFC is clear and effective.
How to Create a Control Flow Chart
Step 1: Identify the Problem
Define the goal of the program or process.
The first step in creating a control flow chart is to clearly define the problem you aim to solve. This involves understanding the purpose of your program and the outcomes you want to achieve. For instance, if you're working with a PLC system, the goal might be to automate a machine's operation or streamline a manufacturing process. In customer service, the objective could be to enhance query resolution using tools like Sobot's Chatbot. By identifying the problem, you set a clear direction for the flowchart and ensure that every step aligns with the desired outcome.
Tip: Write down the inputs and outputs of your process. This will help you stay focused on the program's purpose and avoid unnecessary steps.
Step 2: Break the Problem into Steps
List all the tasks or decisions involved.
Breaking the problem into smaller steps is crucial for creating an organized control flow chart. Start by listing every task, decision, or action required to achieve your goal. For example, in a PLC system, the steps might include initializing the system, checking sensor inputs, and executing specific machine commands. In customer service automation, the steps could involve receiving a query, analyzing its intent, and providing a response.
Here’s a proven method to structure your steps:
- Define the problem to ensure alignment with your goal.
- Identify the inputs and outputs to guide the process.
- Break the problem into essential actions or stages.
- Use decision symbols to represent choices or conditions.
- Add concise descriptions to explain each step.
- Revise and refine the steps for clarity and accuracy.
This approach ensures that your flowchart remains logical and easy to follow, even for complex systems like programmable logic controllers.
Step 3: Translate Steps into a Flowchart
Use symbols to represent each step and connect them with arrows.
Once you’ve outlined the steps, it’s time to translate them into a visual diagram. Use standard symbols like ovals for start/end points, rectangles for processes, and diamonds for decision points. Connect these symbols with arrows to show the flow of the program. For example, in a PLC system, an arrow might lead from a start symbol to a process box that activates a conveyor belt. A decision point could then evaluate whether the belt has completed its task.
| Evidence Description | Benefit |
|---|---|
| Decision points in flowcharts help narrow down problems systematically. | Simplifies the troubleshooting process, making it easier to follow. |
| Each decision leads to a specific solution or next action. | Provides clear, actionable fixes, reducing the need for customer support. |
| Structured approach allows agents to navigate common problems quickly. | Improves efficiency in resolving issues. |
| Flowcharts improve communication of system logic and assist in debugging. | Enhances documentation and understanding of processes. |

Flowcharts not only clarify the logic of your program but also make troubleshooting easier. For example, Sobot's Chatbot uses flowcharts to automate customer interactions, ensuring consistent and efficient query resolution. By visualizing the steps, you can identify potential errors and refine the process for better results.
Note: Keep your flowchart simple and avoid overcrowding it with too many details. A clear and concise diagram is easier to understand and implement.
Step 4: Review and Refine
Ensure the flowchart accurately represents the process.
Reviewing and refining your control flow chart is a critical step in programming. This process ensures that your diagram accurately reflects the logic and flow of your program. Start by revisiting each component of the chart. Check if the start and end symbols clearly define the boundaries of the process. Verify that decision points evaluate all possible conditions and that processes align with the intended tasks.
A thorough review helps you identify gaps or inefficiencies in your control flow chart. For example, in a PLC system, missing a decision point could lead to errors in machine operations. Similarly, in customer service automation, an incomplete flowchart might cause Sobot's Chatbot to misinterpret queries. Refining the chart ensures that every step is logical and error-free.
Tip: Collaborate with team members or use tools like Sobot's Chatbot to simulate the flowchart. This practice helps uncover hidden issues and improves the overall quality of your program.
Refining your control flow chart also brings long-term benefits. It enhances customer satisfaction by ensuring that processes meet expectations. Early detection of defects reduces costs and increases efficiency. For instance, a well-reviewed chart in a PLC system minimizes downtime and optimizes performance. In customer service, it ensures seamless query resolution, boosting the chatbot's effectiveness.
| Benefit | Description |
|---|---|
| Improved Customer Satisfaction | Focus on quality leads to products/services that meet or exceed customer expectations. |
| Cost Savings | Early defect detection through quality assurance is less costly than fixing issues later. |
| Increased Efficiency | Standardized processes streamline activities and reduce wasted effort. |
| Competitive Advantage | High-quality products/services help differentiate the organization and build a reputation. |
| Risk Mitigation | Identifying potential quality threats allows for preventive actions to be taken. |
| Continuous Improvement | Promotes an environment of ongoing process improvement by capturing lessons learned and best practices. |
By refining your control flow chart, you create a reliable foundation for your program. Whether you're working on a PLC system or automating workflows with Sobot's Chatbot, this step ensures that your programming efforts yield accurate and efficient results.
Tools for Creating Control Flow Charts
Beginner-Friendly Software
Lucidchart: A user-friendly online tool for flowcharts.
Lucidchart is a popular choice for creating control flow charts. Its intuitive interface allows you to design diagrams quickly, even if you're new to programming. The platform offers a variety of templates, making it easy to map out processes for PLC systems or other programs. Lucidchart supports collaboration, enabling teams to work on the same diagram in real time. This feature is especially useful when designing workflows for customer service automation.
| Software Tool | User-Friendly Features | Target Users |
|---|---|---|
| SMART TS XL | Diverse templates, customization options, collaboration tools | Various industries |
| Microsoft Visio | User-friendly interface, array of templates for quick starts | Professionals and beginners |
| Lucidchart | Easy creation of various diagrams, user-friendly interface | Beginners and professionals |
| CAST | Extensive library of templates, intuitive interface for complex flowcharts | Users needing detailed diagrams |
| Gliffy | Intuitive platform for creating intricate diagrams | Beginners and casual users |
Lucidchart stands out for its simplicity and versatility, making it ideal for both beginners and professionals.
Draw.io: A free and versatile diagramming tool.
Draw.io is another excellent option for creating control flow charts. It is free to use and offers a wide range of features. You can create detailed diagrams without needing advanced programming skills. Draw.io supports offline access, which is helpful when working in environments with limited internet connectivity. Its drag-and-drop functionality simplifies the process of designing flowcharts for PLC systems or customer service workflows.
Traditional Methods
Pen and paper for quick sketches.
Sometimes, the simplest tools are the most effective. Pen and paper allow you to sketch control flow charts quickly. This method is perfect for brainstorming or outlining a program's logic before using software. It requires no setup and can be done anywhere. However, transferring these sketches to digital formats may take extra time.
Whiteboards for collaborative brainstorming.
Whiteboards are excellent for team discussions and collaborative programming sessions. They provide a large, visible space to map out control flow charts. Studies show that whiteboard presentations improve audience engagement and recall by 16%. Concepts drawn on whiteboards are also easier to remember, thanks to the picture superiority effect. However, remote participants may find it challenging to engage fully with whiteboard sessions.
- 43% of sales professionals consider whiteboards the most effective tool for presentations.
- 91% of business professionals focus more on key elements during whiteboard presentations than PowerPoint slides.
Sobot's Chatbot Integration
How Sobot's Chatbot can assist in automating and visualizing customer service workflows.

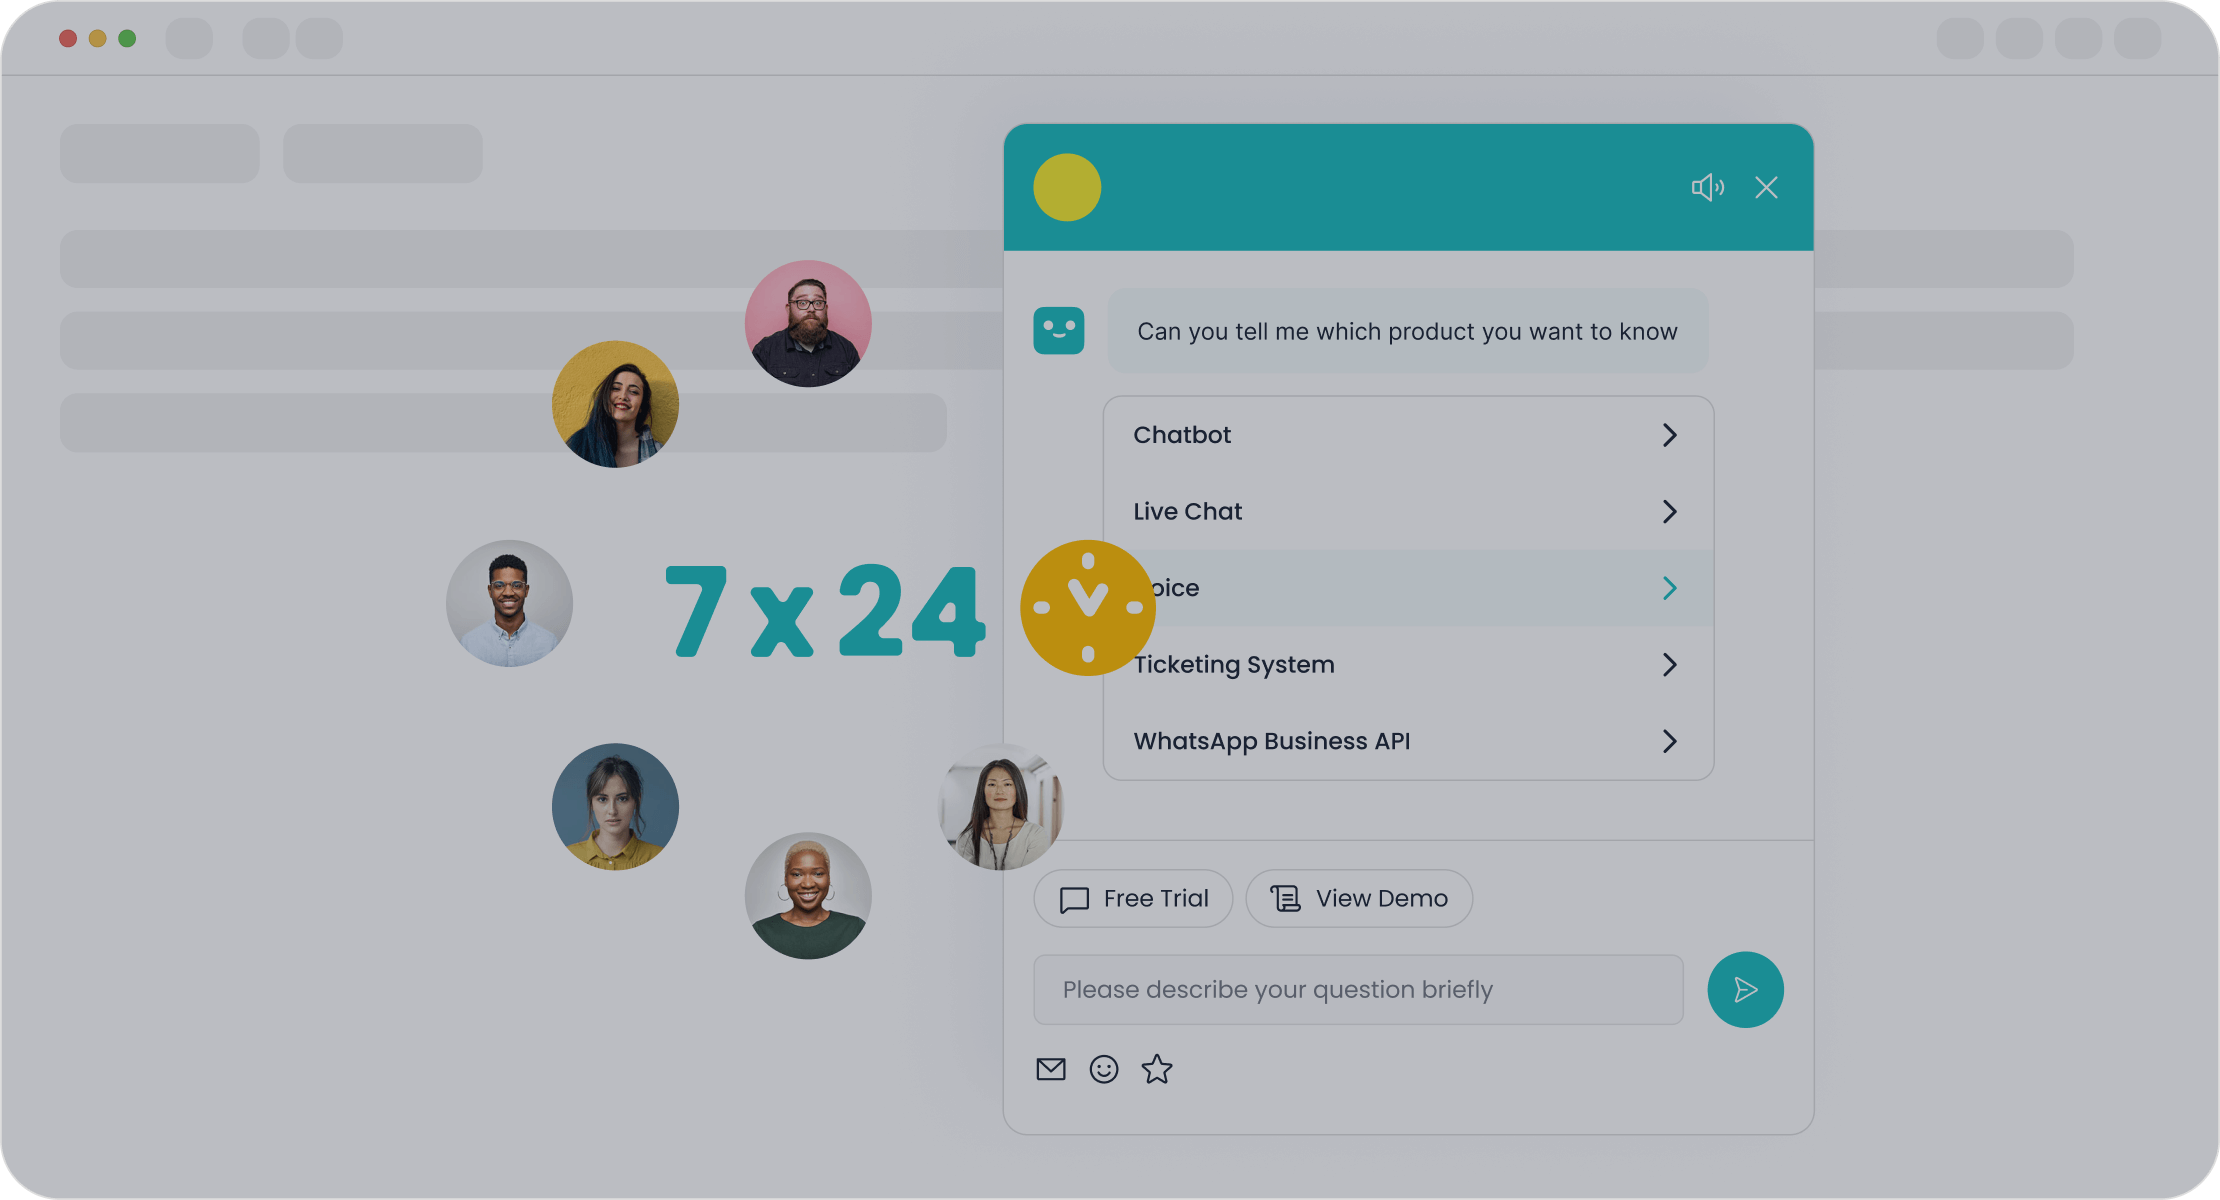
Sobot's Chatbot simplifies customer service automation by integrating control flow charts into its workflow design. You can use its point-and-click interface to create visual representations of customer interactions. For example, a control flow chart can map out how the chatbot handles queries, from receiving input to providing a response. This approach ensures that every step aligns with your program's goals.
The chatbot's multilingual support and 24/7 availability enhance its efficiency. It uses control flow charts to automate repetitive tasks, reducing the need for human intervention. This not only saves time but also cuts costs by up to 50%. By visualizing workflows, Sobot's Chatbot ensures consistent and accurate query resolution, boosting customer satisfaction.
Tip: Use Sobot's Chatbot to test your control flow charts in real-world scenarios. This helps refine your workflows and improve their effectiveness.
Practical Example: Creating a CFC for a Simple Program

Problem: Automating Customer Queries with Sobot's Chatbot
Step 1: Define the input and output (e.g., customer query and response).
To begin, identify the inputs and outputs of your program. In this case, the input is a customer query, and the output is the chatbot's response. For example, a customer might ask about store hours or product availability. The chatbot processes this query and provides an accurate answer. This step ensures that the control flow chart focuses on achieving the program's goal—efficient and accurate query resolution.
Tip: Clearly define the expected outcomes to avoid unnecessary steps in your control flow chart.
Step 2: Break the process into steps (e.g., receive query, process it, provide response).
Next, break the problem into smaller, manageable steps. For automating customer queries, the steps might include:
- Receive the customer query.
- Analyze the query to determine intent.
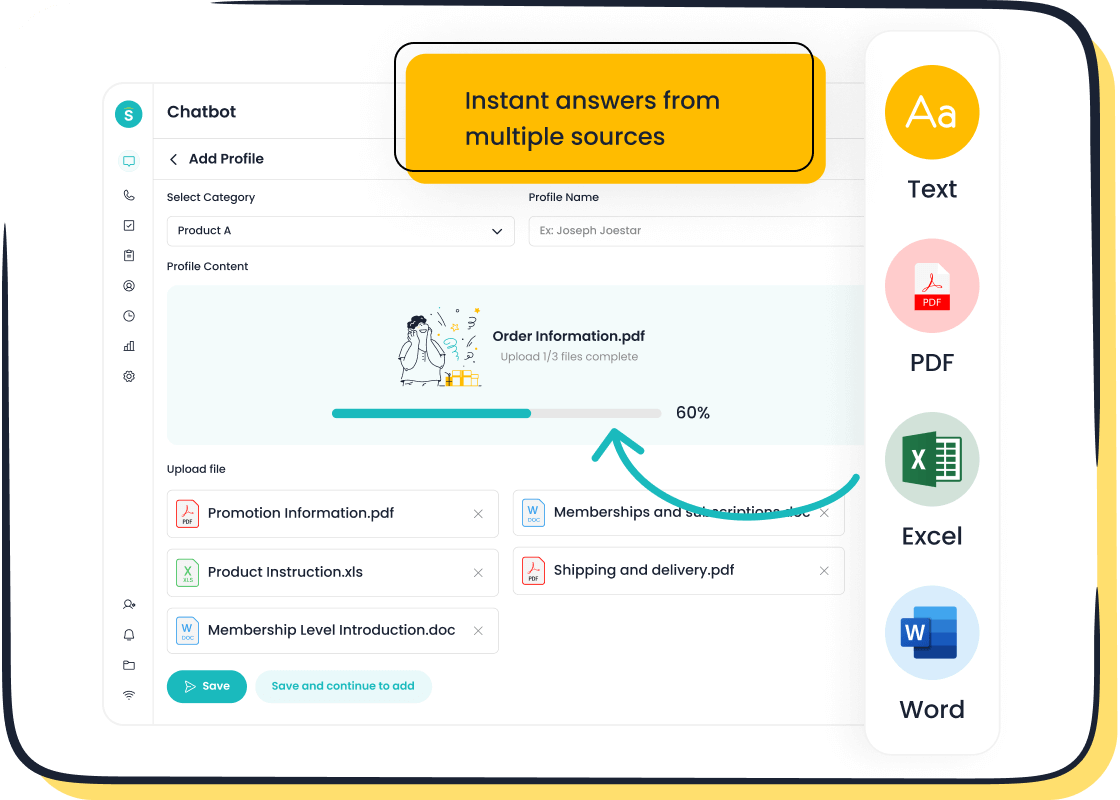
- Search the knowledge base for relevant information.
- Provide a response or escalate to a human agent if needed.
This structured approach simplifies the logic of your program and ensures that every step contributes to the desired outcome.
| Industry | Key Benefits | Challenges |
|---|---|---|
| Life Services | - Improved efficiency through automation and AI. | - Need for an integrated contact platform for full-lifecycle customer inquiries. |
| Retail | - Personalized experiences and customer journey management. | - Requirement for an integrated customer contact solution to unify sales, marketing, and support. |
| Financial Services | - Enhanced customer experience with a focus on data security. | - Need for effective customer interaction processes and service effectiveness. |
Translating the Steps into a Flowchart
Use start/end symbols, process boxes, and arrows to map the logic.
Now, translate the steps into a visual diagram. Use standard symbols like ovals for start/end points, rectangles for processes, and diamonds for decision points. For example:
- Start: The chatbot receives a query.
- Process: Analyze the query and search the knowledge base.
- Decision: Can the chatbot resolve the query? If yes, provide a response. If no, escalate to a human agent.
- End: The query is resolved.
Flowcharts have been used since the 1940s to outline algorithmic solutions. They simplify complex procedures into manageable steps and enhance communication by providing a visual representation of processes. For instance:
- Flowcharts help visualize workflows step-by-step, fostering a shared understanding among teams.
- Swimlane diagrams clarify responsibilities across different functional areas, enhancing accountability.
- Value Stream Mapping (VSM) identifies waste and optimizes the flow of materials and information.
Reviewing the Flowchart
Ensure the flowchart is clear and error-free.
Finally, review your control flow chart to ensure accuracy. Check if all steps are logically connected and if decision points cover all possible outcomes. For example, missing a decision point might cause the chatbot to misinterpret a query. Refining the flowchart improves its effectiveness and reduces errors.
| Benefit | Description |
|---|---|
| Enhanced Understanding | Flowcharts simplify complex logic and algorithms into easily digestible visual representations. |
| Error Identification | Flowcharts highlight potential bottlenecks and errors within a program. |
| Efficient Problem-Solving | They empower teams to troubleshoot and optimize code efficiently. |
Flowcharts assist in identifying inefficiencies and bottlenecks. By refining your diagram, you ensure that the chatbot operates smoothly, providing consistent and accurate responses to customer queries.
Control flow charts play a vital role in programming by simplifying logic and improving efficiency. They help you visualize processes, identify errors, and create structured workflows. Whether you are designing a program or automating customer service, these charts ensure clarity and precision. Practicing their creation can enhance your problem-solving skills and streamline your projects. Tools like Sobot's Chatbot make this process even easier by integrating visual workflows into customer interactions. This approach not only saves time but also boosts customer satisfaction, making automation more effective.
FAQ
What is the purpose of a Control Flow Chart (CFC)?
A Control Flow Chart (CFC) helps you visualize the sequence of steps in a program. It simplifies complex logic, identifies errors early, and improves efficiency. For example, Sobot's Chatbot uses CFCs to automate workflows, reducing query resolution time and enhancing customer satisfaction.
How does Sobot's Chatbot use CFCs?
Sobot's Chatbot integrates CFCs to design automated workflows. These charts map out customer interactions step-by-step, ensuring accurate responses. For instance, the chatbot uses decision points to determine whether to resolve a query or escalate it, saving up to 50% on operational costs.
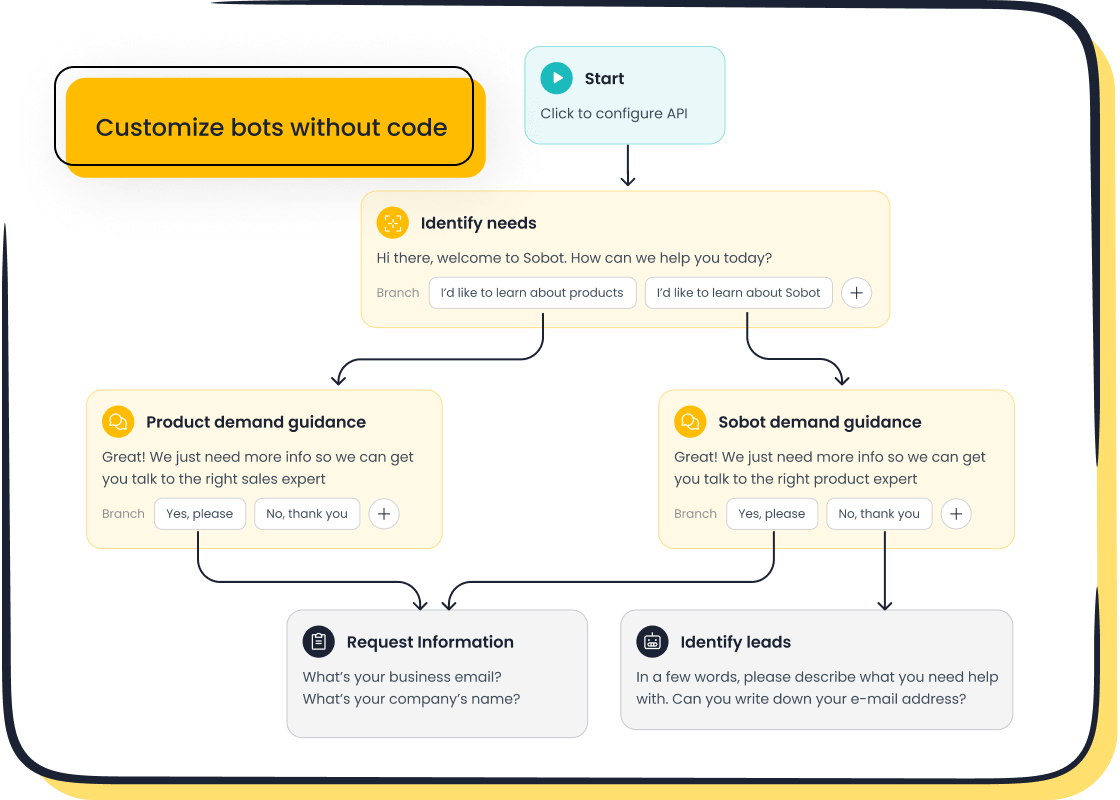
Can beginners create a CFC without coding experience?
Yes, beginners can create CFCs without coding. Tools like Sobot's Chatbot offer a point-and-click interface for designing workflows. This feature allows you to build and automate processes visually, making it accessible even for those new to programming.
Why are decision points important in a CFC?
Decision points guide your program by evaluating conditions and directing the flow. For example, in customer service, a decision point might determine if a query needs human intervention. This ensures your program handles all scenarios effectively, improving accuracy and efficiency.
What tools can you use to create a CFC?
You can use tools like Lucidchart, Draw.io, or Sobot's Chatbot to create CFCs. Sobot's Chatbot simplifies the process with its no-coding-required interface, enabling you to design workflows that automate customer interactions across multiple channels.
See Also
Understanding The Efficiency Of Call Center Automation
Comprehensive Overview Of Omnichannel Call Center Solutions
A Ten-Step Approach To Omnichannel Contact Center Implementation
Best Practices For Effective Quality Management In Call Centers
