Top Call Center KPIs to Track This Year

Tracking call center KPIs in 2025 plays a vital role in achieving call center success. These metrics, which include an overview of call center key performance indicators, directly impact customer satisfaction, operational efficiency, and agent productivity. For example, over 35% of support managers monitor KPIs daily, with metrics like CSAT, FCR, and service level being crucial. Tools like Sobot’s Voice/Call Center provide real-time insights, empowering you to make data-driven decisions. By leveraging analytics, you can reduce average handle time, improve first-call resolution rates, and enhance customer experiences. Accurate benchmarking further ensures your team meets or exceeds industry standards, keeping your operations competitive.
An Overview of Call Center Key Performance Indicators
What Are Call Center KPIs?
Call center KPIs, or key performance indicators, are measurable values that help you evaluate the success of your call center operations. These metrics provide insights into customer satisfaction, agent productivity, and overall efficiency. By tracking these performance indicators, you can identify areas for improvement and make informed decisions to enhance your service quality.
For example, metrics like Average Handling Time (AHT) and First Call Resolution (FCR) measure how efficiently your team resolves customer issues. Customer Satisfaction Score (CSAT) and Net Promoter Score (NPS) gauge how happy customers are with your service. These KPIs act as a compass, guiding your call center toward better performance and customer experiences.
Why Are Call Center KPIs Important in 2025?
In 2025, the importance of call center KPIs has grown significantly. Businesses now rely on data-driven strategies to stay competitive. Tracking these metrics allows you to monitor performance, improve customer interactions, and optimize resources. For instance, 95% of contact center professionals consider CSAT the most critical metric for evaluating customer happiness.
KPIs like Customer Effort Score (CES) and Service Level ensure your team delivers seamless support. High CES scores indicate smoother issue resolution, which directly impacts customer loyalty. Monitoring AHT helps you set realistic goals and allocate resources effectively. By focusing on these metrics, you can adapt to changing customer expectations and maintain a competitive edge.
How to Use Call Center Metrics for Benchmarking
Benchmarking involves comparing your call center metrics against industry standards to measure performance. This process helps you identify strengths and weaknesses, enabling continuous improvement. For example, the Snapshot Call Center Benchmark Study highlights key metrics like FCR and CSAT, providing valuable insights into customer service delivery.
To start, track essential metrics such as AHT, FCR, and Abandonment Rate. Compare your results with industry benchmarks to pinpoint areas needing attention. Tools like Sobot’s Voice/Call Center simplify this process by offering real-time analytics and customizable dashboards. These features allow you to monitor performance indicators and implement data-driven strategies effectively.
Tip: Regularly analyze metrics that fall below benchmarks to uncover factors affecting customer satisfaction. Use this data to make informed changes and enhance your operations.
Customer Experience KPIs to Enhance Satisfaction

Customer Satisfaction Score (CSAT)
Customer Satisfaction Score (CSAT) is one of the most widely used call center KPIs. It measures how satisfied customers are with the service they receive. You can calculate CSAT by asking customers to rate their experience on a scale, typically from 1 to 5, where 5 represents the highest satisfaction level. This metric provides a clear picture of how well your team meets customer expectations.
The importance of CSAT lies in its ability to highlight areas for improvement. For example, a world-class CSAT rate is 85% or higher, but only 5% of call centers achieve this level. Most call centers fall within the "good" range of 75% to 84%. Tracking this KPI helps you identify gaps in service quality and take corrective actions.
| Metric | Value |
|---|---|
| Average CSAT Benchmark | 78% |
| Good CSAT Rate | 75% to 84% |
| World-class CSAT Rate | 85% or higher |
| Percentage of World-class | 5% of call centers |

Customer feedback is essential for improving service quality. CSAT scores not only reflect customer satisfaction but also correlate with loyalty. By using tools like Sobot’s Voice/Call Center, you can gather real-time feedback and analyze trends to enhance customer experience. This approach ensures your team consistently delivers high-quality service.
Net Promoter Score (NPS)
Net Promoter Score (NPS) measures customer loyalty by asking a simple question: "How likely are you to recommend our service to others?" Customers respond on a scale from 0 to 10, with scores categorized into promoters (9-10), passives (7-8), and detractors (0-6). NPS is calculated by subtracting the percentage of detractors from the percentage of promoters.
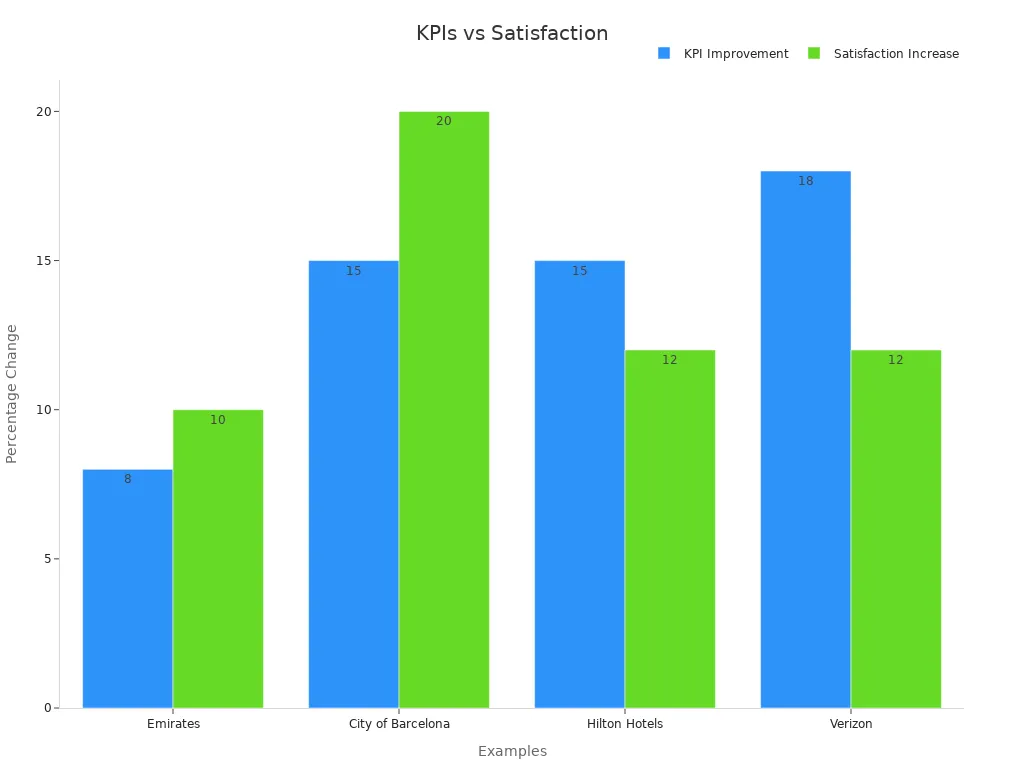
NPS is a powerful indicator of long-term customer satisfaction and business growth. Research by Bain and Co shows that NPS can account for 20% to 60% of a company’s organic growth rate. For instance, Delta Air Lines improved its NPS and CSAT, leading to a 15% increase in customer satisfaction. This demonstrates the strong link between loyalty and overall satisfaction.
| Year | Promoters (%) | Passives (%) | Detractors (%) | Unchanged Loyalty (%) |
|---|---|---|---|---|
| 2012 | 75 | 25 | 5 | 98 |
Sobot’s Voice/Call Center simplifies NPS tracking by integrating customer feedback into a unified dashboard. This feature allows you to monitor trends and implement strategies to convert detractors into promoters. By focusing on NPS, you can build stronger relationships and foster customer loyalty.
First Call Resolution (FCR)
First Call Resolution (FCR) measures the percentage of customer issues resolved during the first interaction. It is a critical KPI for assessing contact quality and operational efficiency. High FCR rates indicate that your team resolves issues promptly, reducing the need for follow-up calls.
FCR directly impacts customer satisfaction. Studies show that 67% of customers stay with a company that resolves issues in one interaction. Additionally, a 1% improvement in FCR leads to a 1% increase in customer satisfaction. Companies like Amazon and Netflix maintain FCR rates above 90%, showcasing the benefits of quick issue resolution.
| Statistic/Case Study | Benefit |
|---|---|
| High FCR rates correlate with increased customer satisfaction | Issues resolved promptly lead to fewer follow-up calls, lowering operational costs. |
| 1% increase in FCR leads to 1% increase in customer satisfaction scores (CSAT) | Higher satisfaction can lead to increased sales and customer retention. |
| Amazon's FCR rate over 90% | Demonstrates high customer loyalty and satisfaction. |
| Netflix's FCR rate over 95% | Indicates strong brand reputation and customer retention. |
Sobot’s Voice/Call Center enhances FCR by providing agents with a unified workspace. This feature consolidates customer data, enabling agents to resolve issues efficiently. Smart call routing and AI-powered tools further improve first-contact resolution rates, ensuring a seamless customer experience.
Customer Effort Score (CES)
Customer Effort Score (CES) measures how easy it is for customers to resolve their issues or complete a task with your support. This KPI focuses on reducing the effort customers need to exert during interactions, which directly impacts their satisfaction and loyalty. You can calculate CES by asking customers to rate their experience on a scale, such as "How easy was it to resolve your issue today?" Lower effort scores indicate a smoother customer experience.
Why does CES matter? Research shows that 94% of customers who experience low effort are likely to repurchase, while 88% of those who face high effort are likely to switch to competitors. For example, if a customer has to repeat their issue multiple times or gets transferred between agents, their effort score increases, leading to frustration. On the other hand, seamless support with quick resolutions boosts CES and strengthens customer retention.
Sobot's Voice/Call Center helps you improve CES by offering features like smart call routing and a unified workspace. These tools ensure customers connect with the right agent quickly, reducing wait times and repetitive explanations. Additionally, AI-powered voicebots handle repetitive queries efficiently, allowing agents to focus on complex issues. By leveraging these capabilities, you can create a frictionless experience that enhances customer satisfaction and loyalty.
Tip: Regularly monitor CES alongside other customer experience metrics to identify pain points and streamline your support processes.
How Sobot's Voice/Call Center Improves Customer Experience Metrics
Sobot's Voice/Call Center is designed to elevate your customer experience by addressing key performance areas. Its advanced features, such as intelligent IVR, AI-powered voicebots, and real-time analytics, enable you to deliver high-quality support while optimizing operations. Here’s how it improves customer experience metrics:
- Unified Workspace: Agents access all customer data in one place, enabling faster and more personalized resolutions.
- Smart Call Routing: Calls are directed to the most suitable agent, reducing wait times and improving first-call resolution rates.
- AI-Powered Voicebots: These bots handle repetitive queries with 80% accuracy, freeing agents to focus on complex tasks.
- Real-Time Monitoring: Supervisors track performance metrics like CES, CSAT, and FCR, ensuring consistent service quality.
The impact of these features is evident in the numbers:
| Metric | Improvement |
|---|---|
| Reduction in inbound discussion | 20% |
| Positive feedback rate | 96%+ |
| Correct answers by AI platform | 80% |
| Customer satisfaction (CSAT) score | 97% |
| Problems solved | 85% |
| Customer happiness rate | 99% |
| Increase in agent efficiency | 30% |
| Sign-off rate increase | 35% |
| COD collection rate increase | 40% |
These improvements highlight how Sobot's Voice/Call Center transforms customer support into a seamless and efficient process. For example, Samsung achieved a 97% customer satisfaction rate and a 30% boost in agent efficiency by implementing Sobot's solutions. By adopting these tools, you can enhance customer retention and deliver exceptional service quality.
Note: A focus on customer experience metrics like CES and CSAT not only improves satisfaction but also drives long-term customer loyalty.
Operational Efficiency KPIs for Streamlined Performance
Average Handle Time (AHT)
Average Handle Time (AHT) measures the average time agents spend handling a call, including talk time, hold time, and after-call work. This KPI is essential for evaluating the efficiency of your call center operations. A lower AHT indicates faster resolutions, but it’s important to balance speed with quality to maintain customer satisfaction.
AHT plays a critical role in performance optimization. For example, reducing AHT can help your team handle more calls without increasing staffing costs. Studies show that optimizing AHT improves labor efficiency and allows agents to manage higher call volumes. However, focusing solely on reducing AHT may lead to rushed interactions, which can negatively impact customer satisfaction. Striking the right balance is key.
| Aspect | Description |
|---|---|
| Impact on Efficiency | AHT is a key indicator of operational efficiency, helping to identify areas for process optimization. |
| Customer Satisfaction | AHT affects customer satisfaction; a balance between speed and quality is crucial. |
| Cost Control | Monitoring AHT can lead to potential savings in tools and documentation, optimizing labor costs. |
Sobot’s Voice/Call Center simplifies AHT tracking with real-time analytics and a unified workspace. Agents can access all customer data in one place, reducing the time spent searching for information. Features like AI-powered voicebots also handle repetitive queries, allowing agents to focus on complex issues. By leveraging these tools, you can optimize AHT while maintaining high service quality.
Tip: Regularly review AHT trends to identify training needs and improve workflows. This ensures your team delivers efficient and effective support.
Service Level
Service Level measures the percentage of calls answered within a specific timeframe, such as 20 seconds. This KPI reflects your ability to meet customer demand and maintain responsiveness. The traditional benchmark for Service Level is the 80/20 rule, where 80% of calls should be answered within 20 seconds. However, research shows that calls answered within 120 seconds do not significantly impact customer satisfaction.
This metric is crucial for capacity planning and resource allocation. For instance, if your Service Level consistently falls below the benchmark, it may indicate understaffing or inefficiencies in call routing. Monitoring this KPI helps you identify bottlenecks and make data-driven decisions to improve performance.

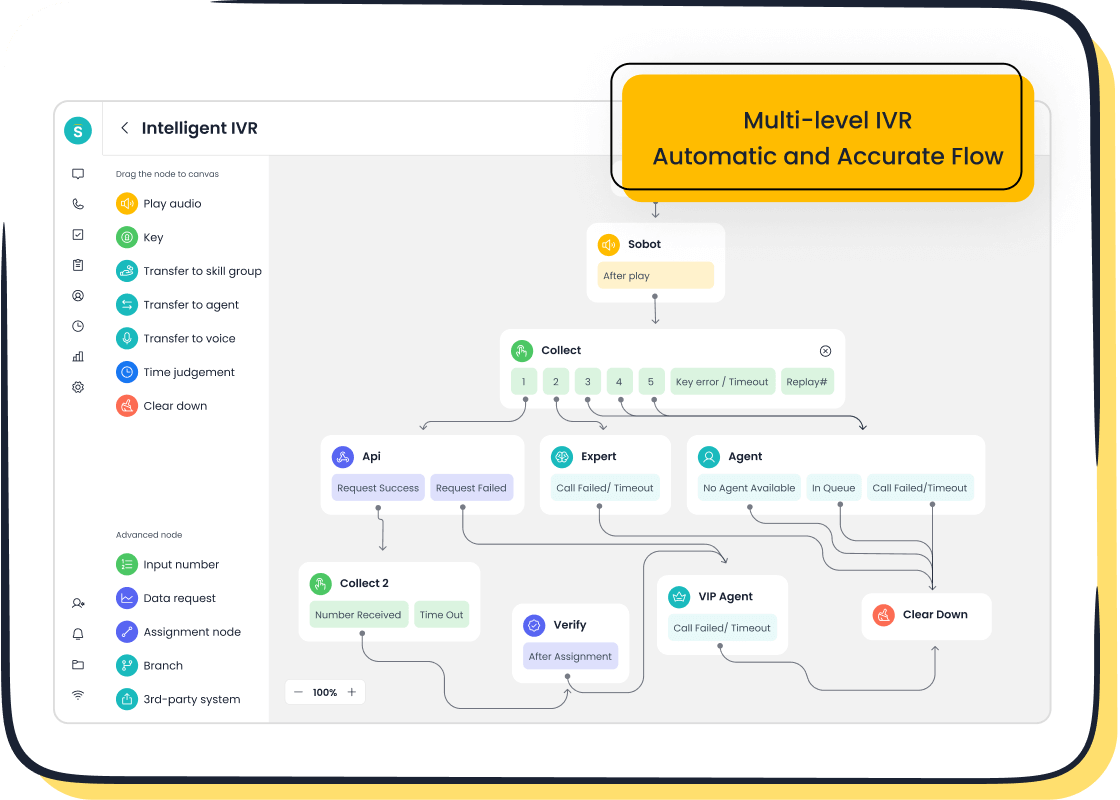
Sobot’s Voice/Call Center enhances Service Level with features like smart call routing and intelligent IVR. These tools ensure calls are directed to the right agent quickly, reducing wait times. Real-time monitoring allows supervisors to track Service Level and make adjustments as needed. By maintaining a high Service Level, you can improve customer satisfaction and reduce call abandonment rates.
Note: Aim to balance Service Level with other performance metrics like AHT and FCR to deliver a seamless customer experience.
Call Abandonment Rate
Call Abandonment Rate measures the percentage of calls that customers hang up before speaking to an agent. A high abandonment rate often indicates long wait times or poor call routing, which can lead to customer frustration. This KPI is a direct reflection of your call center’s efficiency and customer experience.
Reducing abandonment rates requires a proactive approach. For example, implementing features like callback options or estimated wait times can reassure customers and reduce frustration. Studies show that customers are more likely to stay on the line if they know how long they’ll need to wait.
Sobot’s Voice/Call Center addresses this challenge with advanced call tracking and real-time analytics. Supervisors can monitor abandonment rates and identify patterns, such as peak call times or staffing shortages. Smart call routing and AI-powered voicebots further enhance efficiency by ensuring customers are connected to the right agent quickly. These features help you minimize abandonment rates and improve overall performance.
Tip: Regularly analyze call abandonment data to identify trends and implement solutions, such as adjusting staffing levels during peak hours.
Average Speed of Answer (ASA)
Average Speed of Answer (ASA) measures the average time it takes for your agents to answer incoming calls. This KPI reflects how quickly your team responds to customer inquiries, directly impacting customer satisfaction and operational efficiency. A lower ASA indicates faster response times, which can lead to happier customers and fewer abandoned calls.
The industry benchmark for ASA is 29 seconds or less, as shown below:
| Metric | Target Value |
|---|---|
| Average Speed of Answer | 29 seconds or less |
Improving ASA has a ripple effect on other key metrics. For example:
- Faster response times often lead to higher First Call Resolution (FCR) rates.
- Higher FCR rates correlate with improved customer satisfaction.
- Call centers focusing on ASA and FCR tend to achieve better overall performance.
Sobot’s Voice/Call Center helps you optimize ASA with features like smart call routing and intelligent IVR. These tools ensure calls are directed to the right agent quickly, reducing wait times. Additionally, real-time monitoring allows supervisors to track ASA and make adjustments during peak hours. By leveraging these capabilities, you can meet or exceed the industry benchmark and deliver a seamless customer experience.
Tip: Regularly review ASA trends to identify bottlenecks and adjust staffing levels. This proactive approach ensures your team maintains high responsiveness.
Cost Per Call
Cost Per Call (CPC) measures the average cost of handling a single customer call. This KPI is crucial for managing your call center’s budget and operational efficiency. A high CPC can strain your resources, while a low CPC might compromise service quality. Striking the right balance is essential.
Key insights about CPC include:
- High CPC negatively impacts operating costs.
- Low CPC may reduce service quality, leading to dissatisfied customers.
- Determining an appropriate CPC ensures efficiency without sacrificing effectiveness.
Tracking CPC also highlights areas for improvement. For instance, First Call Resolution (FCR) plays a critical role in reducing repetitive calls, saving both time and resources. By identifying training needs and process inefficiencies, you can lower CPC while enhancing customer satisfaction.
Sobot’s Voice/Call Center provides tools to monitor and optimize CPC. Features like AI-powered voicebots handle repetitive queries, reducing agent workload and operational costs. The platform’s real-time analytics offer insights into call handling efficiency, helping you allocate resources effectively. With Sobot, you can achieve a cost structure that aligns with your business goals while maintaining high service standards.
Note: Regularly evaluate CPC alongside other KPIs like FCR and ASA to ensure your call center operates efficiently and delivers exceptional service.
Leveraging Sobot's Call Tracking for Operational Insights
Sobot’s Call Tracking feature offers powerful tools to enhance your call center’s efficiency and customer satisfaction. By analyzing call data, you can uncover patterns, identify bottlenecks, and make data-driven decisions to improve performance.
Here’s how Sobot’s Call Tracking drives results:
- Customer Satisfaction: Companies like Samsung achieved a 97% satisfaction rate after implementing Sobot.
- Agent Efficiency: Sobot improved agent efficiency by 30%, enabling teams to handle more calls without compromising quality.
- Streamlined Operations: Features like a unified workspace reduce the need for agents to switch between platforms, saving time and effort.
For example, Samsung faced challenges with fragmented systems and repetitive inquiries. Sobot’s solution unified their communication channels and automated repetitive tasks, leading to significant improvements in both efficiency and customer experience.
By leveraging Sobot’s Call Tracking, you gain actionable insights into metrics like ASA, FCR, and CPC. These insights empower you to optimize workflows, allocate resources effectively, and deliver a superior customer experience.
Tip: Use Sobot’s customizable dashboards to monitor key metrics in real time. This ensures you stay ahead of potential issues and maintain high performance.
Agent Productivity KPIs to Drive Team Performance

Agent Utilization Rate
Agent Utilization Rate measures the percentage of time agents spend actively handling calls compared to their total available time. This KPI reflects how efficiently your team uses its resources. For example, research highlights its importance in industries like car-sharing services, where utilization rates align with demand and operational efficiency. Similarly, in call centers, a high utilization rate ensures agents remain productive without being overburdened.
Tracking this metric helps you balance workloads and prevent burnout. For instance, if agents spend too much time idle, it may indicate overstaffing or inefficient scheduling. Conversely, excessive utilization can lead to fatigue and reduced service quality. Sobot’s Voice/Call Center addresses these challenges with features like real-time monitoring and smart call routing. These tools optimize agent workloads, ensuring a healthy balance between productivity and well-being.
Tip: Aim for a utilization rate between 75% and 85% to maintain both efficiency and agent satisfaction.
Average Calls Per Agent
Average Calls Per Agent measures the number of calls an agent handles within a specific period. This KPI provides insights into individual productivity and overall team performance. Studies show that improving this metric often involves automating repetitive tasks, offering targeted training, and equipping agents with advanced tools.
For example, Sobot’s unified workspace consolidates customer data, enabling agents to resolve issues faster. AI-powered voicebots handle routine queries, freeing agents to focus on complex interactions. These features not only increase call volume per agent but also enhance service quality. By tracking this KPI, you can identify high-performing agents and replicate their strategies across your team.
Example: A call center using Sobot’s solutions reported a 20% increase in calls handled per agent after implementing workflow automation.
Schedule Adherence
Schedule Adherence measures how closely agents follow their assigned schedules. This KPI directly impacts call center efficiency and customer satisfaction. Poor adherence can lead to longer hold times, agent burnout, or overstaffing, as shown in the table below:
| Impact Area | Description |
|---|---|
| Longer hold times | Insufficient coverage for call volume results in longer wait times for customers. |
| Agent burnout | Low adherence forces fewer agents to handle more calls, leading to frustration and burnout. |
| Overstaffing | Compensating for low adherence can result in too many agents working at once, wasting payroll resources. |
Sobot’s real-time analytics and scheduling tools help you monitor adherence and make adjustments as needed. For example, supervisors can identify patterns of non-adherence and provide targeted coaching. By maintaining high adherence rates, you ensure consistent service levels and reduce operational inefficiencies.
Note: Regularly review adherence data to identify trends and optimize staffing plans.
Agent Turnover Rate
Agent turnover rate measures how often agents leave your call center within a specific period. This KPI is critical because high turnover disrupts operations, increases hiring costs, and impacts customer satisfaction. Tracking this metric helps you identify underlying issues, such as poor work conditions or lack of training, and take corrective actions.
Turnover rates vary across industries and call center types. For example:
- Inbound customer support centers typically experience a turnover rate of 20% to 30%.
- Outbound sales teams face higher rates, ranging from 25% to 35%.
- Technical support and live chat centers see lower rates, between 15% and 25%.
| Call Center Type | General Benchmark Turnover Rate |
|---|---|
| Inbound Customer Support | 20% to 30% |
| Outbound Sales | 25% to 35% |
| Technical Support | 15% to 25% |
| Debt Collection | 30% to 40% |
| Billing and Account Management | 20% to 30% |
| Live Chat or Online Support | 15% to 25% |
Call centers, in general, face turnover rates as high as 30% to 45%. This is significantly higher than industries like real estate (15% to 25%) or insurance (20% to 30%). High turnover not only affects your team’s morale but also reduces overall performance.
Sobot’s Voice/Call Center can help you address this challenge. Its unified workspace simplifies workflows, reducing agent stress and improving job satisfaction. Features like AI-powered voicebots handle repetitive tasks, allowing agents to focus on meaningful interactions. These tools create a supportive environment that encourages agents to stay longer, ultimately lowering turnover rates.
Tip: Regularly monitor turnover rates and gather feedback from agents to identify areas for improvement. A happy team leads to better customer experiences.
How Sobot's Unified Workspace Enhances Agent Productivity

Sobot’s unified workspace is a game-changer for improving agent productivity. It consolidates all customer data, communication channels, and task management tools into a single interface. This eliminates the need for agents to switch between platforms, saving time and reducing errors.
For example, when a customer calls, the unified workspace instantly displays their history, preferences, and past interactions. This allows agents to provide personalized support without asking repetitive questions. Smart call routing ensures that customers connect with the most suitable agent, further streamlining the process.
Key benefits of Sobot’s unified workspace include:
- Improved Efficiency: Agents handle more calls in less time by accessing all necessary information in one place.
- Enhanced Accuracy: Real-time data reduces the risk of errors during interactions.
- Better Morale: Simplified workflows reduce stress, leading to higher job satisfaction.
Samsung, a global leader in technology, experienced a 30% boost in agent efficiency after implementing Sobot’s solutions. This demonstrates how a unified workspace can transform your team’s performance and deliver exceptional customer experiences.
Note: Investing in tools like Sobot’s unified workspace not only improves productivity but also enhances customer satisfaction, creating a win-win situation for your business.
Tracking Call Center KPIs for Benchmarking and Comparison
Importance of Benchmarking Call Center KPIs
Benchmarking your call center KPIs is essential for understanding how your performance compares to industry standards. It helps you identify strengths and weaknesses, enabling you to focus on areas that need improvement. For example, in the healthcare industry, tracking metrics like patient satisfaction and compliance ensures high-quality service delivery. By engaging customers and gathering feedback, you can pinpoint gaps and enhance service quality to meet benchmarks like the 2024 Call Center Standards.
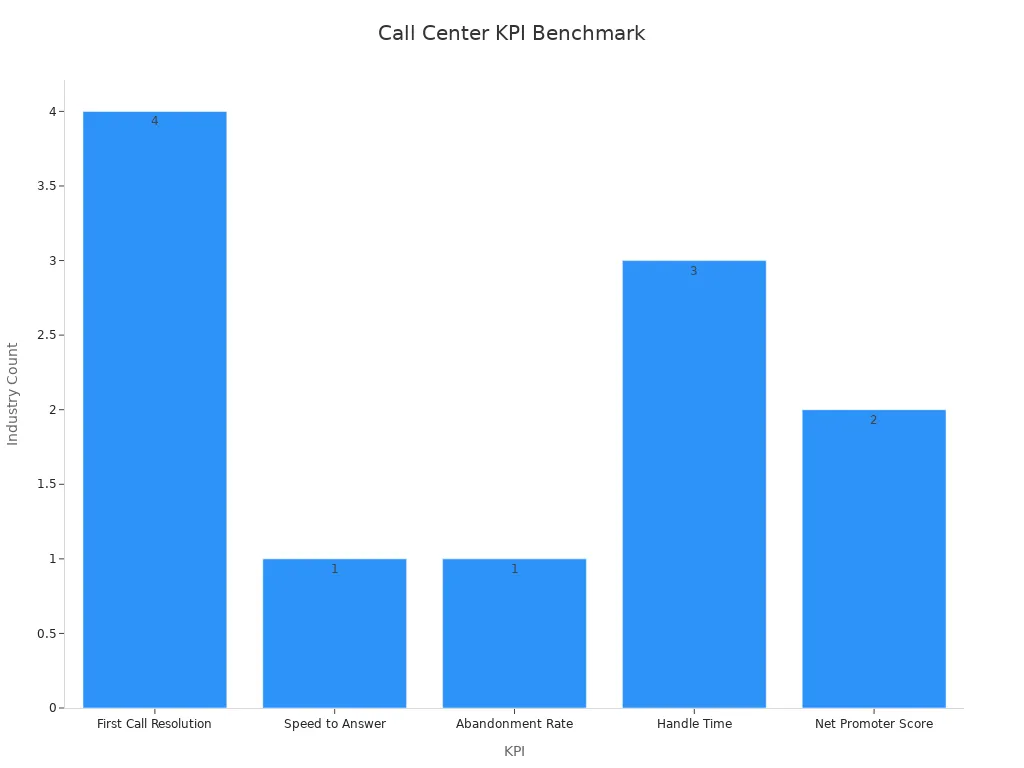
Key KPIs such as First Call Resolution (FCR) and Speed to Answer are critical for industries like healthcare, law, and finance. These metrics reflect how efficiently your team resolves issues and responds to customer needs. Regular benchmarking ensures your call center remains competitive and aligned with customer expectations.
| KPI | Definition | Related Industries |
|---|---|---|
| First Call Resolution | Resolving customer issues on the first call | Healthcare, Law, Finance |
| Speed to Answer | Time taken to answer a call | Healthcare |
| Call Abandonment Rate | Percentage of calls abandoned before reaching an agent | Healthcare |
| Handle Time | Average time to resolve a customer inquiry | Law, Finance, Education |
| Net Promoter Score | Likelihood of customers recommending your service | Finance, Healthcare |
Comparing KPIs Against Industry Standards
Comparing your KPIs to industry benchmarks provides valuable insights into your call center's performance. For instance, the average Call Resolution Rate benchmark is 85%, while the ideal Average Speed of Answer is 20 seconds. A Call Abandonment Rate below 5% indicates efficient operations. These benchmarks help you set realistic goals and measure progress effectively.
| Metric | Benchmark |
|---|---|
| Call Resolution Rate | 85% |
| Average Speed of Answer | 20 seconds |
| Call Abandonment Rate | 5% |
| Agent Utilization Rate | 75-85% |
| Cost Per Call | Varies by industry |
By leveraging tools like Sobot’s Voice/Call Center, you can track these metrics in real time. Features like smart call routing and AI-powered analytics ensure your team meets or exceeds these benchmarks, improving both efficiency and customer satisfaction.
Tools and Resources for Tracking Call Center KPIs
Efficiently tracking call center KPIs requires the right tools and resources. Sophisticated software like Sobot’s Voice/Call Center simplifies this process by offering real-time analytics, customizable dashboards, and unified workspaces. These features allow you to monitor key metrics like ASA, FCR, and Call Abandonment Rate with ease.
Other resources, such as MetricNet, provide industry benchmarks and performance goals for call centers. They emphasize focusing on high-value metrics while avoiding those that add unnecessary costs. To track KPIs effectively, follow these steps:
- List your objectives to define what you want to achieve.
- Assess your current performance to identify gaps.
- Select both financial and non-financial KPIs for a balanced view.
- Use advanced tools like Sobot’s platform to streamline tracking and analysis.
Tip: Regularly review your KPIs and adjust strategies to stay aligned with industry standards and customer expectations.
Setting Realistic Goals Based on Benchmarks
Setting achievable goals for your call center starts with understanding industry benchmarks. These benchmarks provide a reference point to evaluate your performance and identify areas for improvement. By aligning your objectives with these standards, you can create realistic targets that drive success.
Here are three steps to guide your goal-setting process:
- Define Clear KPIs: Identify key metrics like Average Handle Time (AHT), First Call Resolution (FCR), and Customer Satisfaction Score (CSAT). These indicators measure efficiency and customer experience.
- Leverage Benchmarking Tools: Compare your performance against industry averages. For example, the ideal FCR rate is 85%, while a CSAT score above 75% is considered good.
- Analyze Trends: Use historical data to spot patterns and predict future performance. This helps you set goals that are both challenging and attainable.
Sobot’s Voice/Call Center simplifies this process with real-time analytics and customizable dashboards. These tools allow you to track call center KPIs effortlessly and compare them to industry standards. For instance, Samsung used Sobot’s solutions to achieve a 97% customer satisfaction rate, demonstrating the power of data-driven goal setting.
Tip: Regularly review your goals to ensure they remain relevant as customer expectations evolve. Adjust your targets based on new insights to maintain a competitive edge.
Continuous Improvement Through KPI Analysis with Sobot
Continuous improvement requires ongoing analysis of your call center KPIs. This approach ensures your team adapts to changing demands and consistently delivers high-quality service. Sobot’s solutions provide the tools you need to monitor performance and implement data-driven strategies.
The table below highlights how performance analytics and tools support continuous improvement:
| Aspect | Details |
|---|---|
| Role | Marketing Operations and Business Intelligence Manager |
| Performance Analytics | Oversee the transformation, analysis, and interpretation of marketing data. |
| Statistical Models | Utilize statistical models and forecasting techniques to predict market trends and monitor KPIs. |
| Tools | Leverage tools such as Power BI, Salesforce, Marketo, and Power Automate for reporting and analysis. |
Sobot’s Voice/Call Center integrates advanced analytics with features like smart call routing and AI-powered voicebots. These tools help you identify inefficiencies and optimize workflows. For example, real-time monitoring allows you to track metrics like Average Speed of Answer (ASA) and Call Abandonment Rate, ensuring your team meets performance goals.
By adopting a continuous improvement mindset, you can enhance customer satisfaction and operational efficiency. Sobot’s solutions empower you to stay ahead of industry trends and deliver exceptional service.
Note: Continuous improvement is not a one-time effort. Regularly analyze your KPIs to uncover new opportunities for growth.
Tracking call center KPIs is essential for improving customer satisfaction, operational efficiency, and agent performance. These metrics provide actionable insights that help you enhance the customer experience and streamline processes. Sobot's Voice/Call Center equips you with tools like real-time analytics and smart call routing to achieve these goals. By adopting a data-driven approach and leveraging benchmarking, you can stay competitive and deliver exceptional satisfaction. Start optimizing your operations today with Sobot’s innovative solutions to meet evolving customer expectations.
FAQ
What are the most important call center KPIs to track?
The most critical KPIs include Customer Satisfaction Score (CSAT), First Call Resolution (FCR), Average Handle Time (AHT), and Net Promoter Score (NPS). These metrics measure customer satisfaction, operational efficiency, and agent productivity. Tools like Sobot’s Voice/Call Center simplify tracking these KPIs with real-time analytics and dashboards.
How can I improve my call center’s First Call Resolution (FCR)?
You can enhance FCR by equipping agents with a unified workspace that consolidates customer data. Sobot’s Voice/Call Center provides smart call routing and AI-powered tools, enabling agents to resolve issues faster. Studies show a 1% increase in FCR boosts customer satisfaction by 1%.
Tip: Train agents to handle complex queries effectively to improve FCR rates.
Why is Average Handle Time (AHT) important for call centers?
AHT measures the efficiency of your call center operations. Lower AHT indicates faster resolutions, reducing costs and improving customer satisfaction. However, balance speed with quality. Sobot’s AI-powered voicebots handle repetitive tasks, helping agents focus on meaningful interactions and optimizing AHT.
How does Sobot help reduce call abandonment rates?
Sobot’s Voice/Call Center uses smart call routing and real-time analytics to minimize wait times. Features like callback options reassure customers, reducing frustration. For example, Samsung achieved a 97% customer satisfaction rate by implementing Sobot’s solutions, which streamlined operations and improved response times.
What tools can I use to track call center KPIs effectively?
Advanced platforms like Sobot’s Voice/Call Center offer real-time analytics, customizable dashboards, and unified workspaces. These tools help you monitor KPIs like CSAT, FCR, and AHT effortlessly. External resources like MetricNet also provide industry benchmarks for comparison.
Note: Regularly review your KPIs to ensure alignment with industry standards and customer expectations.
See Also
Best Call Center Analytics Tools You Need in 2024
Enhancing Call Center Efficiency Through Effective Monitoring
Essential Practices for Quality Management in Call Centers
Comprehensive Review of Leading Contact Center Solutions 2024
