Master Call Center Data Analytics With These 10 KPIs

Your goal for 2025 is clear: transform raw data into a strategic asset. You can achieve this with effective call center data analytics. These 10 call center KPIs are your foundational tools, not just a simple checklist. Mastering analytics means asking the right questions. Each key performance indicator and KPI provides answers about customer happiness, agent performance, and operational health. The Sobot call center, powered by Sobot AI, helps you track these call center KPIs to unlock powerful insights.
KEY KPIS FOR CUSTOMER SATISFACTION & LOYALTY
Happy customers form the bedrock of a successful business. They buy more, stay longer, and tell their friends about you. The following four customer experience metrics are essential for understanding how your customers truly feel. Tracking these call center KPIs gives you the power to turn customer feedback into lasting customer loyalty.
1. CUSTOMER SATISFACTION (CSAT)
Customer Satisfaction (CSAT) measures how happy a customer is with a specific interaction, product, or service. You typically gather this data by asking a simple question like, "How satisfied were you with your experience today?"
How to Calculate CSAT:
You calculate your Customer Satisfaction Score by focusing on positive responses. On a common 5-point scale, you count customers who gave a rating of 4 (satisfied) or 5 (very satisfied).
Formula: (Number of Satisfied Customers / Total Number of Survey Responses) x 100 = CSAT Score %
For example, if 780 of your 1,000 survey respondents give you a 4 or 5, your CSAT score is 78%.
Why It's Critical:
CSAT is a direct pulse check on your service quality. It helps you pinpoint strengths and weaknesses in your customer experience. A high score shows your team is meeting and exceeding expectations. In fact, companies with a CSAT score above 85% often see 25% lower customer churn.
Leading companies like Samsung use integrated solutions to drive exceptional results. By implementing Sobot's all-in-one contact center platform to unify channels and provide intelligent service, Samsung achieved an incredible 97% customer satisfaction rate. This demonstrates the powerful impact of a well-managed contact center on the customer experience.
2. NET PROMOTER SCORE (NPS)
Net Promoter Score (NPS) measures long-term customer loyalty. It asks one crucial question: "On a scale of 0-10, how likely are you to recommend our company to a friend or colleague?" Based on their answers, you group customers into three categories.
- Promoters (Score 9-10): Your biggest fans. These loyal customers fuel your growth through repeat business and referrals.
- Passives (Score 7-8): They are satisfied but not enthusiastic. They are vulnerable to offers from your competitors.
- Detractors (Score 0-6): Unhappy customers. They can damage your brand with negative word-of-mouth.
How to Calculate NPS:
The calculation ignores Passives and focuses on the ratio of Promoters to Detractors.
Your NPS can range from -100 to +100.
Why It's Critical:
NPS provides a high-level view of brand health and predicts business growth. Studies show that companies with an NPS greater than 50 grow 2.5 times faster than their peers. Tracking this KPI helps you understand your overall brand perception. Using a platform like Sobot to monitor all your contact center metrics helps you make targeted improvements that directly boost your NPS, a core benefit of our solutions.
3. FIRST CONTACT RESOLUTION (FCR)
First Contact Resolution (FCR), also known as First Call Resolution, measures the percentage of customer issues resolved during the very first interaction. No follow-up calls, emails, or transfers are needed.
How to Calculate FCR:
To calculate this metric, you need to clearly define what counts as a "resolution." Once you have that, the formula is straightforward.
Why It's Critical:
A high First Contact Resolution rate is a win-win. Customers are happier because their problems are solved quickly, and your operations become more efficient.
- Reduces Costs: A 1% improvement in FCR can save a mid-sized contact center over $15,000 per month. Resolving issues on the first try eliminates costly follow-up interactions.
- Reduces Churn: Research shows 80% of customers who switched to a competitor would have stayed if their issue had been resolved on the first contact. A high FCR is a powerful retention tool.
Improving your first response time and empowering agents with the right tools are key to boosting your First Contact Resolution rate.
4. CUSTOMER EFFORT SCORE (CES)
Customer Effort Score (CES) is one of the most predictive customer experience metrics. It measures how much effort a customer had to put in to get their issue resolved. You collect this customer feedback by asking a question like, "How easy was it to handle your request?" on a scale from "Very Difficult" to "Very Easy."
How to Calculate CES:
One common method is to find the average of all responses.
Formula: (Sum of All CES Ratings) / (Number of Survey Responses) = CES
Why It's Critical:
Modern customers value speed and convenience. A low-effort experience is a strong driver of loyalty. The data is clear: 94% of customers who have a low-effort interaction intend to repurchase from that company. In contrast, 96% of customers with high-effort experiences become disloyal.
Improving this metric has a direct financial impact. For every 1-point improvement in your CES, customer retention rates can increase by 8%. By focusing on making interactions seamless, you not only improve customer satisfaction but also build a more profitable and loyal customer base. Tracking these call center metrics is fundamental to creating an effortless customer experience.
CORE CALL CENTER KPIS FOR AGENT PRODUCTIVITY
Your agents are the engine of your contact center. Their performance directly impacts customer satisfaction and your bottom line. Strong agent productivity ensures you handle customer inquiries with speed and skill. These next three call center metrics help you measure and manage your team's efficiency. They provide the data you need to coach effectively, optimize workloads, and prevent agent burnout and attrition.
5. AVERAGE HANDLE TIME (AHT)
Average Handle Time (AHT) is the average duration of a single customer interaction from start to finish. This includes the customer's initial hold time, the talk time with the agent, and any After-Call Work (ACW) the agent completes to resolve the issue. It is a core measure of agent productivity and operational efficiency.
How to Calculate AHT:
You calculate this KPI by adding your total talk time, total hold time, and total after-call work time. Then, you divide that sum by the total number of calls.
Formula: (Total Talk Time + Total Hold Time + Total After-Call Work) / Total Number of Calls = Average Handle Time
Why It's Critical:
AHT is a fundamental metric for measuring your call center's efficiency. A lower average handling time often means agents are resolving issues faster, which allows them to handle more interactions. However, you must balance AHT with quality. Rushing agents can lead to poor service and lower FCR rates. The goal is to reduce AHT by improving processes, not by cutting corners.

Modern call center solutions are designed to improve this metric. For example, Sobot's Voice/Call Center provides a Unified Workspace that centralizes all customer information. This eliminates the need for agents to switch between multiple screens, which can reduce call handling time by 20-50%. Agents can find information faster, leading to a lower average resolution time.
Here are some strategies to lower your average resolution time without sacrificing quality:
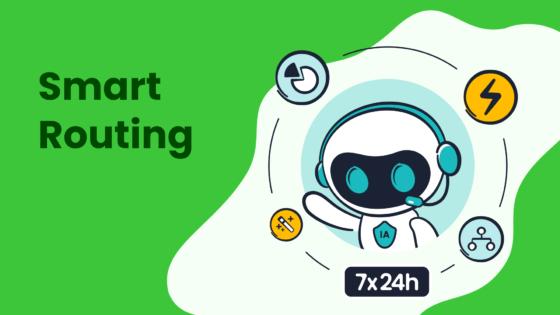
- Optimize Call Routing: Use smart routing to connect customers to the agent best equipped to handle their issue on the first try.
- Build a Knowledge Base: Give agents instant access to answers, reducing the time they spend searching for information.
- Automate After-Call Work: Use AI and automation to handle routine tasks like call summaries and data entry. This significantly reduces a key component of the total resolution time.
By using the real-time Monitoring and Analysis tools in the Sobot platform, you can track AHT and other agent performance metrics to identify where your team can improve its efficiency.
6. AGENT UTILIZATION RATE
The Agent Utilization Rate measures the percentage of time agents spend on productive, work-related tasks compared to their total available time. Productive tasks include handling calls, responding to emails, and completing after-call work. This KPI helps you understand how effectively you are using your agents' paid time.
How to Calculate Agent Utilization Rate:
You calculate this rate by dividing the agent's total productive time by their total available time.
Formula: (Total Productive Time / Total Available Time) x 100 = Utilization Rate %
Why It's Critical:
This metric is all about finding the right balance. A low rate suggests you may be overstaffed or that agents have too much idle time. A high rate indicates strong agent productivity. However, an extremely high rate is a major red flag.
⚠️ Warning: Avoid High-Utilization Burnout Pushing for 100% utilization is a recipe for disaster. It leaves no room for training, team meetings, or even short mental breaks. Consistently high rates above 85% lead to:
- Agent Burnout: Exhausted employees become disengaged, which increases sick days and attrition.
- Poor Work Quality: Rushed agents make more mistakes, hurting your CSAT and FCR scores.
- High Attrition: Overworked agents are more likely to leave, increasing your hiring and training costs.
An optimal utilization rate is typically between 80% and 90%. This range ensures high efficiency while protecting your team from burnout and preventing high attrition. Sobot's analytics dashboard gives you a clear view of this contact center metric, helping you manage workloads and maintain a healthy, productive team.
7. ADHERENCE TO SCHEDULE
Adherence to Schedule measures how well your agents stick to their planned work schedule. This includes not just their start and end times, but also their scheduled breaks, lunches, and training sessions. It is a critical metric for workforce management and operational efficiency.
How to Calculate Adherence to Schedule:
You calculate adherence by dividing the total time an agent was available for work as scheduled by their total scheduled work time.
Formula: (Time Worked as Scheduled / Total Scheduled Time) x 100 = Adherence Rate %
For example, if an agent is scheduled for 420 minutes but only works 400 of those scheduled minutes, their adherence is 95.2%.
Why It's Critical:
Low schedule adherence directly harms your customer experience. When agents are not available as planned, it leads to understaffing. This causes longer hold times, higher call abandonment rates, and frustrated customers. The agents who are following the schedule become overburdened, which can lead to stress, burnout, and attrition.
High adherence is essential for:
- Meeting Service Levels: Ensures you have the right number of agents available to handle incoming call volume.
- Cost Optimization: Reduces the need for costly overtime and helps you forecast staffing needs accurately.
- Fairness and Morale: Promotes a sense of fairness when all team members follow the same schedule expectations.
Tracking this KPI with a tool like Sobot's real-time Monitoring and Analysis dashboard helps you maintain operational control. You can spot patterns of non-adherence, address issues proactively, and ensure your call center runs like a well-oiled machine. This focus on agent performance metrics is key to improving your average resolution time and overall efficiency.
OPERATIONAL & FINANCIAL CALL CENTER METRICS
Strong operational and financial health is the backbone of a sustainable contact center. These final three call center metrics help you connect your daily operations directly to your budget. You can use them to optimize resource allocation, control costs, and maximize your return on investment. Mastering these numbers is key to building a case for new tools and strategies that increase operational efficiency.
8. COST PER CONTACT
Cost Per Contact measures the total expense associated with handling a single customer interaction. This KPI helps you understand the financial efficiency of your support operations across different channels.
How to Calculate Cost Per Contact:
You calculate this by dividing your total operational costs by the total number of contacts handled over a specific period.
Formula: Total Contact Center Costs / Total Number of Contacts = Cost Per Contact
The industry average cost per contact is around $7.16, but this can vary.
Why It's Critical:
This metric directly ties your operational efficiency to your budget. A high Cost Per Contact can signal inefficiencies in your processes or staffing. Your goal is to lower this cost without hurting customer satisfaction. You can improve efficiency by:
- Using Self-Service: Over 67% of customers prefer self-service. AI-powered chatbots can handle simple questions, reducing agent workload.
- Optimizing Call Routing: Smart routing connects customers to the right agent faster, improving First Contact Resolution and lowering handle times.
- Focusing on Key Metrics: A 1% improvement in FCR can reduce your call center costs by 1%.
9. CALL ABANDONMENT RATE
The Call Abandonment Rate is the percentage of callers who hang up before connecting with an agent. These are lost opportunities to help a customer and can signal major issues with your wait times.
How to Calculate Call Abandonment Rate:
You calculate this rate by dividing the number of abandoned calls by the total number of incoming calls.
Formula: (Number of Abandoned Calls / Total Number of Incoming Calls) x 100 = Call Abandonment Rate %
Why It's Critical:
A high abandonment rate is a direct drain on your revenue. Each abandoned call can cost a business around $50 in lost opportunity. The industry benchmark for this rate is 5% or lower. A high rate tells you that customers are getting frustrated in your queue. This hurts both your revenue and your brand reputation. Reducing this rate improves customer experience and protects your bottom line.
10. SERVICE LEVEL
Service Level measures your team's accessibility to your customers. It is one of the most important service level metrics. It tracks the percentage of calls answered within a specific time threshold. A common industry standard is the "80/20 rule," which means answering 80% of calls within 20 seconds.
How to Calculate Service Level:
You calculate your service level rate by dividing the number of calls answered within your target time by the total number of calls answered.
Formula: (Calls Answered Within Threshold / Total Calls Answered) x 100 = Service Level %
Why It's Critical:
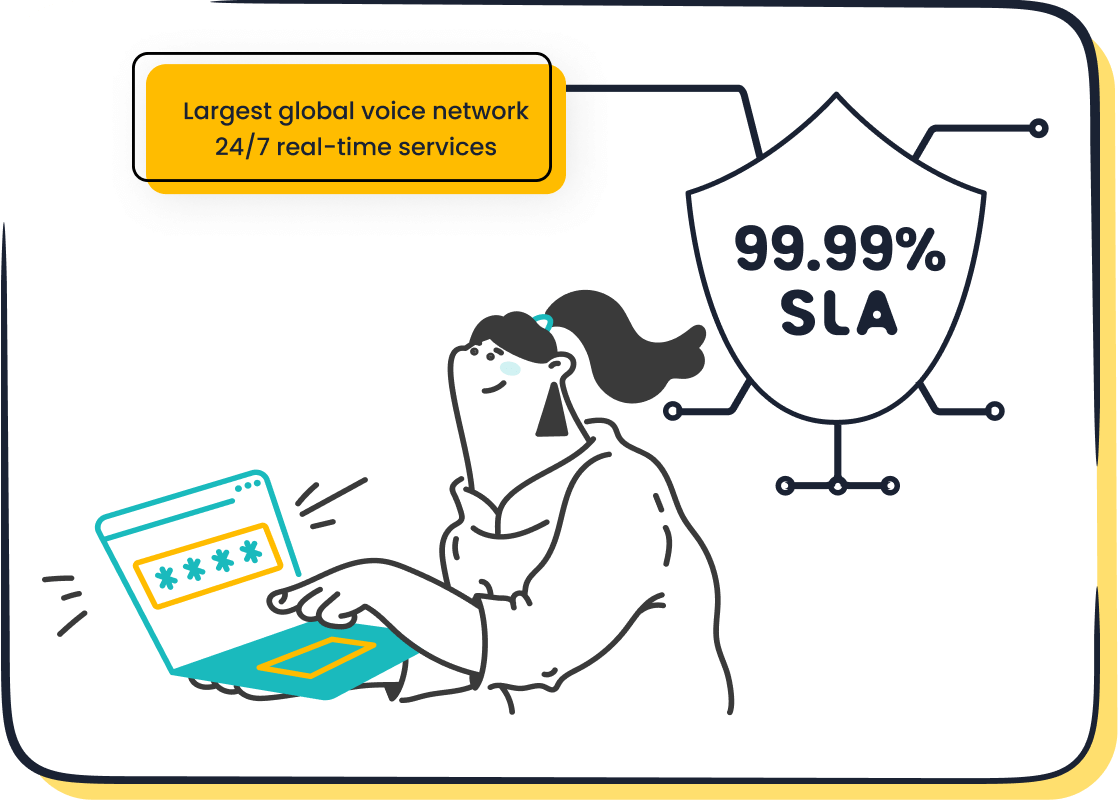
Meeting your service level metrics consistently is a sign of a high-performing contact center. It shows you have the right number of agents available to meet customer demand. However, you cannot achieve this without a stable system. Unplanned downtime makes it impossible to meet your targets. That is why a reliable platform is essential. Sobot's Voice/Call Center is built on a stable system with a 99.99% SLA, giving you the confidence to meet your service level metrics day after day. This high efficiency helps you manage your contact center metrics effectively.
ACTIVATING INSIGHTS WITH CALL CENTER DATA ANALYTICS
Tracking metrics is only the first step. True mastery of call center data analytics comes from turning those numbers into decisive action. You need a system that connects your data to your daily operations. This is how you move from simply collecting information to driving real business results. The Sobot Omnichannel Solution acts as the engine for this transformation, turning raw data into your most powerful strategic asset.
LEVERAGE ANALYTICS DASHBOARDS
You cannot act on data you cannot see clearly. An effective dashboard brings all your information together in one place. The Sobot platform integrates every KPI into a single, actionable view. This allows you to:
- See the Full Picture: Combine data from voice, live chat, and social media to understand the complete customer journey.
- Analyze Customer Intent: Use sentiment analysis on call transcripts to see if customers are happy, neutral, or frustrated.
- Connect Your Systems: Seamless CRM integration gives agents instant access to customer history, making every interaction smarter and faster.
This unified approach to call center data analytics helps you quickly identify pain points and opportunities.
IMPLEMENT TARGETED COACHING
Great coaching is built on specific, objective data. Vague feedback does not help agents improve. With clear analytics, you can pinpoint exact areas for development and create personalized coaching plans.
For example, your dashboard might show an agent's Average Handle Time (AHT) is 450 seconds, well above your 300-second target. You can now set a SMART goal with them: reduce AHT to 350 seconds within four weeks by improving system knowledge.
This data-driven method helps you optimize agent performance. It transforms performance reviews from difficult conversations into collaborative problem-solving sessions. Using Sobot's analytics, you can easily spot which kpi needs attention for each team member.
OPTIMIZE WORKFLOWS AND PROCESSES
You can use call center data analytics to make your entire operation more efficient. Sobot’s intelligent tools use real-time data to automate and improve your processes.
- Sobot’s Smart Call Routing analyzes caller history and intent to connect customers to the best-qualified agent on the first try. This directly improves FCR and lowers call abandonment rates.
- The AI-powered Voicebot handles common, repetitive questions. This frees up your human agents to focus on complex issues that require their expertise.
These tools use your analytics to build smarter, more responsive workflows. They reduce manual effort and ensure your resources are always focused where they matter most.
Mastering call center data analytics is an ongoing journey. You must track the right KPI, analyze the insights, and take decisive action. These 10 metrics, powered by an integrated platform like Sobot, provide a complete view of your performance. You can move beyond simple data collection to build a smarter, more responsive operation.
Ready to transform your contact center? Embark on Your Contact Journey and learn more at https://www.sobot.io/.
FAQ
Which KPI should I focus on first?
Start with Customer Satisfaction (CSAT) and First Contact Resolution (FCR). These two KPIs give you a quick, powerful view of your customer experience and operational efficiency. They provide a solid foundation for your call center data analytics strategy.
Do I need special software to track these contact center metrics?
Yes, an integrated platform is essential. Sobot's Omnichannel Solution automatically tracks these KPIs in a single dashboard. This saves you time and helps you see the complete picture of your call center's performance without manual effort.
How can I lower Average Handle Time (AHT) without hurting quality? ⏱️
Use tools that boost efficiency. Sobot’s Unified Workspace gives agents instant access to customer data, reducing search time. Also, use AI-powered Voicebots to handle simple queries. This frees up your agents for more complex issues, improving key agent performance metrics.
How does improving these KPIs impact my business's bottom line?
Improving KPIs like FCR and Cost Per Contact directly reduces operational expenses. Better CSAT and NPS scores increase customer loyalty and retention. Effective call center data analytics turns your support center from a cost center into a profit driver.
See Also
Discovering the Leading 10 Call Center Analytics Software Solutions for 2024
Implementing Essential Quality Management Best Practices for Call Center Success
Exploring the Premier 10 Speech Analytics Tools for Call Centers in 2024
Elevating Call Center Performance Through Effective Monitoring Strategies and Techniques
A Comprehensive Guide to Quality Management System Principles for Call Centers
