Step-by-Step Guide to Calculating Net Promoter Scores
Net Promoter Score (NPS) is a simple yet powerful metric to evaluate customer loyalty. You calculate it by subtracting the detractor percentage from the promoter percentage in your NPS survey results. This score helps you understand whether your customers are likely to recommend your business or share negative feedback.

Why does NPS matter? It drives business growth. For instance, companies with higher average net promoter scores experience increased upsell revenue and customer retention. Philips Lighting found accounts with rising NPS achieved 70% revenue growth, while declining NPS led to a 24% drop. By understanding NPS drivers, you can improve customer satisfaction surveys, enhance customer experience quality, and foster loyalty. Tools like Sobot’s Voice/Call Center make collecting and analyzing NPS survey data easier, helping businesses deliver better customer experiences.
What is the Net Promoter Score (NPS)?

Definition and Purpose of NPS
The Net Promoter Score (NPS) is a widely used metric that measures customer loyalty and satisfaction. It’s calculated by subtracting the percentage of Detractors (customers who rate their experience poorly) from the percentage of Promoters (customers who enthusiastically recommend your business). This simple formula provides a clear picture of your customers' overall sentiment.
| Calculation Method | Description |
|---|---|
| NPS Calculation | NPS = % Promoters - % Detractors |
| Example | If 70% are Promoters and 10% are Detractors, the NPS would be 70 - 10 = 60 |
Businesses across industries use NPS surveys to assess customer health and track trends in customer satisfaction. The single-question format makes it easy to implement and analyze, helping you identify areas for improvement in your customer experience. Regularly calculating NPS allows you to monitor loyalty over time and make data-driven decisions to enhance customer interactions.
How NPS Reflects Customer Loyalty
NPS directly correlates with customer loyalty. Promoters, who rate their experience 9 or 10, are likely to stay loyal to your brand and recommend it to others. Passives, scoring 7 or 8, are neutral and may switch to competitors if offered a better deal. Detractors, scoring 0 to 6, are dissatisfied and often share negative feedback.
| Category | Rating Scale | Characteristics |
|---|---|---|
| Promoters | 9-10 | Enthusiastic customers who spread positive word of mouth and are less likely to switch brands. |
| Passives | 7-8 | Neutral customers who may churn if a better deal arises and are often overlooked in NPS analysis. |
| Detractors | 0-6 | Unhappy customers likely to switch to competitors and spread negative feedback. |
By categorizing responses, NPS helps you understand the distribution of customer sentiment. For example, if 75% of your customers are Promoters, your business enjoys strong customer loyalty. However, a high percentage of Detractors signals the need for immediate action to improve customer health.
The NPS Scale: Promoters, Passives, and Detractors
The NPS scale divides customers into three groups based on their likelihood to recommend your business:
- Promoters (9-10): These customers are your biggest advocates. They actively promote your brand and contribute to positive word-of-mouth marketing.
- Passives (7-8): Passives are satisfied but not enthusiastic. They may switch to competitors if offered better options.
- Detractors (0-6): Detractors are unhappy customers who can harm your brand reputation through negative feedback.

Understanding this scale helps you focus on improving customer satisfaction and loyalty. For instance, using Sobot’s Voice/Call Center, you can collect NPS survey data and analyze trends to identify areas where your customer experience needs enhancement. This approach ensures you address Detractors’ concerns while nurturing Promoters to maintain a high average net promoter score.
How to Calculate Net Promoter Score Step-by-Step

Step 1: Collect Responses Using the NPS Question
To calculate NPS, you first need to gather responses from your customers. The NPS question is simple: “How likely are you to recommend [product or service] to a friend or colleague?” Customers respond on a scale from 0 to 10, with 0 being "not at all likely" and 10 being "extremely likely."
For the best results:
- Include an open text field alongside the NPS question. This allows customers to explain their score, providing valuable qualitative feedback.
- Position the NPS question at the beginning of your survey. Research shows this placement yields higher response rates and more accurate results.
- Keep surveys concise and mobile-friendly. Short surveys encourage participation and ensure accessibility across devices.

For example, Sobot’s Voice/Call Center makes it easy to distribute NPS surveys via phone or email. Its unified workspace consolidates responses, enabling you to analyze customer feedback efficiently. By using tools like this, you can streamline the process and focus on improving customer satisfaction.
Step 2: Categorize Customers into Promoters, Passives, and Detractors
Once you collect responses, categorize customers based on their scores:
- Promoters (9-10): These are your loyal customers who actively recommend your business.
- Passives (7-8): These customers are satisfied but not enthusiastic. They may switch to competitors if offered a better deal.
- Detractors (0-6): These are dissatisfied customers who might share negative feedback and harm your brand’s reputation.
| Category | Score Range | Description |
|---|---|---|
| Promoters | 9-10 | Enthusiastic loyalists who recommend your brand and drive growth. |
| Passives | 7-8 | Neutral customers who could easily switch to competitors. |
| Detractors | 0-6 | Unhappy customers who may damage your reputation through negative feedback. |
This categorization helps you understand customer loyalty and identify areas for improvement. For instance, if 60% of your customers are Promoters, your business enjoys strong loyalty. However, a high percentage of Detractors signals the need for immediate action to enhance the customer experience.
Step 3: Calculate the Percentage of Promoters and Detractors
After categorizing responses, calculate the percentage of Promoters and Detractors. Use the following formulas:
- Percentage of Promoters:
(Number of Promoters / Total Responses) x 100 - Percentage of Detractors:
(Number of Detractors / Total Responses) x 100
For example, if you survey 1,000 customers and receive the following responses:
- 600 Promoters (60%)
- 200 Passives (not included in the calculation)
- 200 Detractors (20%)
The percentages are:
- Promoters:
(600 / 1,000) x 100 = 60% - Detractors:
(200 / 1,000) x 100 = 20%

These percentages are essential for the final NPS calculation. Tools like Sobot’s Voice/Call Center simplify this process by automatically categorizing responses and calculating percentages. This saves time and ensures accuracy, allowing you to focus on interpreting the results and improving customer loyalty.
Step 4: Apply the NPS Formula: % Promoters - % Detractors
Once you have the percentages of promoters and detractors, you can calculate your NPS using the simple formula:
NPS = % Promoters - % Detractors
This calculation gives you a single number that represents your customers' loyalty and satisfaction. For example, if 60% of your customers are promoters and 20% are detractors, your NPS would be:
NPS = 60% - 20% = 40
An NPS of 40 indicates a positive customer experience, as the percentage of promoters significantly outweighs detractors. The higher the score, the better your customer loyalty.
Tip: Always exclude passives from the calculation. While they are neutral, they do not actively promote or harm your brand.
Using tools like Sobot’s Voice/Call Center can simplify this process. The platform automatically calculates your NPS by categorizing responses and applying the formula. This saves time and ensures accuracy, allowing you to focus on interpreting the results and improving customer satisfaction.
Example Calculation of NPS for Sobot's Voice/Call Center
Let’s see how you can calculate your NPS using an example from Sobot’s Voice/Call Center. Imagine you conducted an NPS survey with 1,000 customers. Here’s the breakdown of responses:
- 700 customers rated their experience as 9 or 10 (Promoters).
- 150 customers gave a score of 7 or 8 (Passives).
- 150 customers rated their experience between 0 and 6 (Detractors).
First, calculate the percentages:
- Promoters:
(700 / 1,000) x 100 = 70% - Detractors:
(150 / 1,000) x 100 = 15%
Now, apply the NPS formula:
NPS = % Promoters - % Detractors
NPS = 70% - 15% = 55
An NPS of 55 is an excellent score, indicating strong customer loyalty and satisfaction. This result shows that most customers are enthusiastic about Sobot’s Voice/Call Center and are likely to recommend it to others.

Sobot’s Voice/Call Center makes it easy to collect and analyze NPS survey data. Its unified workspace consolidates responses, while features like call tracking and data analytics provide deeper insights into customer behavior. By leveraging these tools, you can identify trends, address detractor concerns, and enhance the overall customer experience.
Note: Regularly monitoring your NPS helps you track changes in customer sentiment over time. This allows you to take proactive steps to maintain high levels of satisfaction and loyalty.
Interpreting Your NPS Results
Understanding the NPS Score Range (-100 to 100)
The Net Promoter Score (NPS) ranges from -100 to +100, offering a clear snapshot of customer sentiment. A score closer to +100 indicates strong customer loyalty, while a negative score signals dissatisfaction. This range helps you understand how well your business meets customer expectations.
For example, if 70% of your customers are Promoters and 20% are Detractors, your NPS would be +50. This score reflects a loyal customer base. On the other hand, an NPS of -20 suggests more Detractors than Promoters, highlighting areas needing improvement.
| Description | Percentage | Calculation | NPS Score |
|---|---|---|---|
| Promoters | 70% | ||
| Passives | 10% | ||
| Detractors | 20% | NPS = 70% - 20% | +50 |
| NPS Range | -100 to +100 | Higher scores indicate a more loyal customer base |
Statistical tools like confidence intervals and sample size estimation can refine your interpretation of NPS results. Confidence intervals provide a range where the true NPS score likely falls, while sample size estimation ensures your survey results are reliable.
| Statistical Analysis Type | Description |
|---|---|
| Confidence Intervals | Provides a range of values that likely contain the true NPS score. |
| Tests of Statistical Significance | Determines if the observed differences in NPS scores are statistically significant. |
| Sample Size Estimation | Helps in determining the number of responses needed for reliable NPS results. |

By leveraging tools like Sobot’s Voice/Call Center, you can automate NPS calculations and access real-time insights. Its analytics features simplify interpreting NPS trends, enabling you to act quickly on customer feedback.
What is an Average Net Promoter Score in Your Industry?
Average NPS scores vary across industries, reflecting differences in customer expectations and experiences. For instance, industries like construction and consulting often achieve higher scores due to personalized services, while sectors like internet service providers struggle with lower averages.
| Industry | Lower Quartile | Median | Upper Quartile |
|---|---|---|---|
| Construction | 40 | 64 | 81 |
| Consulting | 42 | 48 | 72 |
| Education | 38 | 60 | 75 |
| Finance | 34 | 59 | 80 |
| Financial Services | 35 | 60 | 78 |
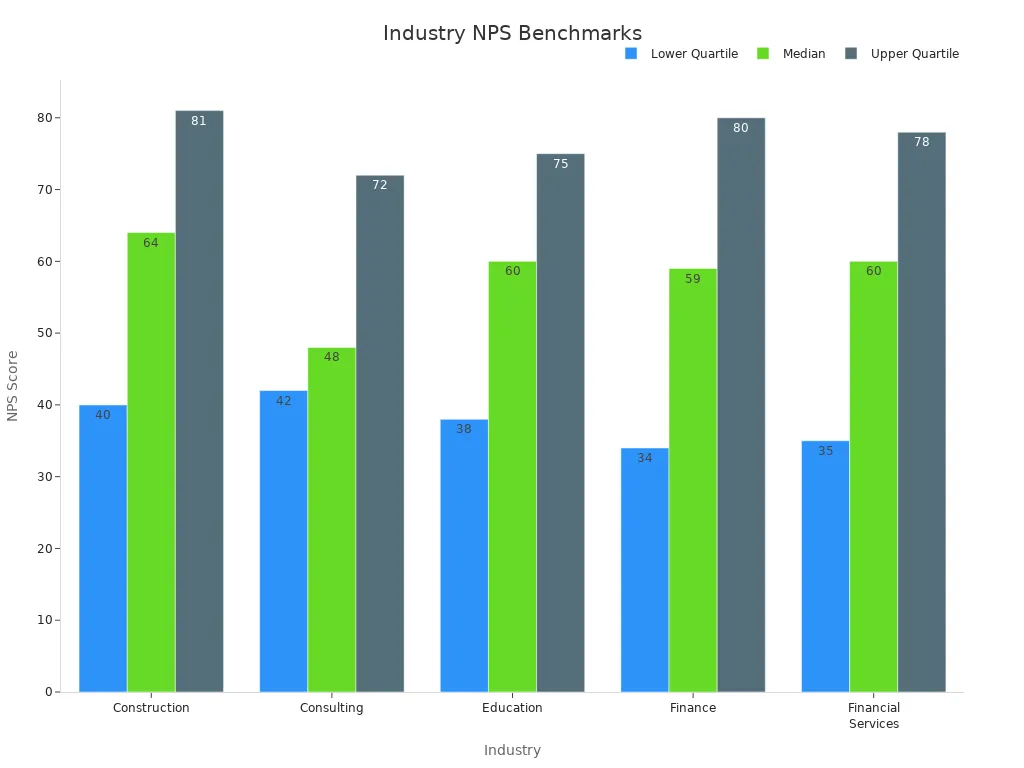
Understanding these benchmarks helps you evaluate your NPS score in context. If your score exceeds the median for your industry, it indicates strong customer satisfaction. For example, a financial services company with an NPS of 65 performs above average, signaling effective customer experience strategies.
Sobot’s Omnichannel Solution can help you achieve higher NPS scores by streamlining customer interactions across channels. Its unified workspace and AI-driven automation enhance service quality, ensuring your business stays competitive within industry benchmarks.
Contextualizing NPS with Industry Benchmarks
Interpreting NPS scores becomes more meaningful when you compare them to industry benchmarks. These benchmarks provide a reference point, helping you understand whether your score is competitive.
| Industry | NPS Score |
|---|---|
| Department & specialty stores | 56 |
| Brokerage & investments | 49 |
| Hotels | 49 |
| Credit cards | 45 |
| Airlines | 45 |
| Drug stores/Pharmacies | 43 |
| Smartphones | 43 |
| Computers and tablets | 43 |
| Online entertainment | 42 |
| Auto insurance | 41 |
| Software & apps | 41 |
| Online shopping | 40 |
| Life insurance | 39 |
| Grocery/supermarkets | 36 |
| Home/Contents insurance | 35 |
| Banking | 34 |
| Cell phone service | 34 |
| Travel websites | 32 |
| Rideshare & food delivery | 31 |
| Shipping services | 27 |
| Health insurance | 27 |
| Cable & satellite TV service | -2 |
| Internet service | -3 |
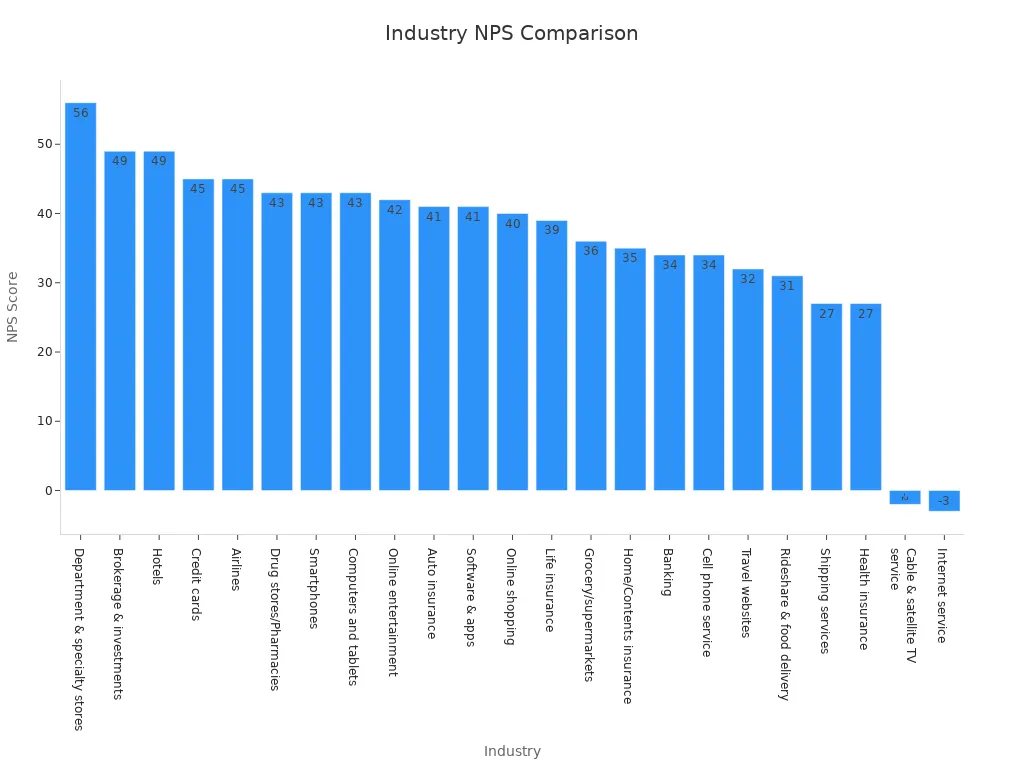
For example, if your NPS score is 45 and you operate in the airline industry, you align with the average. However, a score of 60 would place you ahead of competitors, showcasing exceptional customer loyalty.

Sobot’s Voice/Call Center can help you achieve these results by providing tools to analyze customer feedback and identify areas for improvement. Its call tracking and data analytics features allow you to pinpoint trends and optimize your customer experience strategies.
Tip: Regularly compare your NPS score to industry benchmarks to identify opportunities for growth. This practice ensures your business remains competitive and responsive to customer needs.
Identifying Trends in Promoters, Passives, and Detractors
Tracking trends among promoters, passives, and detractors over time provides valuable insights into your customers' loyalty and overall satisfaction. By analyzing these shifts, you can identify patterns that reveal how changes in your customer experience strategies impact sentiment.
Why Monitoring Trends Matters
Understanding how your NPS categories evolve helps you pinpoint areas for improvement. For example:
- A steady increase in promoters indicates growing customer loyalty and satisfaction.
- A rise in detractors signals dissatisfaction, requiring immediate action to address concerns.
- Fluctuations in passives suggest opportunities to convert them into promoters through targeted engagement.
These trends also highlight the effectiveness of your marketing efforts and operational changes. For instance, if a new initiative leads to a drop in detractors, it confirms the success of your strategy.
Key Factors Influencing Trends
Several factors can influence shifts in NPS categories:
- Customer segments surveyed: Different groups may have varying expectations, affecting their responses.
- Survey methods and incentives: The way you collect feedback can impact how customers rate their experience.
- Seasonal changes: Customer sentiment often fluctuates during peak seasons or holidays.
By considering these factors, you can better interpret your NPS survey results and make informed decisions.
Example: Quarterly Trends in NPS Categories
The table below illustrates how the percentages of promoters, passives, and detractors changed over four quarters in 2022:
| Time Period | Percentage of Promoters | Percentage of Passives | Percentage of Detractors |
|---|---|---|---|
| Q1 2022 | 50% | 30% | 20% |
| Q2 2022 | 55% | 25% | 20% |
| Q3 2022 | 60% | 20% | 20% |
| Q4 2022 | 65% | 15% | 20% |
This data shows a consistent rise in promoters, reflecting improved customer satisfaction. Meanwhile, the percentage of detractors remained stable, suggesting no significant increase in dissatisfaction.
Visualizing Trends Over Time
The line chart below provides a clear view of how these categories shifted throughout the year:

The chart highlights the steady growth in promoters, which aligns with efforts to enhance the customer experience. It also underscores the importance of maintaining this momentum to sustain loyalty.
Leveraging Sobot to Analyze Trends
Sobot’s Voice/Call Center simplifies the process of tracking and analyzing NPS trends. Its unified workspace consolidates survey responses, while advanced analytics tools provide real-time insights into customer sentiment. By using these features, you can identify patterns, address detractor concerns, and focus on converting passives into promoters. This proactive approach ensures your business stays ahead in delivering exceptional customer experiences.
Tip: Regularly monitor your NPS trends to evaluate the impact of your strategies. This practice helps you stay agile and responsive to customer needs.
Using NPS to Enhance Customer Experience with Sobot
Leveraging NPS Insights to Improve Customer Support
Using insights from your NPS survey can transform your customer support strategy. By analyzing feedback from promoters, passives, and detractors, you can identify areas that need improvement and prioritize actions that enhance customer satisfaction. For example, HotelTonight achieved an impressive NPS score of 75 by addressing customer concerns and prioritizing feature enhancements. Similarly, Pagely reduced customer churn by aligning its engineering roadmap with feedback collected through NPS surveys.
Sobot’s Voice/Call Center simplifies this process by consolidating survey responses and providing actionable insights. Its call tracking and data analytics features allow you to pinpoint recurring issues and optimize your support strategies. For instance, you can use real-time monitoring to identify trends in detractor feedback and implement targeted solutions to improve loyalty. By leveraging these tools, you can ensure your support team delivers exceptional service that meets customer expectations.
Closing the Feedback Loop with Sobot's Omnichannel Solution
Closing the feedback loop is essential for improving customer experience. An omnichannel approach enables you to gather data from multiple sources, such as customer surveys, social media conversations, and post-interaction feedback. This comprehensive view of customer behavior helps you refine strategies and personalize interactions. Companies with strong omnichannel strategies retain 91% of their customers, leading to a 3.4% increase in customer lifetime value.
Sobot’s Omnichannel Solution excels in this area. It integrates customer interactions across channels like voice, email, and live chat into a unified workspace. This seamless integration allows you to monitor sentiment trends, address pain points, and enhance satisfaction levels. For example, after a live chat conversation, you can collect feedback to assess the effectiveness of your interaction and make adjustments as needed. By using Sobot’s solution, you can close the feedback loop efficiently and foster stronger relationships with your customers.
Aligning NPS Results with Business Goals
Aligning NPS results with your business goals ensures that customer feedback drives meaningful improvements. For instance, Glassdoor used NPS insights to enhance user engagement and make data-driven product decisions, resulting in a measurable impact on user experience. By linking NPS trends to your objectives, you can prioritize initiatives that boost customer loyalty and satisfaction.
Sobot’s Voice/Call Center and Omnichannel Solution provide the tools you need to align NPS results with your goals. Their analytics capabilities help you track trends, measure the impact of changes, and identify opportunities for growth. For example, if your NPS score reveals a high percentage of promoters, you can focus on strategies to amplify their advocacy. Conversely, if detractors dominate, you can implement targeted improvements to address their concerns. This alignment ensures your business remains customer-centric and competitive in the market.
Real-Life Example: How Samsung Improved NPS with Sobot
Samsung faced a challenge in managing a high volume of customer inquiries across multiple channels. The company needed a solution to unify its communication systems and improve customer satisfaction. By implementing Sobot's all-in-one contact center solution, Samsung transformed its customer experience and achieved remarkable results.
Sobot's platform allowed Samsung to integrate various communication channels, including voice, email, and live chat, into a single workspace. This integration enabled agents to access customer data quickly and provide personalized support. The system also included AI-powered chatbots to handle repetitive queries, freeing agents to focus on complex issues. Additionally, Sobot's tools offered real-time monitoring and analytics, helping Samsung track trends and identify areas for improvement.
The results were impressive. Samsung achieved a 97% customer satisfaction rate and increased agent efficiency by 30%. The unified platform reduced response times and improved the overall quality of interactions. Customers appreciated the seamless experience, which contributed to a higher net promoter score. By addressing customer concerns effectively, Samsung strengthened loyalty and enhanced its reputation.
This example demonstrates how you can use Sobot's solutions to calculate NPS, analyze feedback, and improve customer satisfaction. Whether you manage a small business or a global enterprise, tools like Sobot's Voice/Call Center can help you deliver exceptional service and foster long-term loyalty.
Tip: Regularly monitor your NPS to identify trends and make data-driven decisions. This practice ensures you stay ahead in meeting customer expectations.
Common Pitfalls to Avoid When Using NPS
Misinterpreting NPS Without Context
Interpreting the net promoter score without considering its context can lead to misguided strategies. For example, focusing solely on converting detractors into promoters might cause you to overlook broader improvements that could benefit all customers. Similarly, selectively gathering feedback to inflate your NPS can damage trust and credibility.
Another common mistake is linking employee incentives to NPS scores. This approach can frustrate your team, especially if they feel powerless to influence factors affecting customer responses. Instead, use NPS as a diagnostic tool to identify trends and areas for improvement. Pair it with qualitative feedback to understand the "why" behind the numbers.
To avoid these pitfalls, ensure your NPS analysis includes segmentation by customer demographics or behavior. This approach provides actionable insights and prevents averages from obscuring critical details about customer sentiment.
Ignoring Customer Feedback from Detractors
Neglecting feedback from detractors can harm your customer experience and loyalty. Customers who feel unheard may turn to competitors, seeking better service. Addressing their concerns not only improves satisfaction but also demonstrates your commitment to resolving issues.
For instance, if detractors frequently mention long wait times, you can implement solutions like Sobot’s Voice/Call Center. Its smart call routing and real-time monitoring features help reduce delays, ensuring faster resolutions. By acting on detractor feedback, you can repair relationships and potentially convert dissatisfied customers into loyal advocates.
Ignoring detractors also means missing opportunities to identify systemic issues. Regularly review their feedback to uncover patterns and prioritize improvements that enhance the overall customer experience.
Over-Reliance on NPS Without Supporting Metrics
Relying solely on NPS to evaluate customer satisfaction can leave gaps in your understanding. While NPS offers a snapshot of loyalty, it doesn’t reveal specific pain points or process inefficiencies. Combining NPS with metrics like Customer Satisfaction (CSAT) and Customer Effort Score (CES) provides a more comprehensive view.
For example, NPS measures long-term loyalty, CSAT evaluates specific interactions, and CES assesses the ease of completing tasks. Together, these metrics offer a balanced perspective on customer sentiment. No single metric can fully capture the customer experience, so using multiple indicators ensures you address all aspects of satisfaction.
Sobot’s Omnichannel Solution supports this approach by integrating feedback from various channels into a unified workspace. This capability allows you to analyze NPS alongside other metrics, ensuring your strategies align with customer needs and business goals.
Tip: Use NPS as part of a broader measurement framework to gain actionable insights and drive meaningful improvements.
Failing to Act on NPS Trends Over Time
Failing to act on changing NPS trends can harm your business in several ways. When you ignore feedback from unhappy customers, dissatisfaction grows, and your net promoter score declines. This signals a weakening customer experience, which can lead to reduced loyalty and lost revenue. Tracking NPS trends over time allows you to identify issues early and take corrective action before they escalate.
Small shifts in NPS scores can have significant impacts. For example, a slight drop in promoter percentages might seem minor but could indicate deeper problems in your service quality. Misinterpreting these changes or failing to address them can result in false conclusions about customer sentiment. Businesses that neglect these trends often miss opportunities to improve their survey design, leading to misleading scores that mask real customer concerns.
Consider this scenario: A company notices its NPS score has dropped by five points over two quarters. Without proper analysis, the team assumes the decline is due to seasonal factors and takes no action. However, the real issue lies in longer wait times for customer support, which frustrates customers and increases detractor feedback. By failing to act, the company risks further dissatisfaction and a continued downward trend in loyalty.
To avoid these pitfalls, use tools like Sobot’s Voice/Call Center to monitor NPS trends effectively. Its real-time analytics and call tracking features help you pinpoint changes in customer sentiment and identify recurring issues. For instance, if detractors frequently mention poor communication, you can implement smart call routing to reduce delays and improve satisfaction. Acting on these insights ensures your business stays proactive in delivering exceptional service.
Regularly reviewing NPS trends helps you maintain a competitive edge. It allows you to adapt your strategies based on customer feedback and prevent small issues from becoming major problems. By staying responsive, you can foster loyalty and ensure your customers remain advocates for your brand.
Calculating and interpreting the net promoter score is straightforward and impactful. Start by asking your customers the NPS question, categorize their responses, and apply the formula: % Promoters - % Detractors. This simple process reveals customer sentiment and loyalty trends.
Using NPS insights can transform your business. For example, Philips Lighting linked rising NPS to a 70% revenue increase, while companies acting on NPS feedback saw a 14% boost in customer retention. Promoters drive 80-90% of referrals, making them essential for growth.
Tools like Sobot’s Voice/Call Center simplify NPS surveys and analysis. Its unified workspace and analytics help you identify trends and improve customer satisfaction. Start measuring your NPS today to enhance loyalty and deliver exceptional experiences.
FAQ
What is the best way to distribute an NPS survey?
You can distribute an NPS survey through email, SMS, or phone calls. Tools like Sobot’s Voice/Call Center simplify this process by automating survey distribution and consolidating responses. This ensures you reach customers efficiently and collect actionable feedback.
How often should you calculate NPS?
You should calculate NPS quarterly or after significant customer interactions. Regular tracking helps you monitor trends and address issues promptly. For example, analyzing quarterly NPS trends can reveal how changes in your service impact customer loyalty.
Can NPS surveys work for small businesses?
Yes, NPS surveys are effective for businesses of all sizes. They provide valuable insights into customer satisfaction and loyalty. Small businesses can use tools like Sobot’s Omnichannel Solution to streamline survey collection and focus on improving customer experience.
What should you do if your NPS score is low?
If your NPS score is low, analyze detractor feedback to identify recurring issues. Address these concerns quickly to improve satisfaction. For instance, if customers mention long wait times, implement solutions like Sobot’s smart call routing to enhance response speed.
How can you encourage customers to complete surveys?
Keep surveys short and mobile-friendly. Offer incentives like discounts or loyalty points to motivate participation. Sobot’s Voice/Call Center can help you design and distribute engaging surveys that maximize response rates.
See Also
Effective Strategies for Managing Live Chat Representatives
Enhance SaaS Customer Support Using Live Chat Techniques
Excelling in Live Chat for Superior Customer Service
Improving Call Center Efficiency Through Effective Monitoring
Ten Strategies to Enhance Customer Satisfaction via Live Chat