Steps to Calculate Net Promoter Score Benchmarks

Net Promoter Score benchmarks serve as a critical measure of how well your business meets customer expectations. By comparing your score to industry standards, you can identify gaps in service quality and areas for improvement. For example, a 7% rise in your net promoter score benchmark correlates with a 1% revenue boost, highlighting its impact on customer loyalty and financial performance. Promoters, who are 50% more likely to make repeat purchases, represent a valuable segment for long-term growth. Tools like Sobot's omnichannel solutions can help you analyze and act on NPS data efficiently.
Understanding Net Promoter Score Benchmarks
What Are Net Promoter Score Benchmarks
Net Promoter Score benchmarks help you measure how your business performs compared to others in your industry. These benchmarks provide a reference point for evaluating customer loyalty and satisfaction. By understanding where your score stands, you can identify areas to improve the customer experience and drive growth.
NPS benchmarks rely on the calculation of your Net Promoter Score, which is derived from customer feedback. Customers rate their likelihood of recommending your business on a scale of 0 to 10. Promoters (9-10) are your most loyal customers, passives (7-8) are neutral, and detractors (0-6) are dissatisfied. The formula subtracts the percentage of detractors from promoters to give you your score.
For example, industries like professional services often achieve a median NPS of +50, while technology companies average +40. These benchmarks vary widely, making it essential to compare your score within your specific sector. Tools like Sobot’s Voice/Call Center can simplify data collection and analysis, helping you calculate your score accurately and efficiently.
Why NPS Benchmarks Matter for Customer Success
NPS benchmarks play a vital role in shaping your customer success strategy. They reveal how well your business meets customer expectations and highlight areas for improvement. Companies with higher NPS scores often experience better financial performance. For instance, a one-point increase in NPS can lead to a 0.5% rise in annual revenue for brands like DFS.
Benchmarks also help you understand the impact of customer loyalty on profitability. Promoters contribute significantly to growth, as seen in Heineken’s case, where promoters drove gross profit at three times the rate of detractors. By focusing on improving your NPS, you can enhance customer satisfaction and retention, ultimately boosting your bottom line.
Sobot’s Omnichannel Solution provides analytics tools that allow you to track and compare your NPS against industry standards. This insight empowers you to refine your strategies and deliver exceptional customer experiences across all channels.
Common Industry Standards for NPS Benchmarks
Different industries have distinct NPS benchmarks, reflecting variations in customer expectations and experiences. Here’s a quick overview:
| Industry | Median NPS | Top Quartile NPS | Bottom Quartile NPS |
|---|---|---|---|
| Professional services | +50 | +73 (or higher) | +19 (or lower) |
| Technology | +40 | +64 (or higher) | +11 (or lower) |
| Consumer goods | +50 | +72 (or higher) | +21 (or lower) |
These benchmarks provide a clear picture of where your business stands. If your score falls in the bottom quartile, it signals a need for immediate action to improve customer satisfaction. On the other hand, achieving a top-quartile score indicates strong customer loyalty and brand health.
Sobot’s solutions, such as its AI-powered Voicebot, can help you analyze customer feedback and identify trends that impact your NPS. By leveraging these tools, you can align your strategies with industry standards and deliver a superior customer experience.
How to Calculate NPS for Benchmarking
Collecting Customer Feedback Through NPS Surveys
To calculate your net promoter score, you first need to gather customer feedback through NPS surveys. These surveys ask a simple yet powerful question: “How likely are you to recommend our product or service to others?” Customers respond on a scale of 0 to 10, providing insights into their satisfaction and loyalty.
Choosing the right survey channel is crucial for maximizing response rates. For instance:
| Survey Channel | Response Rate (%) | Key Insights |
|---|---|---|
| In-person/event surveys | 85-95 | Ideal for direct customer interaction, offering the highest engagement. |
| WhatsApp surveys | 30-50 | Cost-effective and engaging, with lower opt-out rates than SMS. |
| Phone/IVR surveys | 20-50 | Personalized but resource-intensive. |
| Web pop-up surveys | 20-30 | Effective for active website visitors, provided they are short and relevant. |
| In-app surveys | 16-30 | Targets engaged app users at logical moments in their journey. |
| SMS/Text surveys | 12 | Quick and convenient but with lower response rates. |
| Email surveys | 6-25 | Commonly used, with an average response rate of 12-15%. |
| Passive web tab surveys | 3-5 | Relies on customer initiative, resulting in the lowest engagement. |
Timing also plays a significant role. Sending surveys immediately after a positive interaction, such as a successful purchase or resolution of an issue, often yields better results. However, avoid over-surveying, as it can lead to customer fatigue.

Sobot’s Voice/Call Center simplifies this process by enabling you to conduct phone or IVR surveys efficiently. Its smart call routing and time zone support ensure you reach customers at the most convenient times, improving response rates and data accuracy.
Categorizing Responses: Promoters, Passives, and Detractors
Once you collect responses, the next step is to categorize them into three groups:
| NPS Segments | Identification and Characteristics | Engagement Strategies |
|---|---|---|
| Promoters | Customers scoring 9 or 10, enthusiastic about your brand. | Recognize loyalty, offer exclusive deals, and maintain regular communication. |
| Passives | Customers scoring 7 or 8, satisfied but not strongly loyal. | Elevate their experience and address their needs through follow-up questions. |
| Detractors | Customers scoring between 0 and 6, dissatisfied and at risk of churn. | Address concerns promptly and implement changes to prevent future issues. |
Promoters are your brand advocates. They are more likely to recommend your business and make repeat purchases. Passives, while satisfied, may switch to competitors if offered a better deal. Detractors, on the other hand, pose a risk of negative word-of-mouth.
Segmenting responses helps you understand the strengths and weaknesses of your customer experience. For example, if a large percentage of your respondents fall into the detractor category, it signals an urgent need for improvement. Sobot’s Omnichannel Solution can assist by consolidating customer feedback across channels, allowing you to analyze trends and take targeted actions.
Applying the NPS Formula: Promoter % - Detractor %
The final step in NPS calculation involves applying the NPS formula:
NPS = Percentage of Promoters - Percentage of Detractors
Here’s how it works:
- Calculate the percentage of promoters by dividing the number of promoters by the total number of respondents and multiplying by 100.
- Do the same for detractors to find their percentage.
- Subtract the percentage of detractors from the percentage of promoters to get your NPS score.
For example:
| Scale Type | Promoters | Detractors | % Promoters | % Detractors | NPS |
|---|---|---|---|---|---|
| 11-Point Scale | 60 | 20 | 60% | 20% | 40 |
| 5-Point Scale | 50 | 20 | 50% | 20% | 30 |
A positive NPS indicates more promoters than detractors, which is a sign of strong customer loyalty. A negative score suggests the opposite, requiring immediate attention to improve customer satisfaction.
Benchmarking your NPS against industry standards provides valuable context. For instance, a score of +40 might be excellent in the technology sector but below average in professional services. Sobot’s analytics tools can help you compare your NPS to competitors and identify areas for improvement.
By following these steps, you can calculate NPS accurately and use it as a benchmark to enhance your customer experience strategy.
Using Sobot’s Voice/Call Center for Efficient Data Collection

Efficient data collection is essential for calculating your Net Promoter Score (NPS) accurately. Sobot’s Voice/Call Center provides advanced tools to streamline this process, ensuring you gather high-quality feedback from your customers. Its intelligent features allow you to conduct surveys, analyze responses, and track metrics with ease.
Key Features That Enhance NPS Data Collection
Sobot’s Voice/Call Center offers several features designed to optimize your data collection efforts:
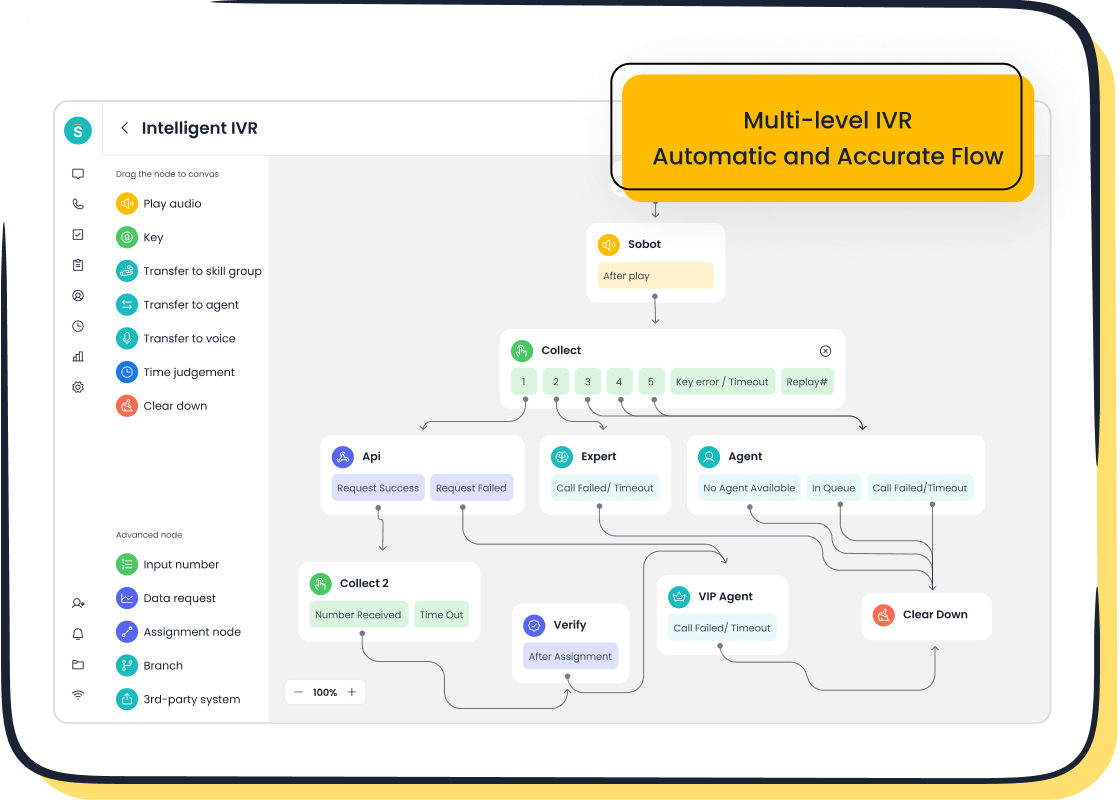
- Intelligent IVR: Customize greetings and menus to guide customers through surveys effortlessly.
- Smart Call Routing: Automatically route calls based on customer location and time zone for better engagement.
- AI-Powered Voicebot: Handle repetitive queries and collect feedback with 80% accuracy.
- Global Number Availability: Reach customers worldwide, ensuring comprehensive data collection.
- Real-Time Monitoring: Track survey responses and analyze trends instantly.
These features work together to improve response rates and ensure accurate NPS calculations. For example, the AI-powered Voicebot can interact with customers intelligently, reducing the need for manual intervention.
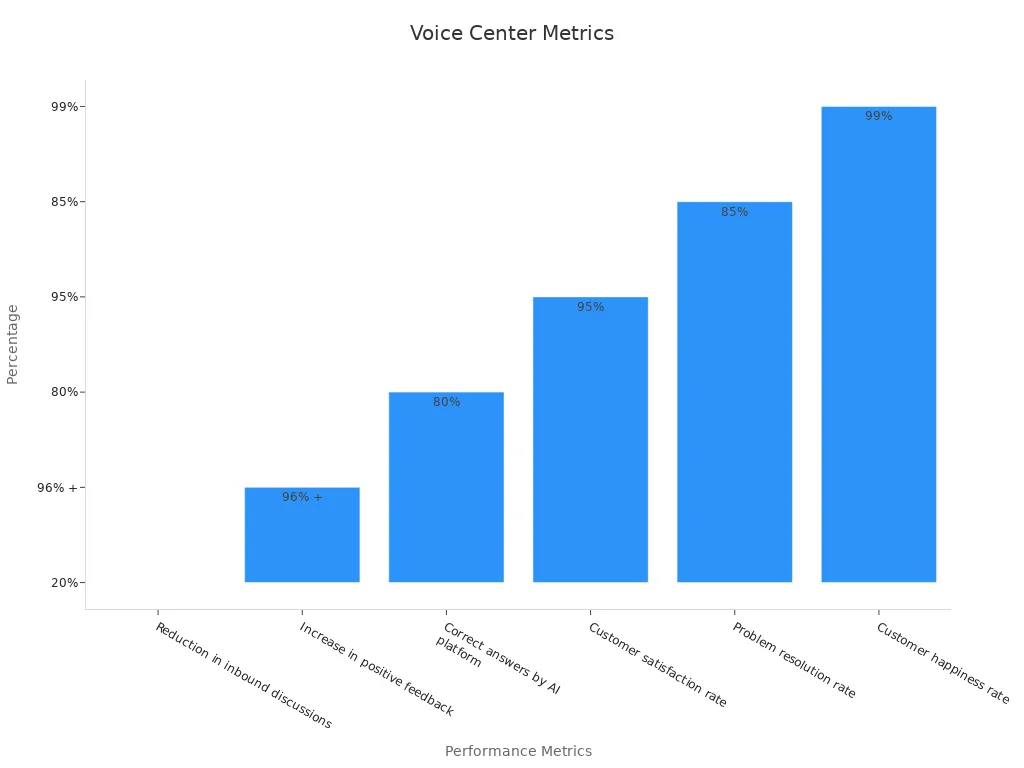
Proven Metrics That Validate Its Effectiveness
Sobot’s Voice/Call Center delivers measurable results that demonstrate its efficiency in collecting NPS data. Here’s a snapshot of its performance metrics:
| Metric | Value |
|---|---|
| Reduction in inbound discussions | 20% |
| Increase in positive feedback | 96% + |
| Correct answers by AI platform | 80% |
| Customer satisfaction rate | 95% |
| Problem resolution rate | 85% |
| Customer happiness rate | 99% |
These metrics highlight how Sobot’s Voice/Call Center enhances customer interactions while improving data collection accuracy.
Real-World Application
Samsung, a global leader in technology, leveraged Sobot’s Voice/Call Center to unify its communication channels and improve customer service. By integrating Sobot’s tools, Samsung achieved a 97% customer satisfaction rate and a 30% increase in agent efficiency. This success demonstrates how Sobot’s solutions can transform your NPS data collection process and drive better results.
Why Choose Sobot for NPS Surveys
Sobot’s Voice/Call Center simplifies the complexities of NPS surveys. Its advanced features ensure you collect feedback efficiently while maintaining high system stability with a 99.99% uptime. By using Sobot’s tools, you can focus on analyzing insights and improving customer satisfaction rather than worrying about technical challenges.
Efficient data collection is the foundation of accurate NPS benchmarking. With Sobot’s Voice/Call Center, you gain access to powerful tools that make this process seamless, helping you achieve better customer loyalty and business growth.
Finding and Comparing Industry-Specific NPS Benchmarks

Sources for Industry-Specific NPS Benchmarks
Finding reliable sources for industry benchmarks is essential for assessing your NPS performance. Several organizations provide comprehensive data to help you compare your score effectively:
- NPS Prism: Offers up-to-date benchmarking data tailored to various industries.
- Bain & Company: Provides insights into NPS benchmarks, helping businesses understand customer loyalty trends.
- Survicate: Features a detailed guide on NPS by industry, enabling you to evaluate your performance against competitors.
Industry-specific reports also provide valuable insights. For example, the 2024 NPS® Benchmarks for the B2B Services Industry by ClearlyRated highlights sector-specific trends. These resources allow you to identify where your business stands and uncover opportunities for improvement.
The table below illustrates average NPS scores across industries:
| Industry | NPS Average |
|---|---|
| Grocery | 33.3 |
| Retail | 32.9 |
| Streaming media | 32.2 |
| Investment Firm | 27.9 |
| Parcel delivery | 27.7 |
| Fast food | 26.6 |
| Social media | 25.3 |
| Wireless | 24.7 |
| Auto | 24.3 |
| Bank | 23.6 |
| Food delivery | 22.9 |
| Insurance | 21.9 |
| Software | 19.5 |
| Computer and tablet makers | 17.8 |
| Hotel | 17.2 |
| Health insurance | 16.1 |
| Utilities | 15.9 |
| Electronics | 14.4 |
| TV/ISP | 12.3 |
| Airlines | 11.9 |
| Car rental | 4.8 |
| Consumer Payments | -0.1 |
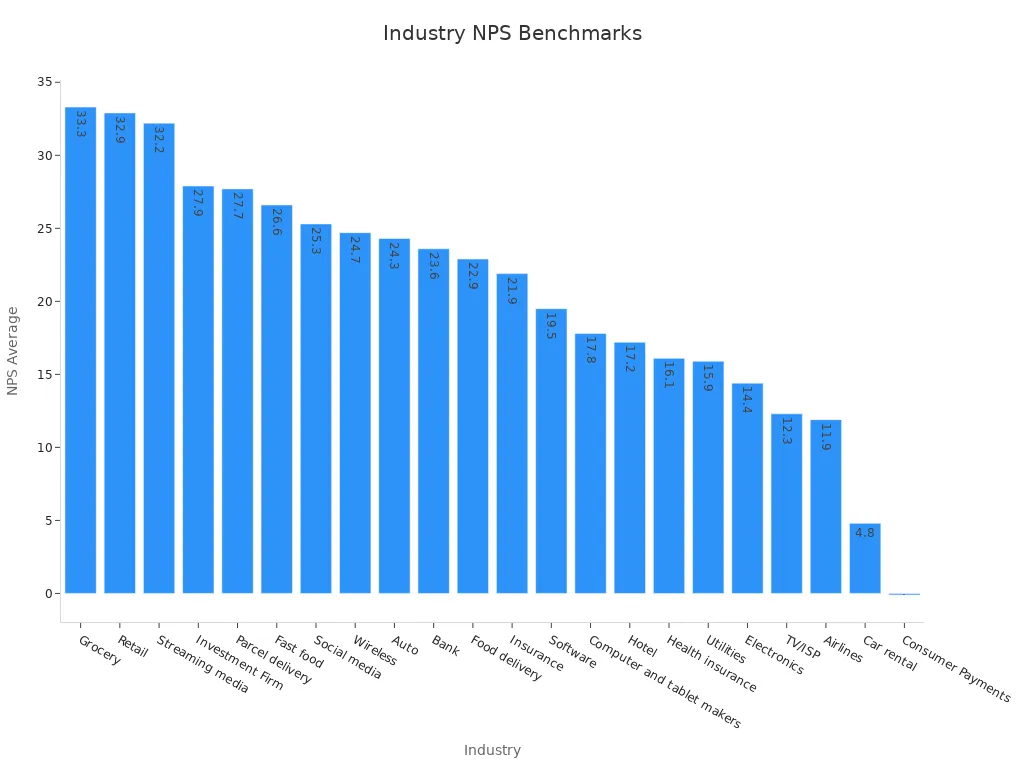
These benchmarks provide a clear picture of customer satisfaction across industries, helping you set realistic goals for improvement.
Comparing Your NPS to Competitors and Industry Standards
Comparing your NPS to competitors and industry benchmarks reveals how well your business performs in customer satisfaction. For example, if your score is 24.7 in the wireless sector, you align with the industry average. However, achieving a score above 30 would place you in the top quartile, signaling strong customer loyalty.
To make these comparisons, analyze your NPS alongside industry averages and top quartile scores. This approach helps you identify gaps and prioritize areas for improvement. Tools like Sobot’s Omnichannel Solution simplify this process by consolidating customer feedback and providing actionable insights.
Sobot’s analytics capabilities allow you to track metrics such as customer satisfaction rates and problem resolution times. These insights empower you to refine your strategies and outperform competitors in delivering exceptional customer experiences.
Leveraging Sobot’s Omnichannel Solution for Benchmark Analysis
Sobot’s Omnichannel Solution offers advanced tools for detailed benchmark analysis. Its unified workspace consolidates customer data from multiple channels, enabling you to compare your NPS against industry standards efficiently.
| Metric | Value |
|---|---|
| Percentage of business from upgrades | 70% |
| Reduction in waiting times | 35% |
| Benefit to clients | Major fresh food e-commerce companies |
These metrics demonstrate how Sobot’s solution drives measurable improvements in customer satisfaction. For example, reducing waiting times by 35% enhances the customer experience, contributing to higher NPS scores.
By leveraging Sobot’s analytics tools, you gain a deeper understanding of customer feedback trends. This insight helps you align your strategies with industry benchmarks and achieve better results. Whether you operate in retail, financial services, or gaming, Sobot’s solution adapts to your needs, ensuring accurate benchmarking and actionable insights.
Tips for Accurate NPS Benchmarking
Ensuring Representative Customer Samples
Accurate NPS benchmarking begins with collecting feedback from a representative sample of your customer base. This ensures that the insights reflect the experiences of all customer segments. To achieve this, follow these best practices:
- Ensure your sample includes diverse demographics, interaction types, and customer segments.
- Send surveys shortly after key interactions to capture fresh and accurate feedback.
- Use the standard NPS question: "On a scale of 0 to 10, how likely are you to recommend our company/product/service to a friend or colleague?"
- Include open-ended follow-up questions to gather qualitative insights, such as "What is the primary reason for your score?"
| Best Practice | Description |
|---|---|
| Representative Sampling | Include all demographics and interaction types in your survey sample. |
| Survey Timing | Send surveys promptly after key interactions for accurate sentiment capture. |
| Question Phrasing | Use the standard NPS question format for consistency. |
| Follow-Up Questions | Add open-ended questions to understand the reasons behind customer scores. |
By implementing these practices, you can ensure your NPS surveys provide reliable data for customer experience management.
Segmenting Data for Precise Insights
Segmenting your NPS data allows you to uncover deeper insights into customer behavior and satisfaction. Different segmentation techniques can help you identify trends and tailor your strategies effectively:
- Demographic Segmentation: Analyze preferences based on age, gender, or location to understand B2C customer needs.
- Firmographic Segmentation: Focus on industry type, company size, and revenue for B2B customers.
- Behavioral Segmentation: Examine loyalty, spending levels, and other behaviors to identify satisfaction drivers.
| Segmentation Type | Description |
|---|---|
| Demographic | Understand preferences based on age, gender, and location. |
| Firmographic | Address unique needs of businesses by analyzing industry and company size. |
| Behavioral | Explore loyalty and spending patterns to improve customer satisfaction. |
Automating NPS surveys and integrating them with CRM systems can enhance the accuracy of your segmentation. Regularly monitor segmented data to track changes in customer loyalty and satisfaction over time.
Avoiding Common Pitfalls in NPS Surveys
To ensure accurate results, avoid common mistakes in your NPS surveys. A strong feedback system helps you identify gaps in customer perception and improve customer experience management. Here are some tips:
- Use clear and simple language. For example, ask "How easy was it to use our mobile app?" instead of using technical jargon.
- Avoid forcing respondents to answer every question. Allow them to skip questions if they have no strong opinion.
- Ensure each question addresses only one aspect of the customer experience to avoid confusion.
- Provide a balanced range of response options to prevent skewed data.
By addressing these pitfalls, you can improve the reliability of your NPS surveys and gain actionable insights to enhance customer satisfaction.
Using Sobot’s Analytics Tools for Reliable Benchmarking
Reliable benchmarking requires accurate data analysis, and Sobot’s analytics tools make this process seamless. These tools provide you with actionable insights to evaluate your Net Promoter Score (NPS) and compare it against industry standards. By leveraging Sobot’s advanced features, you can identify trends, uncover improvement areas, and refine your customer success strategies.
Key Features of Sobot’s Analytics Tools
Sobot’s analytics tools offer a range of capabilities designed to enhance your benchmarking efforts:
- Real-Time Data Monitoring: Track customer feedback as it comes in, ensuring you always work with the latest insights.
- Customizable Dashboards: Visualize your NPS data through intuitive charts and graphs tailored to your business needs.
- Segmentation Capabilities: Break down NPS scores by demographics, regions, or customer types for deeper analysis.
- Predictive Analytics: Use AI-driven predictions to anticipate customer behavior and take proactive measures.
Tip: Use Sobot’s segmentation feature to analyze NPS trends across different customer groups. For example, you might discover that younger customers rate your service higher than older ones, helping you tailor your approach.
Real-World Impact
Samsung, a global leader in technology, used Sobot’s analytics tools to achieve a 97% customer satisfaction rate. By analyzing NPS data, Samsung identified key areas for improvement and implemented targeted strategies. This led to a 30% boost in agent efficiency and stronger customer loyalty.
Why Choose Sobot for Benchmarking?
Sobot’s analytics tools simplify complex data analysis, allowing you to focus on actionable insights. With features like real-time monitoring and predictive analytics, you can stay ahead of customer expectations. Whether you operate in retail, financial services, or gaming, Sobot’s tools adapt to your needs, ensuring accurate benchmarking and better results.
Start your journey toward reliable benchmarking with Sobot’s analytics tools. Visit Sobot’s Omnichannel Solution to learn more.
Driving Customer Success With NPS Benchmarks

Identifying Improvement Areas Based on Benchmarks
Using NPS benchmarks effectively begins with identifying areas where your business can improve. Benchmarks provide a clear picture of how your customer experience compares to industry standards. By analyzing your NPS data, you can pinpoint specific gaps that need attention. For example, if your detractor percentage is higher than the industry average, it signals dissatisfaction that requires immediate action.
Two primary methods can help you identify improvement areas:
| Metrics-Driven Benchmarking | Practice-Driven Benchmarking |
|---|---|
| Quantitative approach using NPS surveys to measure success. | Qualitative approach focusing on behaviors and management practices. |
| Helps identify areas needing improvement across departments. | Directs companies to new solutions that can stimulate greater change. |
| Can lead to actionable outcomes if data is interpreted correctly. | May lead to selective bias by focusing on larger companies for inspiration. |
Additionally, consider these strategies:
- Pinpoint problem areas for improvement.
- Identify gaps in the market for new products or services.
- Reach out to promoters for reviews and referrals.
- Prevent detractors from switching to competitors.
- Engage partners and channel partners to ensure alignment.
Sobot’s Omnichannel Solution simplifies this process by consolidating customer feedback across channels. Its analytics tools help you uncover trends and prioritize actions that enhance customer loyalty and satisfaction.
Setting Goals for NPS Improvement
Setting realistic goals for NPS improvement ensures your efforts align with achievable outcomes. Start by understanding your baseline score and comparing it to industry benchmarks. For instance, a 3-5 point increase year-over-year is a reasonable target for most businesses.
Here are some guidelines to help you set effective goals:
| Guideline | Description |
|---|---|
| Set achievable targets | Aim for a 3-5 point increase year-over-year based on baseline and industry benchmarks. |
| Wait before setting targets | Allow 6-12 months to better estimate business improvement opportunities. |
| Set local targets | Consider cultural and industry factors when setting NPS targets. |
| Use relative change targets | Focus on relative changes in scores over time rather than absolute scores. |
| Use benchmarking data | Understand market position to set clear, measurable objectives for NPS improvement. |
For example, if your current NPS is +30 and the industry average is +40, aim to close the gap incrementally. Sobot’s Voice/Call Center can assist by providing real-time data monitoring and predictive analytics. These tools enable you to track progress and adjust your strategies as needed.
Integrating NPS Insights Into Customer Support Strategies
Integrating NPS insights into your customer support strategies ensures continuous improvement in customer experience. Use NPS data to identify trends, address pain points, and enhance service quality. For example, if detractors frequently mention long wait times, prioritize reducing response times.
Consider these frameworks for effective integration:
- Agile Frameworks: Adopt agile methodologies to iterate on improvements as new data emerges.
- Employee Training: Equip your team with the skills to interpret NPS data and implement changes effectively.
- Feedback Integration: Formalize feedback analysis through quarterly strategy revisions to ensure all insights are actionable.
Sobot’s Omnichannel Solution supports these efforts by providing a unified workspace for managing customer interactions. Its AI-driven tools analyze feedback, enabling you to implement targeted improvements. For instance, Samsung used Sobot’s solutions to achieve a 97% customer satisfaction rate by addressing specific customer concerns.
By aligning your customer support strategies with NPS insights, you can foster stronger customer loyalty and drive long-term success.
Tracking Progress Using Sobot’s Voice/Call Center Analytics
Tracking your progress in improving your net promoter score (NPS) is essential for understanding how well your business meets customer expectations. Sobot’s Voice/Call Center analytics tools provide a reliable way to monitor your NPS performance and identify areas for improvement. By leveraging these tools, you can gain actionable insights that help you refine your strategies and enhance customer satisfaction.
Why Tracking NPS Progress Matters
Monitoring your NPS over time reveals trends in customer loyalty and satisfaction. A consistent rise in your score indicates that your efforts to improve the customer experience are working. Conversely, a decline signals areas that need immediate attention. For example, a study by Bain & Company found that businesses with high NPS scores grow twice as fast as their competitors. Tracking progress ensures you stay ahead in delivering exceptional service.
Features of Sobot’s Voice/Call Center Analytics
Sobot’s Voice/Call Center offers advanced analytics features that simplify NPS tracking. These tools allow you to collect, analyze, and act on customer feedback efficiently. Key features include:
- Real-Time Monitoring: View NPS data as it comes in, enabling you to respond quickly to customer concerns.
- Customizable Dashboards: Visualize trends and patterns in your NPS scores through intuitive charts and graphs.
- AI-Powered Insights: Use predictive analytics to anticipate customer behavior and take proactive measures.
- Global Reach: Access feedback from customers worldwide, ensuring comprehensive data collection.
These features work together to provide a clear picture of your NPS performance, helping you make informed decisions to improve customer loyalty.
How to Use Analytics for NPS Tracking
To track your NPS progress effectively, follow these steps:
- Set Baseline Metrics: Establish your current NPS score as a reference point.
- Monitor Trends: Use Sobot’s real-time monitoring tools to identify changes in customer sentiment.
- Segment Data: Break down NPS scores by demographics, regions, or customer types for deeper insights.
- Analyze Feedback: Review open-ended responses to understand the reasons behind customer scores.
- Take Action: Implement targeted strategies based on the insights gained from your analytics.
For example, if your analytics reveal that detractors frequently mention long wait times, prioritize reducing response times. Sobot’s smart call routing feature can help by directing calls to the right agents quickly, improving the overall customer experience.
Real-World Success Story
Samsung used Sobot’s Voice/Call Center analytics to track its NPS progress and identify improvement areas. By analyzing customer feedback, Samsung implemented targeted strategies that led to a 97% customer satisfaction rate and a 30% increase in agent efficiency. This success demonstrates how Sobot’s tools can transform your approach to NPS tracking.
Benefits of Using Sobot for NPS Analytics
Sobot’s Voice/Call Center analytics tools offer several benefits for tracking your NPS progress:
- Improved Accuracy: Real-time data ensures you work with the most up-to-date insights.
- Enhanced Efficiency: Automation reduces the time spent on manual data analysis.
- Actionable Insights: Predictive analytics help you anticipate customer needs and refine your strategies.
By using Sobot’s tools, you can focus on improving customer satisfaction and loyalty, driving long-term business growth.
Tip: Regularly review your NPS data to identify trends and adjust your strategies. Consistent tracking ensures you stay aligned with customer expectations and industry benchmarks.
Calculating and benchmarking your Net Promoter Score (NPS) is a straightforward yet powerful way to enhance customer satisfaction and loyalty. By following the steps outlined—collecting feedback, categorizing responses, applying the NPS formula, and comparing industry benchmarks—you can identify areas for improvement and track progress effectively.
NPS benchmarks have a proven impact on business outcomes. For example:
- Amazon: An NPS of 61 correlates with 91% of Prime members renewing their subscriptions and spending 42% more than regular customers.
- Tesla Motors: An NPS of 97 highlights exceptional customer loyalty.
- Apple MacBooks: An NPS of 76 reflects strong brand loyalty in consumer electronics.
Additionally, industries like financial services have seen average NPS scores rise from 30 to 46, with retention rates improving to 78%.
Sobot’s Voice/Call Center and Omnichannel Solution simplify the process of collecting and analyzing NPS data. These tools provide real-time insights, predictive analytics, and global reach, enabling you to refine your strategies and deliver exceptional customer experiences. By leveraging these solutions, you can transform your NPS benchmarks into actionable insights that drive growth and loyalty.
Tip: Start using Sobot’s tools today to elevate your customer satisfaction and achieve measurable results.
FAQ
What is the ideal frequency for conducting NPS surveys?
Conduct NPS surveys quarterly to capture trends in customer satisfaction. Frequent surveys help you track changes and identify improvement areas. Sobot’s Voice/Call Center ensures efficient survey distribution, enabling you to collect accurate data without overwhelming your customers.
How can I improve response rates for NPS surveys?
Use engaging channels like WhatsApp or in-app surveys. Timing matters—send surveys after positive interactions. Sobot’s Omnichannel Solution optimizes survey timing and delivery, ensuring higher response rates and better data quality.
What is a good Net Promoter Score benchmark?
A good NPS benchmark varies by industry. For example, technology averages +40, while professional services reach +50. Compare your score to industry standards using tools like Sobot’s analytics to identify gaps and set realistic goals.
Can NPS benchmarks predict business growth?
Yes, NPS benchmarks correlate with growth. A one-point increase in NPS can boost revenue by 0.5%. Promoters drive repeat purchases and referrals. Sobot’s Voice/Call Center helps you analyze NPS data to uncover growth opportunities.
How does Sobot simplify NPS benchmarking?
Sobot’s Voice/Call Center and Omnichannel Solution streamline data collection and analysis. Features like real-time monitoring, AI-powered insights, and global reach ensure accurate benchmarking. These tools help you refine strategies and improve customer satisfaction.
See Also
Enhancing Call Center Efficiency Through Effective Monitoring Techniques
Comparative Analysis of Leading Voice of Customer Tools
Enhancing SaaS Customer Support Using Live Chat Approaches
Effective Management Techniques for Live Chat Support Agents
Ten Essential Steps for Implementing Omnichannel Contact Solutions
