How to Build a Customer Service Dashboard for Real-Time Insights

Building a customer service dashboard for real-time insights starts with clear goals, the right metrics, and integrated data. You gain instant visibility, which helps you detect issues early and respond quickly. This transparency builds trust and improves satisfaction, as 91% of consumers track updates and value fast communication. Sobot, with its advanced omnichannel and Sobot call center solutions, gives you a strong foundation for creating a dashboard that matches your business needs. Sobot AI tools help you focus on what matters most for your customers.
Customer Service Dashboard Overview
What Is a Customer Service Dashboard
A customer service dashboard gives you a clear view of your team’s performance and customer interactions. You see important data in one place, like how fast agents reply, how long it takes to solve problems, and how happy customers feel. This dashboard helps you track the customer journey from first contact to final resolution. You can use it to spot trends, find issues, and make quick decisions. Sobot’s omnichannel solution lets you combine data from chat, email, phone, and social media, so you get a complete picture of every customer.
Tip: A good dashboard uses simple charts and tables. It shows only the most important numbers, so you do not get lost in too much information.
Here is a table showing the core components you should expect in a customer service dashboard:
| Core Components / Metrics | Description |
|---|---|
| First response time | How quickly your team replies to customers |
| Average handling time | How long it takes to solve each issue |
| First contact resolution rate | How often problems get fixed in one try |
| Customer effort score (CES) | How easy it is for customers to get help |
| Customer satisfaction scores (CSAT) | How happy customers are with your service |
| Net Promoter Score (NPS) | How likely customers are to recommend your business |
| Agent productivity | How well each agent performs |
| Workload distribution | How tasks are spread across your team |
| Quality assurance scores | How well your team follows service rules |
Why Real-Time Insights Matter
You need real-time insights to keep your customer service operations running smoothly. When you see data as it happens, you can fix problems before they grow. For example, surveys show that 90% of customers want an immediate response, and 60% think “immediate” means within 10 minutes (Statista). If your dashboard updates in real time, you can spot slow replies and help your team respond faster. Fast answers make customers happier and help your brand look good. Real-time dashboards also help you find customers who might leave. AI tools can spot patterns, like fewer logins or more complaints, so you can reach out and keep them loyal.
Note: Real-time dashboards help you track every step of the customer journey. You see where customers get stuck and can fix those points quickly.
Sobot’s Approach to Dashboards
Sobot builds dashboards that focus on clarity, speed, and action. You get a unified workspace that brings together data from calls, chats, tickets, and social media. Sobot’s Voice/Call Center solution lets you monitor calls, track agent performance, and analyze customer feedback in real time. You can customize your dashboard to fit your business needs and scale as you grow. Sobot’s system refreshes data automatically, so you always see the latest numbers. With Sobot, you can follow the customer journey across all channels and make smart choices to improve service. OPPO, a global smart device brand, used Sobot’s dashboard to boost chatbot resolution rates to 83% and raise positive feedback to 94%. This shows how a strong dashboard can improve customer satisfaction and support business growth.
Key Metrics for a CX Dashboard
Essential KPIs to Track
You need to track the right metrics to make your customer experience dashboard useful. These numbers help you see how well your team supports customers and where you can improve. The most important customer success metrics show how quickly and effectively you solve problems. Here is a table that explains the top KPIs for a cx dashboard:
| KPI | Customer Impact | Operational Impact | Recommended Target |
|---|---|---|---|
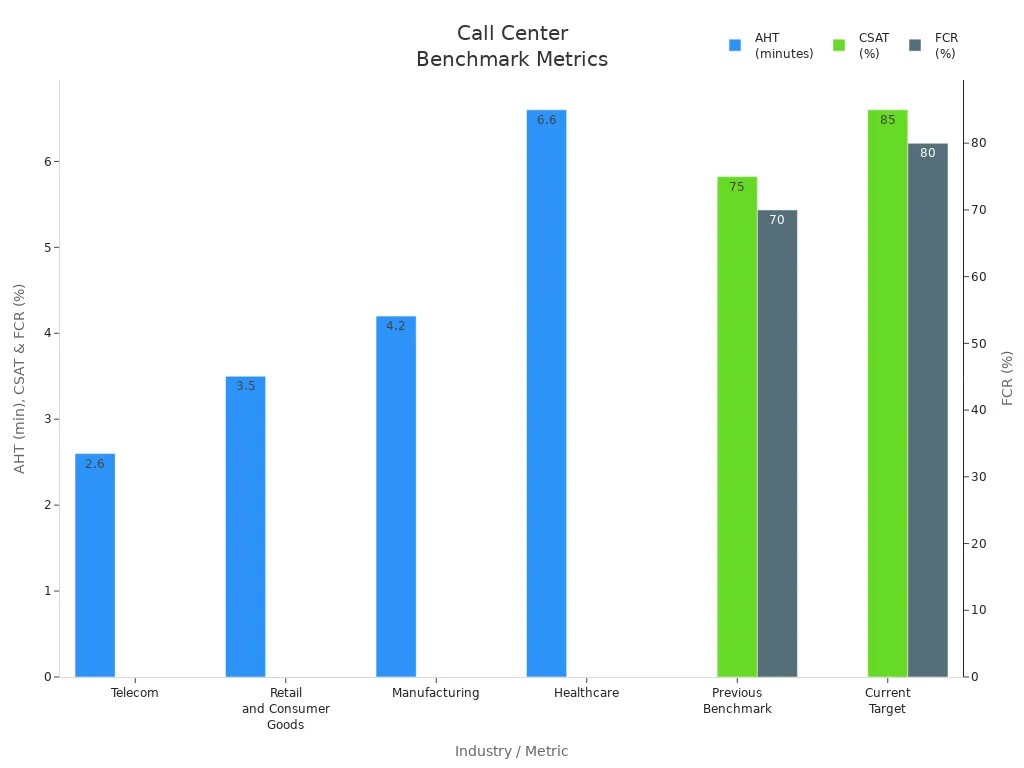
| First Call Resolution (FCR) | Directly affects satisfaction | Reduces repeat calls | >75% |
| Customer Satisfaction (CSAT) | Measures experience | Indicates service quality | >85% |
| Average Handle Time (AHT) | Can affect quality if rushed | Impacts staffing needs | 5-7 minutes |
| Average Wait Time | Affects first impression | Impacts abandonment rates | <60 seconds |
You should also watch these customer success dashboard metrics:
- Net Promoter Score (NPS): Shows how likely customers are to recommend you.
- Average Speed of Answer (ASA): Tells you how fast agents pick up calls.
- Average Resolution Time (ART): Measures how long it takes to fix issues.
- Customer Effort Score (CES): Shows how easy it is for customers to get help.
Industry benchmarks say that a good average handle time is about 3-4 minutes for most sectors. You should aim for a customer satisfaction score above 85%. High first call resolution rates, above 75%, lead to happier customers (source).
Data Sources Integration
Your cx dashboard works best when you bring together data from many places. You should connect social marketing data, eCommerce data, and customer care data. Social media shows what customers think and how they interact with your brand. eCommerce data reveals buying habits and key points in the customer journey. Customer care data tracks feedback, case management, and response times.
To build a strong customer service dashboard, you need to:
- Collect data from all channels using APIs and connectors.
- Store everything in one place to avoid errors and confusion.
- Clean and standardize data so it is accurate and easy to use.
- Activate data for real-time insights in your customer success dashboard.
- Set up controls to keep data safe and reliable.
You should check data quality often. Use validation and regular audits to make sure your customer experience dashboard shows true numbers. This helps you trust your customer satisfaction metrics and make better decisions.
Sobot Voice/Call Center Metrics

Sobot’s Voice/Call Center solution gives you advanced customer success metrics for your cx dashboard. You can track real-time speech recognition, call routing, and agent performance. Sobot’s AI-powered Voicebot handles over half of inbound calls, freeing your team for complex issues. The system shows how fast agents respond, how many calls get solved on the first try, and how happy customers feel.
You get a unified workspace that combines voice, chat, email, and social media data. Sobot’s AI Copilot suggests replies and drafts summaries, making agents more efficient. The platform provides secure AI tools that protect customer data and meet compliance standards. Sobot’s customer experience dashboard helps you see the whole customer journey, spot trends, and improve customer satisfaction. You can use these insights to boost loyalty, increase revenue, and make your customer success dashboard a powerful tool for growth.
Steps to Build a Customer Service Dashboard
Building a cx dashboard that delivers real-time insights takes careful planning and the right approach. You can follow these steps to build a customer service dashboard that helps your team work smarter and respond faster to customer needs.
Define Objectives
Start by setting clear goals for your cx dashboard. You want your dashboard to match your business needs and help your team reach their targets. Think about what you want to achieve. Do you want to reduce response times, improve customer satisfaction, or increase first contact resolution? Write down your main objectives and break them into smaller, measurable goals.
Tip: Involve people from different teams, like product management, sales, and data science. This helps you see the big picture and makes sure your dashboard supports everyone’s needs.
A good way to define your objectives is to:
- Set clear goals that match your business strategy.
- Choose sub-indicators that support your main goals, such as response time or customer satisfaction.
- Build a business case to show how your dashboard will add value.
- Make sure your objectives connect to your service level agreements (SLAs).
Leading companies use dashboards to connect team goals to the company’s bigger mission. They use regular check-ins and feedback to keep everyone on track. This helps your team understand how their work supports the company’s success.
Select KPIs
Once you know your goals, pick the right KPIs for your cx dashboard. KPIs are the numbers that show if you are meeting your objectives. You should choose KPIs that are specific, measurable, and easy to understand.
Here are some important KPIs for a cx dashboard:
- Customer Satisfaction (CSAT): Shows how happy customers are after each interaction.
- Net Promoter Score (NPS): Measures how likely customers are to recommend your business.
- First Contact Resolution (FCR): Tracks how often you solve problems on the first try.
- Average Handle Time (AHT): Tells you how long it takes to solve each issue.
- Customer Effort Score (CES): Shows how easy it is for customers to get help.
- Agent Satisfaction (ASAT): Measures how happy your agents feel at work.
- Cost Per Contact: Helps you see how much each support request costs.
Note: Limit your cx dashboard to 5-10 KPIs. Too many numbers can make it hard to focus and slow down decision-making.
Pick KPIs that match your business goals. Make sure they are SMART: Specific, Measurable, Achievable, Relevant, and Time-bound. Review your KPIs often and update them as your business changes. Avoid vanity metrics that look good but do not help you make better decisions.
Integrate Data
Your cx dashboard needs data from many sources to give you a full view of your customer service. You should connect your dashboard to systems like CRM, e-commerce, chat, email, and phone. Sobot makes this easy with seamless integration across channels like WhatsApp, SMS, and social media.
Follow these steps to integrate your data:
- List all the data sources you need, such as databases, APIs, and third-party apps.
- Use ETL (Extract, Transform, Load) tools to collect and clean your data.
- Transform your data so it matches your dashboard’s needs.
- Load the data into your dashboard platform.
- Set up charts and graphs to show your data clearly.
- Test your dashboard to make sure the data is correct.
You may face challenges like data quality issues, missing or duplicate data, and different formats. Strong data governance and regular audits help keep your data accurate. Sobot’s platform supports real-time integration, so you always see the latest information.
Tip: Automate your data updates to save time and reduce errors. This keeps your cx dashboard fresh and reliable.
Choose Tools
Pick a dashboard tool that fits your needs and works well with your existing systems. Look for tools that support real-time updates, easy integration, and clear visualizations. Sobot offers a unified workspace that brings together voice, chat, email, and social media data. This makes it easy for your team to see everything in one place.
Here is a table comparing some popular dashboard tools:
| Tool Name | Key Features | Best For |
|---|---|---|
| Sobot | Omnichannel, real-time, scalable | All business sizes |
| Power BI | Real-time connectors, AI insights | Enterprises |
| Tableau | Advanced visuals, real-time updates | Data analysts |
| Zoho Analytics | Drag-and-drop, AI-powered insights | Small businesses |
| Databox | Mobile-friendly, fast setup | Quick tracking |
Sobot stands out for its easy integration, global reach, and ability to handle large volumes of customer interactions. Companies like OPPO and Samsung have improved their service efficiency and customer satisfaction using Sobot’s platform.
Design Layout
A good cx dashboard layout helps users find what they need quickly. Start by thinking about who will use the dashboard and what they want to see. Use clear titles and group related data together. Place the most important numbers at the top left, since people read from left to right.
- Clarify your audience and their goals.
- Use a simple layout with clear sections.
- Highlight key metrics with color and size.
- Keep the design consistent and easy to read.
- Use filters and drill-downs so users can explore data without feeling overwhelmed.
- Make sure your dashboard works for everyone, including people with color blindness.
Tip: Test your dashboard with real users. Watch how they use it and ask for their feedback. Make changes based on what you learn.
Research shows that users scan dashboards in F or Z patterns. Put the most important data in the top-left corner and use summaries at the top. This helps users find key information fast.
Enable Real-Time Updates
Real-time updates make your cx dashboard powerful. When your dashboard refreshes instantly, you can spot problems and act before they grow. Technologies like data streaming platforms (for example, Apache Kafka), in-memory computing, and cloud services help you keep your dashboard up to date.
Sobot’s platform uses real-time data integration, so you always see the latest customer feedback and team performance. AI tools in Sobot analyze data quickly and suggest actions, helping your team make faster decisions. Companies that use real-time dashboards see up to five times more engagement and three times higher conversion rates (source).
Note: Real-time dashboards help you respond to customer needs as they happen. This leads to better service and happier customers.
Continuous Improvement
Building a great cx dashboard is not a one-time job. You should collect customer feedback and team input regularly. Use this feedback to make small changes and keep your dashboard useful. Run usability tests, watch how users interact with the dashboard, and ask for their opinions. This helps you spot problems early and improve the dashboard over time.
Sobot supports continuous improvement by making it easy to update dashboards and add new features. You can prototype new layouts, test them with your team, and roll out changes quickly. This keeps your cx dashboard aligned with your business goals and customer needs.
Remember: The best dashboards grow with your business. Keep listening to your team and your customers, and your dashboard will always deliver value.
Effective Customer Success Dashboard Practices
Usability Tips
You want your customer success dashboard to be easy for everyone to use. Start by giving your team clear training so they know how to use the dashboard in their daily work. Show them how the dashboard helps them solve problems faster and track customer success metrics. When you highlight these benefits, your team feels more confident and motivated.
- Limit the number of widgets to between 5 and 9. This keeps your cx dashboard simple and avoids clutter.
- Group related information together. This helps your team find what they need quickly.
- Use the same colors, fonts, and text sizes. Consistency makes your dashboard easier to read.
- Fit everything on one screen. Scrolling can slow people down.
- Make your dashboard interactive. Filters and drilldowns let users explore data on their own.
Sobot’s unified workspace brings together voice, chat, and social data, making it easy for agents to see the full picture. OPPO used Sobot’s dashboard to handle more customer questions with less effort, showing how a customer service dashboard empowers your team.
Visualization Best Practices
Good visuals help you understand your customer success dashboard at a glance. Use clear charts and graphs that show trends and patterns without confusion. Keep your visuals simple and avoid too many colors or shapes. Always check that your data is accurate before sharing it.
Visualization best practices for designing a customer service dashboard focus on clarity, accuracy, and accessibility. Simple visuals help everyone, from agents to managers, make quick decisions. When you follow these best practices for customer success dashboards, you build trust in your data and improve customer satisfaction.
Tip: Use bar charts for comparisons and line charts for trends. Avoid 3D effects or animations that can distract from the real message.
Team Adoption
Your cx dashboard works best when your whole team uses it. Design your dashboard to answer the most important questions your team faces each day. Make sure the dashboard is easy to use, with clear navigation and helpful filters.
- Focus on the needs of your main user group.
- Provide training and support so everyone feels comfortable.
- Make the dashboard actionable, so users can make decisions quickly.
- Build trust by showing accurate, up-to-date data.
- Collect customer feedback and monitor usage to spot areas for improvement.
Sobot helps teams adopt dashboards by offering tailored training and a unified workspace. When OPPO rolled out Sobot’s dashboard, they saw a 94% positive feedback rate and a big jump in repurchase rates. This shows the value of an effective customer success dashboard.
Continuous Improvement
Treat your customer success dashboard as a living tool. Set clear goals and update your dashboard with real-time data. Ask your team for feedback and make changes based on their needs. Regular updates keep your dashboard relevant and useful.
- Align your dashboard with your business goals.
- Streamline the interface for clarity.
- Use customer feedback to guide improvements.
- Provide ongoing training to help users get the most from the dashboard.
- Validate your data often to keep trust high.
Sobot supports continuous improvement by making it easy to update dashboards and add new features. You can test new layouts, gather feedback, and roll out changes quickly. This approach keeps your cx dashboard aligned with your goals and helps you deliver better service over time.
Overcoming Dashboard Challenges
Building a customer service dashboard brings many benefits, but you will face some common challenges when building a customer service dashboard. Knowing these challenges helps you prepare and find solutions that work for your team.
Data Quality
You need good data to make smart decisions. Bad data can lead to wrong choices and unhappy customers. For example, if your dashboard shows old or incorrect numbers, you might miss a problem. You should check your data often. Clean your data by removing duplicates and fixing errors. Sobot’s platform helps you keep data accurate by using real-time updates and automated checks. This means you always see the latest and most reliable information.
Integration Issues
You may use many tools for customer service, like chat, email, and phone systems. Getting all these tools to work together can be hard. Sometimes, data does not flow smoothly between systems. Sobot solves this by offering seamless integration with popular CRMs and communication channels. You can connect your dashboard to WhatsApp, SMS, and social media. This unified workspace lets you see everything in one place, making your job easier.
User Adoption
A dashboard only helps if your team uses it. Some people may not want to change how they work. You can help your team by giving clear training and showing how the dashboard saves time. Sobot supports teams with easy-to-use layouts and helpful guides. When OPPO used Sobot’s dashboard, their team handled more questions with less effort. This led to higher customer satisfaction.
Maintaining Real-Time Performance
You want your dashboard to show live data. Slow updates can cause delays and missed issues. Sobot’s system refreshes data automatically, so you always see what is happening right now. Real-time dashboards help you spot problems early and act fast. Studies show that companies with real-time insights respond to customers up to 60% faster (source).
Tip: Review your dashboard setup every few months. This keeps your data fresh and your team ready for new challenges.
You gain real-time insights when you build a customer success dashboard with Sobot. You see trends and spot issues fast. Sobot’s Voice/Call Center and omnichannel solutions help you improve customer satisfaction and team performance. OPPO increased its repurchase rate by 57% using Sobot’s dashboard. You can keep improving your dashboard with feedback and updates. Visit Sobot’s website or email marketing@sobot.io to start your journey.
FAQ
How does a customer service dashboard help you improve response times?
A customer service dashboard shows live data. You see how fast agents reply to customers. Sobot’s real-time updates let you spot slow responses and fix them quickly. Fast replies boost customer satisfaction. Studies show 90% of customers want immediate answers (Statista).
What are the most important metrics for a customer service dashboard?
You should track first response time, average handle time, customer satisfaction scores, and first contact resolution. Sobot’s dashboard includes these customer success metrics. These numbers help you measure team performance and improve your customer experience dashboard.
Can you connect a customer service dashboard to different channels?
Yes, you can link your dashboard to chat, email, phone, and social media. Sobot’s omnichannel solution lets you see all customer interactions in one place. This unified workspace helps you manage customer care data and get real-time insights from every channel.
How does Sobot keep your customer service dashboard data secure?
Sobot uses encrypted data transfer and secure cloud storage. You get 99.99% uptime and global network support. Sobot’s platform protects customer data and meets compliance standards. You can trust your customer service dashboard to keep information safe.
What steps should you follow to build a customer service dashboard?
You start by setting clear goals. Next, you select key customer success metrics. Then, you integrate data from all sources. You choose a dashboard tool like Sobot. Finally, you design a simple layout and enable real-time updates for your customer experience dashboard.
Tip: Review your dashboard often. Update metrics and layout to match your business needs.
See Also
Enhancing Call Center Efficiency Through Effective Monitoring Techniques
Expert Strategies To Excel At Live Chat Support
Top Ten Ways To Improve Customer Satisfaction Via Live Chat