Mastering Average Resolution Time Reports Made Simple

Understanding how quickly your customer support teams resolve issues can transform the way your business operates. The average resolution time, a key metric in customer support, measures the time taken to resolve customer inquiries. Faster resolution times often lead to happier customers and stronger loyalty. Monitoring this metric also helps you assess team performance and pinpoint areas for improvement.
- Calculating resolution time evaluates the efficiency of your support teams.
- Optimizing workflows based on this data boosts customer satisfaction and retention.
Top-performing companies achieve an average resolution time of 1.67 hours, setting a benchmark for excellence. Tools like Sobot enable you to track and optimize this critical metric, ensuring your teams stay ahead.
Understanding Average Resolution Time

What Is Average Resolution Time?
Average resolution time measures how long it takes your customer support teams to resolve issues after they are reported. This customer service metric focuses on the efficiency of your team in addressing customer concerns. It is calculated by dividing the total resolution time by the number of tickets resolved during a specific period. Shorter resolution times often indicate streamlined processes and better customer experience.
Different industries have varying benchmarks for resolution time. For example, e-commerce and software companies aim for faster resolutions compared to finance or healthcare sectors. The complexity of issues also plays a role. Simple problems resolve quickly, while intricate ones require more time. Customer expectations further influence benchmarks, as industries with high service standards demand tighter resolution goals.
| Factor | Description |
|---|---|
| Industry type | Varies; e-commerce and software need faster resolutions than finance/healthcare. |
| Issue complexity | Simple issues resolve quickly; complex issues take longer. |
| Customer expectations | Industries with high service standards have tighter resolution benchmarks. |
Why Is Average Resolution Time Important for Customer Support?
Tracking average resolution time helps you identify inefficiencies and improve workflows. Faster resolution times enhance customer satisfaction, which builds loyalty and strengthens your brand reputation. This metric also provides insights into the performance of your customer support teams, enabling you to allocate resources effectively.
Real-world examples highlight its importance:
- Jeffco Public Schools reduced resolution time from 3 weeks to 3 days by streamlining processes and integrating tools.
- Brastel implemented automated workflows, cutting ticket handling time by 39%.
- Cymax Group centralized multichannel support, improving visibility and reducing response times.
These success stories demonstrate how optimizing resolution time can transform customer experience and operational efficiency.
Formula for Calculating Average Resolution Time
Calculating average resolution time is straightforward. Use the formula:
Average Resolution Time = Total Resolution Time ÷ Number of Tickets Resolved
For example, if your team resolves 50 tickets in a week with a total resolution time of 100 hours, the average resolution time is:
100 hours ÷ 50 tickets = 2 hours per ticket
This calculation helps you monitor trends and set realistic goals for your team. Tools like Sobot’s Ticketing System simplify this process by automating data collection and providing trusted analytics.
Collecting Data for Average Resolution Time Reports
Identifying Key Data Points
To calculate average resolution time effectively, you need to focus on specific data points. Start by logging and capturing requests as soon as they are created. Record the ticket creation time and resolution time for every case. Categorize and prioritize tickets based on urgency and type. This ensures that your team handles high-priority issues promptly. Assign tickets to the right agents using triage methods, and escalate complex cases to higher-tier support when necessary. Once resolved, log the resolution details and collect feedback from customers.
Analyzing this data provides valuable insights into your customer service metric. It helps you identify recurring issues and inconsistencies, enabling you to optimize workflows. For example, tracking resolution time trends can reveal bottlenecks in your process. By addressing these, you improve customer experience and operational efficiency.
Using Tools Like Sobot's Ticketing System for Data Collection
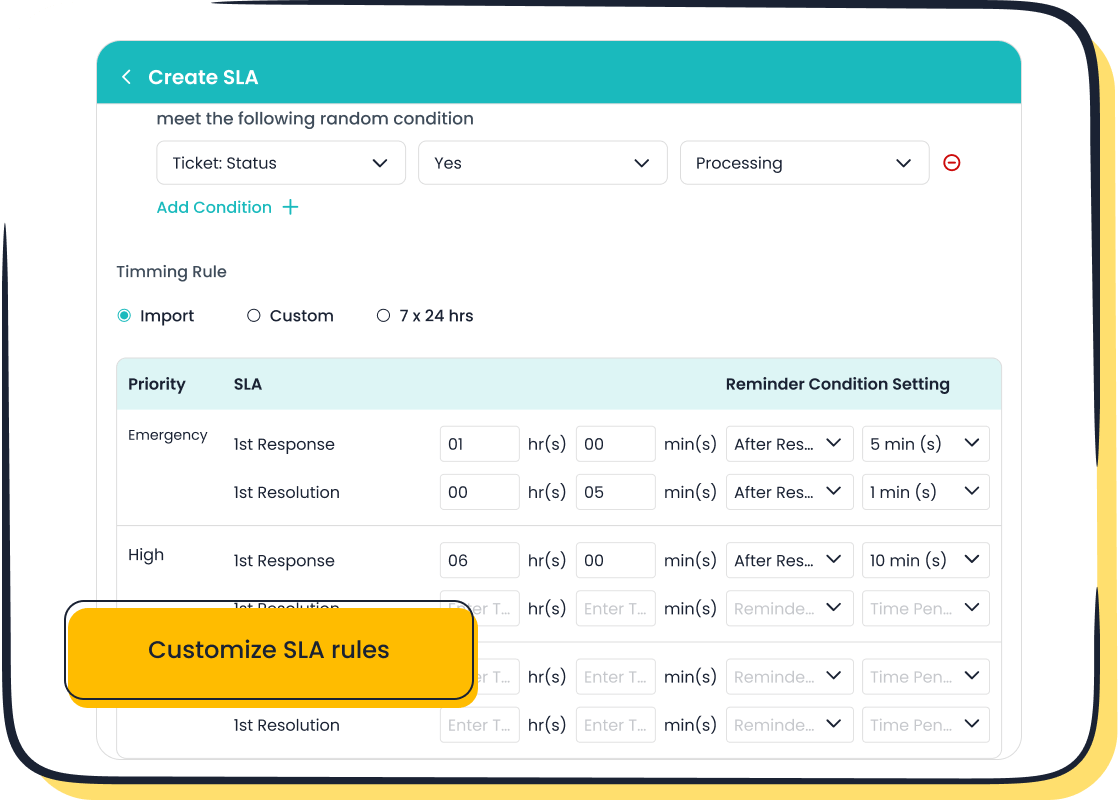
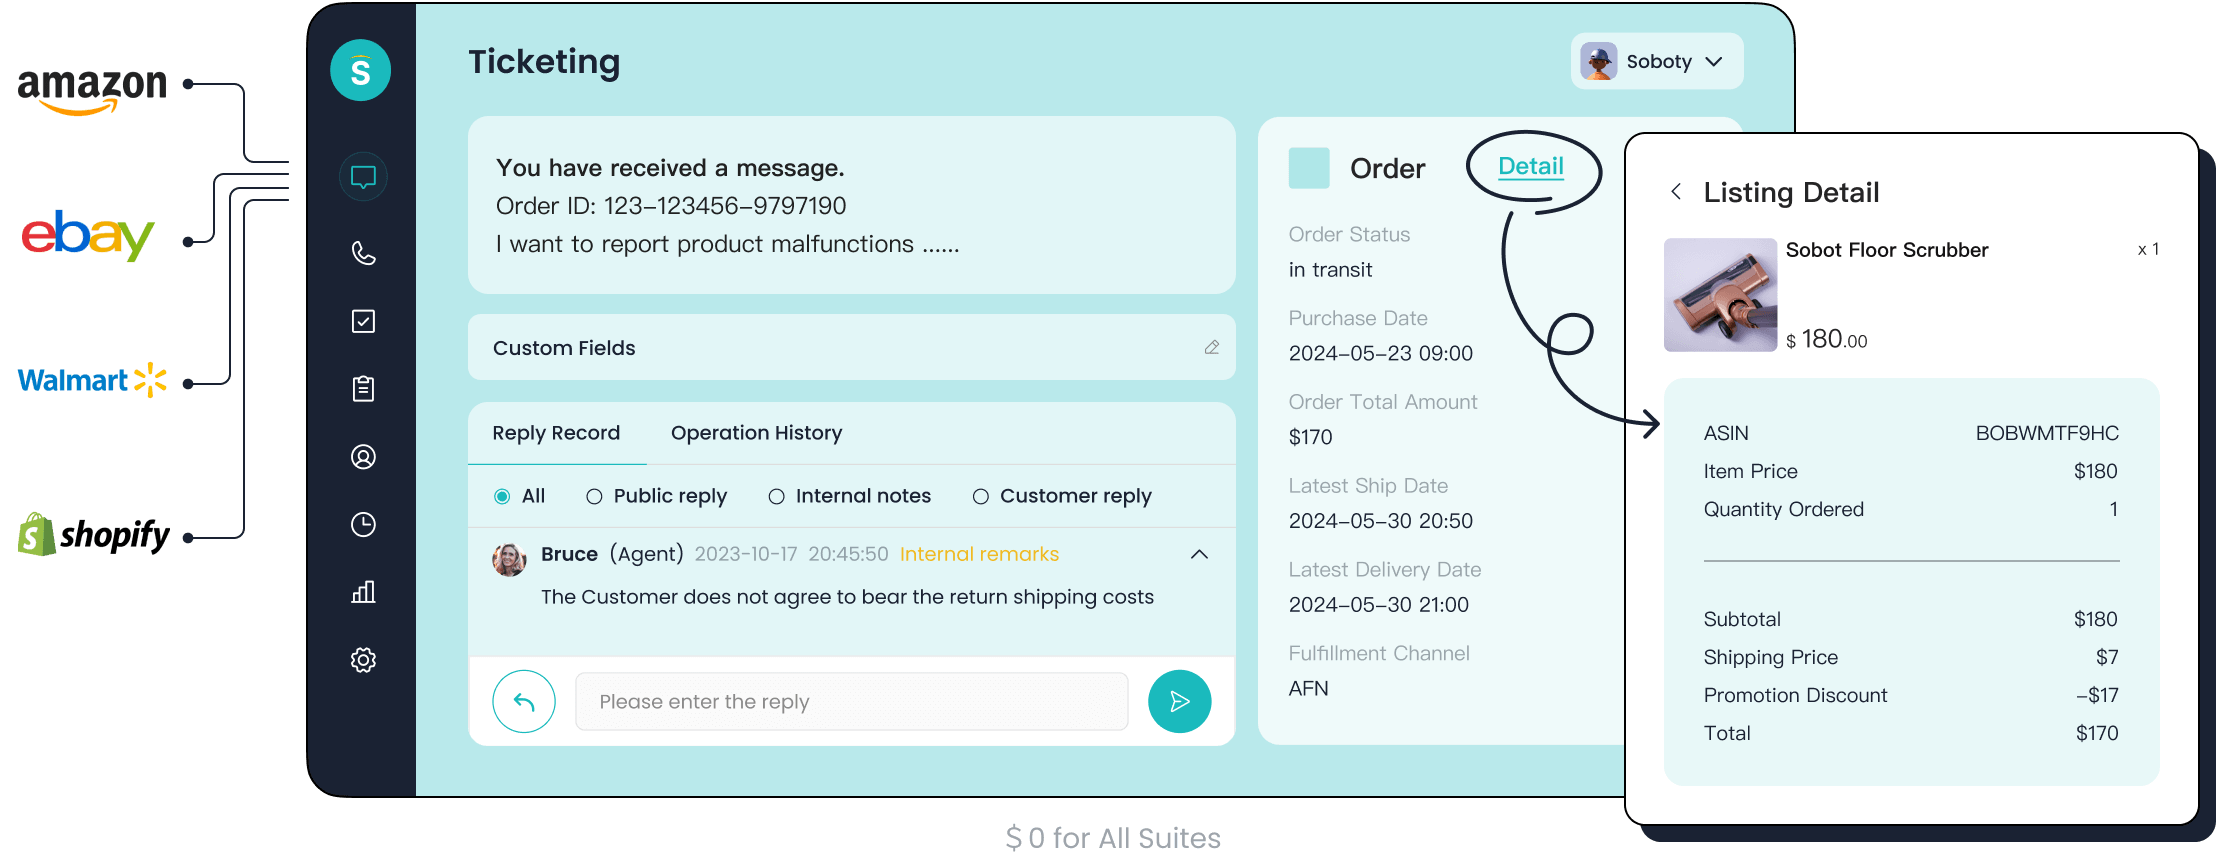
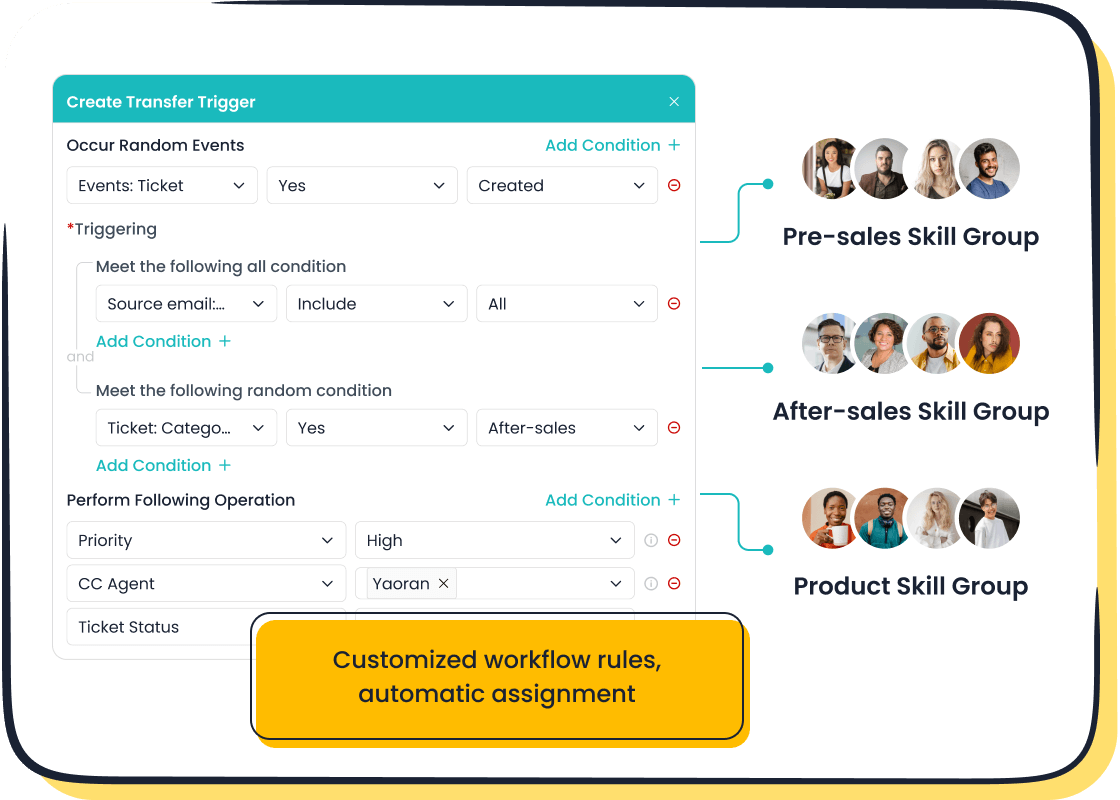
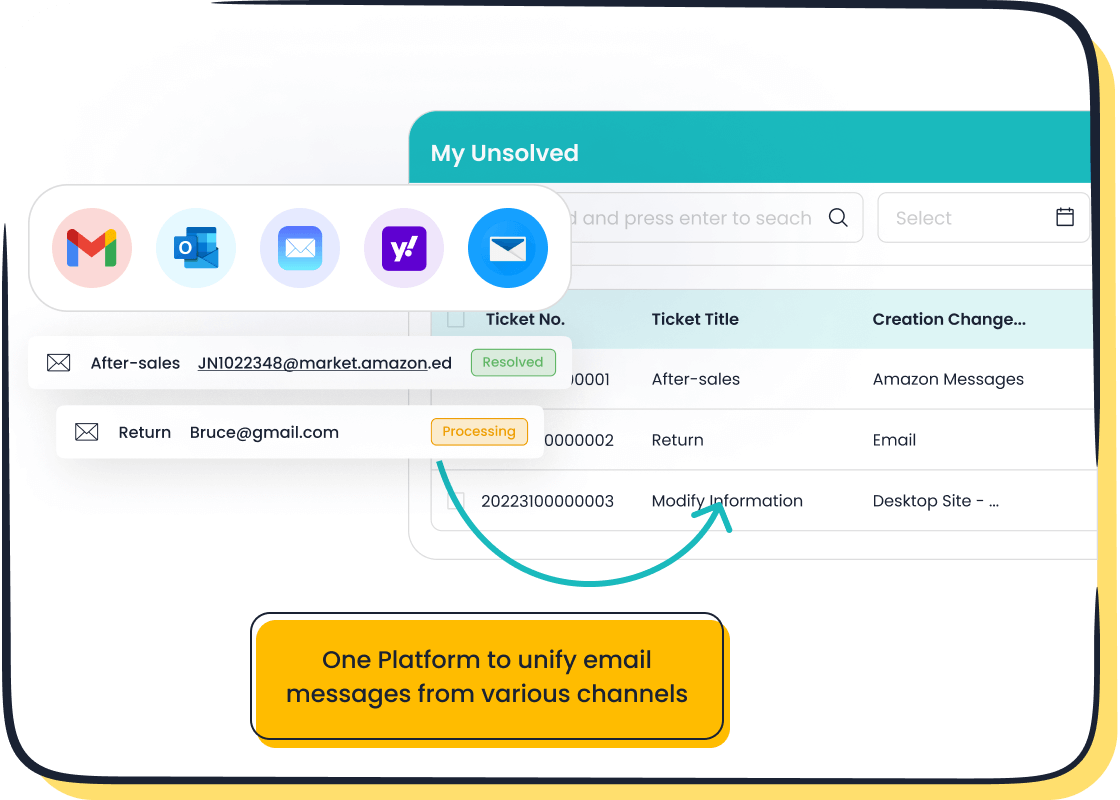
Sobot’s Ticketing System simplifies data collection for average resolution time reports. The system automates ticket creation, routing, and resolution tracking. It integrates all communication channels, ensuring no ticket gets overlooked. With features like SLA management and trusted analytics, Sobot helps you monitor total resolution time and the number of tickets resolved with precision.
Sobot’s smart ticketing system prioritizes tickets based on urgency, helping your team stay organized and efficient. It also provides multilingual support, making it ideal for global customer service operations.
For example, OPPO used Sobot’s solutions to streamline its customer service processes. By integrating global customer channels and automating workflows, OPPO achieved an 83% chatbot resolution rate and a 94% positive feedback rate. These results highlight how tools like Sobot can enhance customer satisfaction and reduce time to resolution.
Ensuring Data Accuracy and Consistency
Accurate data is essential for reliable average resolution time reports. Use statistical methods like imputation to fill in missing values and outlier detection to identify extreme data points. Standardize formats for ticket labels and timestamps to maintain consistency.
| Method | Description |
|---|---|
| Imputation | Fill in missing values using statistical methods like mean or median. |
| Outlier Detection | Identify extreme values using z-scores or IQR. |
| Standardizing Formats | Ensure consistent labeling and formatting for all data points. |
By ensuring data accuracy, you avoid skewed results and gain actionable insights. Sobot’s analytics tools further enhance data reliability, helping you make informed decisions to improve customer experience.
Calculating Average Resolution Time
Step-by-Step Guide to Calculating Resolution Time
Calculating resolution time involves a straightforward process. By following a few steps, you can determine how efficiently your team resolves customer issues. This calculation helps you monitor performance and improve the customer experience.
- Gather Data: Start by collecting the total resolution time for all tickets resolved during a specific period. This includes the time from when a ticket is created to when it is marked as resolved.
- Count Resolved Tickets: Identify the total number of tickets resolved within the same time frame.
- Apply the Formula: Use the resolution time formula to calculate the average resolution time:
Average Resolution Time = Total Resolution Time ÷ Number of Tickets Resolved - Analyze Results: Compare the calculated average resolution time with industry benchmarks or your internal goals. This helps you identify areas for improvement.
For example, if your team resolves 100 tickets in a week and the total resolution time is 2,000 minutes, the formula would look like this:
Average Resolution Time = 2,000 minutes ÷ 100 tickets = 20 minutes per ticket
This step-by-step approach ensures you calculate this customer service metric accurately. Tools like Sobot’s Ticketing System can automate this process, saving you time and reducing errors.
Example Calculation for Better Understanding
Let’s break down an example to make the calculation even clearer. Imagine your customer support team resolves 50 tickets in a week. The total resolution time for these tickets is 1,500 minutes. Using the resolution time formula, you can calculate the average resolution time as follows:
- Step 1: Total resolution time = 1,500 minutes
- Step 2: Number of tickets resolved = 50
- Step 3: Apply the formula:
Average Resolution Time = Total Resolution Time ÷ Number of Tickets ResolvedSubstituting the values:
Average Resolution Time = 1,500 minutes ÷ 50 tickets = 30 minutes per ticket
This means your team takes an average of 30 minutes to resolve each ticket.
Now, consider another scenario. If your team resolves 200 tickets in a month with a total resolution time of 10,000 minutes, the calculation would be:
- Step 1: Total resolution time = 10,000 minutes
- Step 2: Number of tickets resolved = 200
- Step 3: Apply the formula:
Average Resolution Time = 10,000 minutes ÷ 200 tickets = 50 minutes per ticket
These examples highlight how you can use this formula to track and improve your team’s performance. Shorter resolution times often lead to better customer satisfaction and a more positive customer experience.
By regularly calculating and analyzing this metric, you can identify trends and make data-driven decisions to enhance your workflows. Sobot’s Ticketing System simplifies this process by automating data collection and providing trusted analytics. This allows you to focus on improving customer satisfaction and delivering exceptional service.
Creating an Effective Average Resolution Time Report
Choosing the Right Reporting Tool or Format
Selecting the right tools and formats is crucial for creating effective reports. Tools that offer visualizations and trend analysis make it easier to interpret resolution time data. Gadgets like Cycle Time Trend, Control Chart, and Histogram Chart provide valuable insights into average resolution time.
| Gadget Name | Contribution to Average Resolution Time Reporting |
|---|---|
| Cycle Time Trend Gadget | Displays average resolution time for past intervals and trends. |
| Control Chart Gadget | Shows average resolution time and helps identify outliers. |
| Histogram Chart Gadget | Visualizes average resolution time and its distribution. |
These tools simplify data presentation and highlight patterns that might otherwise go unnoticed. For example, a Cycle Time Trend Gadget can show whether your resolution time is improving or stagnating over weeks or months. Using these gadgets ensures your reports are not only informative but also actionable.
When choosing a format, prioritize clarity. Tables, charts, and dashboards work well for summarizing data. Dashboards, in particular, allow real-time monitoring of resolution time metrics, helping you stay proactive in addressing inefficiencies.
Organizing Data into Clear and Actionable Sections
Organizing your report effectively ensures the data is easy to understand and act upon. Follow these steps to structure your report:
- Define the purpose and audience.
- Identify relevant metrics and KPIs.
- Gather accurate and timely data.
- Organize the data in a clear and concise manner.
- Provide context and analysis.
- Highlight trends and patterns.
- Compare to benchmarks and industry standards.
- Include recommendations and action items.
- Review and refine regularly.
Each section should serve a specific purpose. For instance, the trends and patterns section can reveal recurring issues that impact resolution time. Comparing your metrics to industry benchmarks helps you understand where your team stands and what improvements are necessary.
Use tables and charts to present data clearly. For example, a table showing resolution time trends across different months can help you identify seasonal fluctuations. Recommendations should be actionable, such as implementing automated workflows or reallocating resources to high-priority tasks.
Adding Insights and Trends to the Report
Insights and trends transform raw data into actionable strategies. Analytical methods like predictive analytics and machine learning uncover hidden patterns in resolution time data. These methods help you forecast future trends and make informed decisions to improve customer experience.
| Analytical Method | Description |
|---|---|
| Advanced Analytics Tools | Convert raw data into actionable insights, revealing hidden patterns and trends. |
| Predictive Analytics | Identifies patterns and forecasts future trends for informed decision-making. |
| Machine Learning | Detects complex patterns in large datasets using sophisticated algorithms. |
| Data Visualization | Transforms complex data into understandable formats, highlighting key trends effectively. |
| Dashboards | Organizes information into digestible formats for real-time monitoring of key performance indicators. |
For example, predictive analytics can help you anticipate peak periods when resolution time might increase. Machine learning algorithms can identify recurring issues that slow down ticket resolution. Dashboards provide a snapshot of your team’s performance, enabling you to monitor trends in real time.
Adding insights to your report helps you understand the "why" behind the numbers. If resolution time spikes during certain months, you can investigate whether it’s due to increased ticket volume or inefficiencies in workflows. Highlighting these trends allows you to take proactive measures, such as training agents or optimizing ticket routing.
By leveraging tools like Sobot’s Ticketing System, you can automate data collection and analysis, ensuring your reports are accurate and actionable. This approach not only improves customer satisfaction but also enhances operational efficiency.
Analyzing and Interpreting Average Resolution Time Reports
Identifying Key Insights from the Report
Analyzing resolution time data reveals patterns that help you understand your team’s performance. Historical trend analysis shows how resolution times have evolved, helping you identify improvements or setbacks. Seasonal variation identification highlights peak periods when resolution times may increase due to higher ticket volumes. Predictive insights allow you to forecast future trends based on past data, enabling proactive planning.
Use these techniques to uncover recurring issues that slow down ticket resolution. For example, if resolution times spike during holiday seasons, you can prepare by allocating more resources or automating workflows. By interpreting these insights, you gain a clearer picture of how your team operates and where adjustments are needed to improve customer experience.
Providing Actionable Recommendations for Improvement
Turning insights into action requires a strategic approach. Factors like staff workload, training, query complexity, and communication structure influence resolution time. A well-trained team resolves queries faster, while unclear communication can lead to delays.
To drive improvements:
- Give your support teams a clear view of daily trends and recurring issues.
- Provide leadership with high-impact insights that guide strategic decisions.
- Customize reports for different teams, ensuring everyone gets relevant data.
- Turn customer feedback into actionable steps, enhancing customer satisfaction.
Focus on key metrics to refine your strategy:
- Compare tickets created versus resolved to assess if your team meets customer demand.
- Monitor first response time and average resolution time to evaluate efficiency.
- Track escalation rates and one-touch resolution to ensure tickets are resolved effectively.
- Review agent performance to identify coaching opportunities and reward top performers.
These practices help you optimize workflows, reduce resolution time, and improve customer experience.

Leveraging Sobot's Ticketing System for Continuous Monitoring
Sobot’s Ticketing System simplifies the process of monitoring resolution time. Its trusted analytics provide real-time insights into ticket trends and agent performance. Features like SLA management ensure your team meets resolution goals consistently.
The system’s unified platform integrates all communication channels, eliminating data fragmentation. Multilingual support makes it ideal for global operations, while smart notifications keep your team informed about critical updates. By leveraging Sobot’s tools, you can continuously track resolution time and make data-driven decisions to enhance customer satisfaction.
For example, OPPO used Sobot’s solutions to streamline workflows and achieve an 83% chatbot resolution rate. This success demonstrates how Sobot’s Ticketing System can transform your customer experience by reducing resolution time and improving efficiency.
Creating an average resolution time report involves a few simple steps. Start by collecting accurate data, calculate the metric using the formula, and organize the results into actionable insights. Regularly tracking this metric helps you improve workflows and boost customer satisfaction. It also ensures your team delivers a better customer experience by resolving issues efficiently.
To simplify the process, explore tools like Sobot's Ticketing System. Its automation and analytics features save time and provide reliable data, helping you focus on enhancing your support operations.
FAQ
What is the ideal average resolution time for customer support teams?
The ideal average resolution time depends on your industry. For example, e-commerce companies aim for under 24 hours, while technical support teams may take longer for complex issues. Use industry benchmarks and customer expectations to set realistic goals.
How can Sobot’s Ticketing System help reduce resolution time?
Sobot’s Ticketing System automates ticket routing and prioritization. It integrates communication channels into one platform, ensuring faster responses. Features like SLA management and analytics help you monitor performance and identify areas for improvement.
Why is tracking average resolution time important?
Tracking this metric helps you measure team efficiency and identify bottlenecks. Faster resolution times improve customer satisfaction and loyalty. It also provides insights into resource allocation and workflow optimization.
Can Sobot’s tools handle multilingual customer support?
Yes, Sobot’s Ticketing System supports multiple languages. It translates tickets automatically, allowing your team to assist customers in their preferred language. This feature makes it ideal for global businesses.
How often should you review average resolution time reports?
Review reports weekly or monthly to monitor trends and address inefficiencies. Regular reviews help you stay proactive and ensure your team meets resolution goals consistently.
See Also
Excelling in Live Chat for Customer Assistance
Tips for Efficiently Overseeing Live Chat Representatives
Enhancing Call Center Efficiency Through Effective Oversight