Understanding Net Promoter Scores by Industry in 2025

The Net Promoter Score (NPS) measures how likely customers are to recommend your business to others. In 2025, this metric has become a cornerstone for evaluating customer satisfaction and loyalty. Businesses use NPS to gauge their customer experience and identify areas for improvement. For example, industries like Healthcare and Ecommerce have seen notable increases in their scores, highlighting the growing emphasis on enhancing satisfaction.
Understanding the average net promoter score by industry helps you set realistic goals and identify competitive gaps. For instance, sectors such as Banking and Grocery Retail maintain solid benchmarks at 41, while Insurance trails at 33. Sobot’s advanced contact center solutions empower businesses to improve their NPS by streamlining communication and delivering personalized customer interactions.
What is Net Promoter Score (NPS)?
Definition and Purpose of NPS
Net Promoter Score (NPS) is a customer loyalty metric that measures how likely your customers are to recommend your business to others. It provides a clear indicator of customer satisfaction and brand loyalty. By analyzing NPS, you can identify areas where your business excels and where it needs improvement.
NPS serves multiple purposes:
- It helps you understand customer satisfaction levels and their willingness to recommend your brand.
- It provides insights into acquiring new customers and increasing the lifetime value of existing ones.
- Addressing detractors' concerns can transform them into promoters, enhancing your brand reputation.
In 2025, businesses increasingly rely on NPS to predict future sales growth and tailor engagement strategies. This makes it a vital tool for staying competitive in a customer-centric market.
How NPS is Calculated
The calculation of NPS is straightforward and involves categorizing customers based on their responses to a single question: "How likely are you to recommend us to a friend or colleague?" Customers rate their likelihood on a scale of 0 to 10.
| Component | Description |
|---|---|
| Promoters | Respondents who rate 9 or 10. |
| Passives | Respondents who rate 7 or 8. |
| Detractors | Respondents who rate 6 or lower. |
| Calculation | NPS is calculated by subtracting the percentage of detractors from the percentage of promoters. |
| Result Range | NPS can range from -100 to +100, with positive scores indicating good customer loyalty. |
For example, if 60% of your respondents are promoters, 20% are passives, and 20% are detractors, your NPS would be 60 - 20 = 40. This score reflects the overall sentiment of your customer base.
Why NPS Matters for Businesses in 2025
In 2025, NPS has become a cornerstone for businesses aiming to enhance customer satisfaction and loyalty. Regularly collecting NPS data allows you to adapt to customer needs and maintain high satisfaction levels.
Understanding your NPS survey results helps you segment customers into promoters, passives, and detractors. This segmentation enables you to identify success points and areas needing improvement. For instance, addressing detractors' criticisms can boost loyalty and generate positive referrals.

NPS also serves as a long-term metric for brand referability. A high score indicates trust and a strong likelihood of customer retention. Companies like Samsung have leveraged tools like Sobot's contact center solutions to unify communication channels and improve their NPS. By integrating advanced features such as AI-powered voicebots and real-time analytics, businesses can deliver personalized experiences that foster loyalty and drive growth.
Average Net Promoter Score by Industry

Overview of NPS Benchmarks Across Industries
Understanding the average net promoter score by industry helps you evaluate your business performance against competitors. Each industry has unique customer expectations, which influence its NPS benchmarks. For example, industries like Travel & Hospitality often achieve higher scores due to their focus on personalized experiences, while Telecommunications typically struggles with lower scores because of service reliability issues.
Here’s a snapshot of NPS ranges across key industries:
| Industry | NPS Range |
|---|---|
| Retail | 40-70 |
| Technology & SaaS | 30-60 |
| Healthcare | 40-70 |
| Financial Services | 30-60 |
| Travel & Hospitality | 50-80 |
| Telecommunications | 0-30 |
These benchmarks reflect the diversity in customer expectations and satisfaction levels. For instance, Retail and Healthcare often score higher due to their emphasis on customer-centric services. On the other hand, Telecommunications faces challenges with pricing and service reliability, which impact its scores.
A recent market survey analyzed over 63,000 brand ratings across 23 sectors, providing valuable insights into NPS variations. The study revealed that industries like Airlines, Automotive, and Consumer Banking consistently collect data from over 1,000 companies annually. This extensive data collection ensures accurate benchmarking and helps businesses like yours identify areas for improvement.
Factors Influencing NPS Variations
Several factors contribute to the variations in NPS benchmarks across industries. These factors often depend on the nature of the industry and the specific needs of its customers.
| Industry | Key Factors Affecting NPS |
|---|---|
| Technology | Product functionality, customer support responsiveness, ease of integration |
| Retail | Product availability, shopping experience, delivery policies |
| Healthcare | Quality of care, communication, wait times |
| Financial Services | Transparency, customer support, ease of online services |
| Hospitality & Travel | Staff professionalism, cleanliness, booking convenience |
| Telecommunications | Service reliability, customer service, pricing options |
For example, in Retail, factors like product availability and delivery policies significantly impact customer satisfaction. In contrast, Healthcare relies heavily on the quality of care and communication. These differences highlight why industry-specific benchmarks are essential for accurate assessment.
You should also consider how external factors, such as economic conditions or technological advancements, influence NPS. For instance, the rise of AI-powered solutions has transformed customer service in industries like Retail and Technology. Tools like Sobot’s AI platform enable businesses to provide personalized, omnichannel support, which can boost NPS by addressing customer needs more effectively.
It’s important to note that while external benchmarks provide a useful reference, they may not always align with your business’s unique circumstances. Variations in survey methodologies and customer demographics can lead to discrepancies. Therefore, you should use these benchmarks as a guide rather than a definitive measure of success.
NPS Benchmarks in Technology and Software
Typical NPS Range for Technology Companies
Technology companies often achieve diverse NPS scores due to varying customer expectations and service quality. In 2025, the typical NPS range for these companies spans from 40 to 55, with some leading firms reaching scores as high as 70.
| Quartile | NPS Score |
|---|---|
| Lower quartile | 22 |
| Median | 50 |
| Upper quartile | 70 |
| Benchmark Type | NPS Score |
|---|---|
| Bottom quartile | +11 |
| Median | +40 |
| Top quartile | +64 or higher |
These benchmarks reflect the industry's focus on innovation and customer-centric services. However, intense competition and challenges like inconsistent onboarding can lower scores for some companies. To stay ahead, you must prioritize seamless customer experiences and reliable service delivery.
Key Drivers of High NPS in Software and Tech
Achieving high NPS in the software and technology sector requires addressing specific customer needs. Recent studies highlight several factors that contribute to better scores:
- AI-powered customer service enhances engagement and retention.
- Smooth interactions through AI increase the likelihood of recommendations.
- Reliable products and responsive support improve customer satisfaction.
| Customer Service Factor | Impact on NPS Scores |
|---|---|
| Positive User Experiences | Increases scores |
| Reliable Products | Increases scores |
| Responsive Customer Support | Increases scores |
By leveraging AI and automation, you can deliver faster resolutions and personalized experiences. These technologies not only improve NPS but also strengthen customer loyalty.
How Sobot’s Voice/Call Center Enhances NPS in Tech
Sobot’s Voice/Call Center solutions play a pivotal role in helping technology companies improve NPS. The platform offers advanced features like AI-powered voicebots, intelligent IVR, and real-time analytics. These tools streamline communication and ensure efficient problem resolution.
| Metric | Value |
|---|---|
| Reduction in inbound volume | 20% |
| Positive feedback percentage | 96%+ |
| Correct answers rate | 80% |
| Customer satisfaction score | 97% |
| Problem resolution rate | 85% |
| Customer happiness percentage | 99% |
| Self-service question handling | 22.2% |

For example, Sobot’s AI-powered voicebots handle repetitive queries, reducing inbound call volumes by 20%. This allows your agents to focus on complex issues, increasing problem resolution rates to 85%. Additionally, the platform’s unified workspace ensures agents have access to complete customer histories, enabling faster and more accurate responses.
By integrating Sobot’s solutions, you can deliver personalized experiences that boost customer satisfaction and loyalty. These improvements directly contribute to higher NPS scores, helping your business thrive in the competitive technology landscape.
NPS Benchmarks in Retail and E-commerce
Typical NPS Range for Retail and E-commerce
Retail and e-commerce businesses often see varied NPS scores due to differences in customer expectations and operational models. Recent studies show that NPS benchmarks for retail range from 30 to 70, while e-commerce scores typically fall between 20 and 65. Leading e-commerce platforms often achieve scores between 35 and 55, reflecting their focus on convenience and personalization.
| Sector | NPS Range |
|---|---|
| Retail | 30 to 70 |
| E-commerce | 20 to 65 |
For a more detailed look, here are NPS benchmarks for specific companies in the retail sector:
| Company Name | NPS Score Benchmark |
|---|---|
| Bath & Body | 39 |
| Coach | 39 |
| Victoria's Secret | 39 |
| Costco | 35 |
| Sephora | 35 |
| Tiffany & Co | 30 |
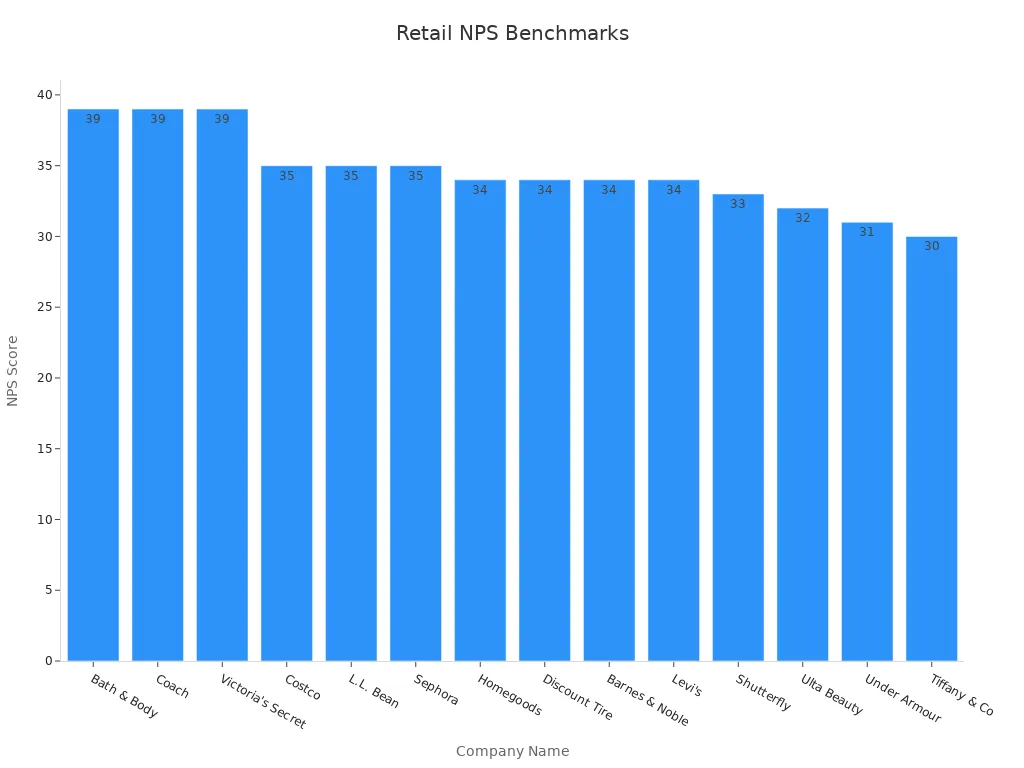
These benchmarks highlight the importance of meeting customer expectations to maintain competitive scores.
The Role of Customer Service in NPS
Customer service plays a critical role in shaping NPS. High-quality service fosters loyalty and improves customer satisfaction, directly impacting your score. For example:
- Taylor & Hart, a London-based jeweler, doubled its revenue by focusing on customer experience and tracking NPS at every stage.
- Bain & Company found that businesses excelling in customer service achieve twice the revenue growth of their peers.
- A Harvard Business Review study revealed that improving customer satisfaction helps retain 74% of customers for an additional year.
These examples demonstrate how exceptional service can turn one-time buyers into loyal customers, boosting your NPS and long-term profitability.
Sobot’s AI Solutions for Improving NPS in Retail
Sobot’s AI solutions empower retail and e-commerce businesses to enhance customer loyalty and satisfaction. The platform offers omnichannel support, enabling seamless communication across chat, email, voice, and social media. Its AI agents handle repetitive inquiries, freeing your team to focus on complex issues.
Key benefits include:
- Personalized interactions through AI-driven insights.
- 24/7 support to address customer needs instantly.
- Automated outbound marketing to reduce cart abandonment and increase sales.
For example, Sobot’s AI copilots assist agents by generating accurate responses, improving resolution times. These features help you deliver exceptional customer experiences, ultimately driving higher NPS and fostering loyalty in a competitive market.
NPS Benchmarks in Financial Services and Insurance
Typical NPS Range for Financial Services
The financial services and insurance sectors exhibit diverse NPS benchmarks due to varying customer expectations and service models. On average, financial services achieve an NPS of 44, while traditional banking scores around 30. Fintech companies, known for their innovative and user-friendly solutions, lead the sector with a benchmark NPS of 80. Insurance companies, focusing on trust and transparency, maintain a benchmark score of 36.
| Sector | Average NPS Score | Benchmark NPS Score |
|---|---|---|
| Financial Services | 44 | N/A |
| Banking | 30 | 34 |
| Fintechs | N/A | 80 |
| Insurance | N/A | 36 |
These benchmarks highlight the importance of understanding customer satisfaction and loyalty in a competitive market. By aligning your strategies with these benchmarks, you can set realistic goals and improve customer retention.
Factors Impacting NPS in Banking and Insurance
Several factors influence NPS in banking and insurance. Customers value transparency, ease of access, and responsive support. For instance, a study revealed that NPS scores strongly correlate with contribution margins, with a significant effect size of 21.45 when control variables are included.
| Model | Relationship | Significance Level | Effect Size (CHF) |
|---|---|---|---|
| I | NPS score and contribution margin | 1% | 16 |
| II | NPS score with control variables | 1% | 21.45 |
In banking, digital services and mobile app usability play a critical role. For insurance, timely claim processing and clear communication are key drivers of satisfaction. Addressing these factors can help you enhance customer loyalty and retention.
Leveraging Sobot’s Contact Center for Customer Retention
Sobot’s contact center solutions empower financial services and insurance companies to improve customer retention and satisfaction. The platform offers features like AI-powered voicebots, intelligent IVR, and real-time analytics. These tools streamline communication and ensure efficient issue resolution.
| Metric | Improvement |
|---|---|
| Customer Satisfaction Scores | Over 30% |
| Net Promoter Score (NPS) | Over 35% |
| Conversion Rates | Over 15% |
For example, Sobot’s unified workspace provides agents with complete customer histories, enabling faster and more accurate responses. AI-powered voicebots handle repetitive queries, allowing your team to focus on complex issues. These features not only enhance customer satisfaction but also drive higher NPS and retention rates. By integrating Sobot’s solutions, you can deliver personalized experiences that foster loyalty and long-term growth.
NPS Benchmarks in Automotive Industry

Typical NPS Range for Auto Dealers and Manufacturers
The automotive industry exhibits a wide range of NPS scores, reflecting the diverse experiences customers have with auto dealers and manufacturers. Recent market research highlights the following typical ranges:
| NPS Category | Score |
|---|---|
| Low Score | 33 |
| Average Score | 48 |
| High Score | 63 |
These scores indicate that while some companies excel in customer satisfaction, others struggle to meet expectations. For instance, Honda leads with an impressive NPS of 82, while Toyota and Hyundai score 43 and 69, respectively. Rolls Royce, surprisingly, has a negative score of -47, showcasing the variability within the sector.
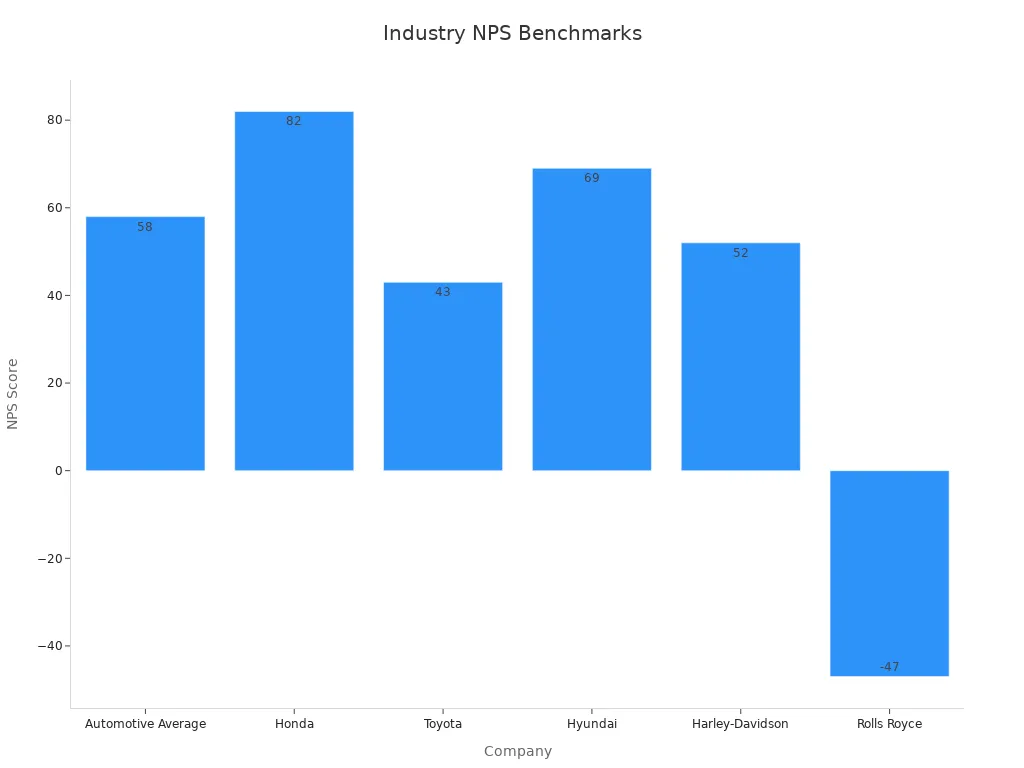
Understanding these benchmarks helps you evaluate your performance and identify areas for improvement. Aiming for a high NPS can position your brand as a leader in customer satisfaction.
The Impact of After-Sales Service on NPS
After-sales service plays a critical role in shaping NPS in the automotive sector. Customers value timely support, transparent communication, and efficient problem resolution. Companies like Tesla demonstrate how exceptional after-sales service can elevate NPS. Tesla achieved a remarkable score of 97, far surpassing the industry average of 58. This success stems from their focus on customer satisfaction and loyalty.
Mazda Motors Europe also highlights the importance of after-sales service. By analyzing NPS and CSAT data from 1,800 dealerships, Mazda improved customer experiences and strengthened its brand reputation. These examples show that investing in after-sales service not only boosts NPS but also fosters long-term customer loyalty.
Trends in Customer Loyalty in Automotive Sector
Customer loyalty in the automotive industry has seen significant growth in recent years. The average NPS score has risen from 33 to 49, reflecting improved customer satisfaction. Retention rates now average 83%, with a return on retention reaching 93%.
| Metric | Value |
|---|---|
| Average NPS Score at Start | 33 |
| Current Average NPS Score | 49 |
| Average Retention Rate | 83% |
| Average Return on Retention | 93% |
These trends highlight the growing importance of customer-centric strategies. By leveraging tools like Sobot’s AI-powered contact center solutions, you can enhance customer interactions and build loyalty. Features such as intelligent IVR and real-time analytics streamline communication, ensuring a seamless experience. This focus on personalization and efficiency can help you achieve higher NPS and retain more customers.
NPS Benchmarks in Healthcare Industry
Typical NPS Range for Healthcare Providers
Healthcare providers often achieve varied NPS scores depending on the quality of care and patient satisfaction. The typical range for the industry spans from +38 to +58, with scores above +58 considered excellent. Providers that exceed +80 are regarded as world-class, with MedAvail achieving an impressive +90.
| NPS Score Range | Description |
|---|---|
| +38 to +58 | Average healthcare benchmark |
| > +58 | Considered excellent |
| > +80 | Regarded as world-class |
| +90 | Example from MedAvail |
These benchmarks highlight the importance of delivering exceptional care and fostering trust to achieve higher scores. By understanding these ranges, you can set realistic goals for improving patient satisfaction and loyalty.
The Role of Patient Experience in NPS
Patient experience plays a critical role in shaping NPS scores. Surveys reveal that factors like safety, comfort, and quality of care significantly influence a patient’s likelihood to recommend a provider.
- Safety and comfort during treatment enhance trust.
- High-quality care improves perceptions and satisfaction.
- Clear communication fosters stronger connections with patients.
- Measures like HCAHPS scores show a positive correlation between patient experience and clinical quality.
- Higher satisfaction leads to better adherence to treatment plans.
- Organizations prioritizing patient experience often deliver superior care.
When you focus on improving patient experience, you not only boost satisfaction but also strengthen loyalty. This approach ensures patients feel valued and cared for, which directly impacts their willingness to recommend your services.
Challenges and Opportunities for Improving NPS in Healthcare
Healthcare providers face unique challenges in improving NPS. A growing nurse practitioner (NP) workforce helps meet primary care demands, but limited resources and support can hinder their effectiveness. These challenges can negatively impact patient outcomes and satisfaction.
However, opportunities abound. NPs excel in delivering personalized care and clear communication, which enhances patient satisfaction. They also expand access to high-quality care in underserved areas, addressing critical gaps in the system. By creating favorable practice environments for NPs, you can improve care quality for patients with chronic conditions and reduce costs.
Leveraging tools like Sobot’s AI-powered contact center solutions can further enhance patient interactions. Features such as intelligent IVR and real-time analytics streamline communication, ensuring timely responses to patient inquiries. These technologies help you deliver a seamless customer experience, ultimately driving higher NPS and fostering loyalty in the healthcare sector.
Understanding NPS benchmarks by industry is essential for evaluating your business's performance and identifying areas for growth. Each sector has unique drivers of satisfaction and loyalty, as shown in the table below:
| Industry | Average NPS | Key Insights |
|---|---|---|
| Technology | 50-60 | Customers value innovation, seamless experiences, and personalized solutions. |
| Healthcare | 30-40 | Trust and reliability play a major role in customer satisfaction. |
| Retail | 20-30 | Customer preferences are diverse, making it harder to achieve high NPS. |
| Financial Services | 30-40 | Transparency, trust, and digital convenience are key drivers of loyalty. |
| Hospitality | 40-50 | Personalized guest experiences and exceptional service drive high scores. |
| Telecommunications | 20-30 | Service reliability and customer support are critical factors for improvement. |
These insights reveal that industries like Hospitality and Technology excel in customer satisfaction, while sectors such as Telecommunications face challenges. By leveraging Sobot’s advanced contact center solutions, you can address these challenges effectively. Features like AI-powered voicebots, real-time analytics, and omnichannel support enable you to deliver personalized experiences that enhance satisfaction and foster loyalty. In 2025, tools like these are indispensable for staying competitive and building lasting customer relationships.
FAQ
What is a good Net Promoter Score (NPS) for my business?
A good NPS depends on your industry. For example, retail businesses often aim for scores between 40 and 70, while technology companies target 50 to 60. Use industry benchmarks to set realistic goals. Tools like Sobot’s AI solutions can help you achieve higher customer satisfaction and loyalty.
How often should I measure my NPS?
You should measure NPS quarterly or after key customer interactions. Regular tracking helps you identify trends and address issues promptly. For example, Sobot’s real-time analytics in its contact center solutions allow you to monitor customer feedback and improve satisfaction continuously.
Can NPS predict customer loyalty?
Yes, NPS is a strong predictor of customer loyalty. Promoters are more likely to recommend your business, while detractors may leave negative reviews. Sobot’s AI-powered tools help you engage with detractors effectively, turning them into loyal customers and boosting your overall NPS.
How can Sobot improve my NPS?
Sobot enhances your NPS by streamlining communication with features like AI-powered voicebots, intelligent IVR, and real-time analytics. These tools improve customer satisfaction by resolving issues faster and personalizing interactions. For example, Samsung achieved a 97% satisfaction rate using Sobot’s solutions.
Why do NPS benchmarks vary across industries?
NPS benchmarks vary due to differences in customer expectations. For instance, healthcare focuses on trust and care quality, while retail emphasizes convenience and personalization. Sobot’s omnichannel solutions adapt to these unique needs, helping businesses across industries improve their customer satisfaction and loyalty.
See Also
Best Call Center Analytics Tools to Use in 2024
Leading Voice of Customer Solutions Available in 2024
Enhancing Live Chat Effectiveness for Retail Businesses
