Which Ecommerce KPIs Matter Most for Growth?
You need to track key performance indicators to drive ecommerce growth. The most important ecommerce KPIs help you understand sales, customer behavior, and marketing effectiveness.
- Common metrics include customer acquisition cost, conversion rate, and average order value.
- Actionable KPIs reveal how your business performs and guide decisions for scaling.
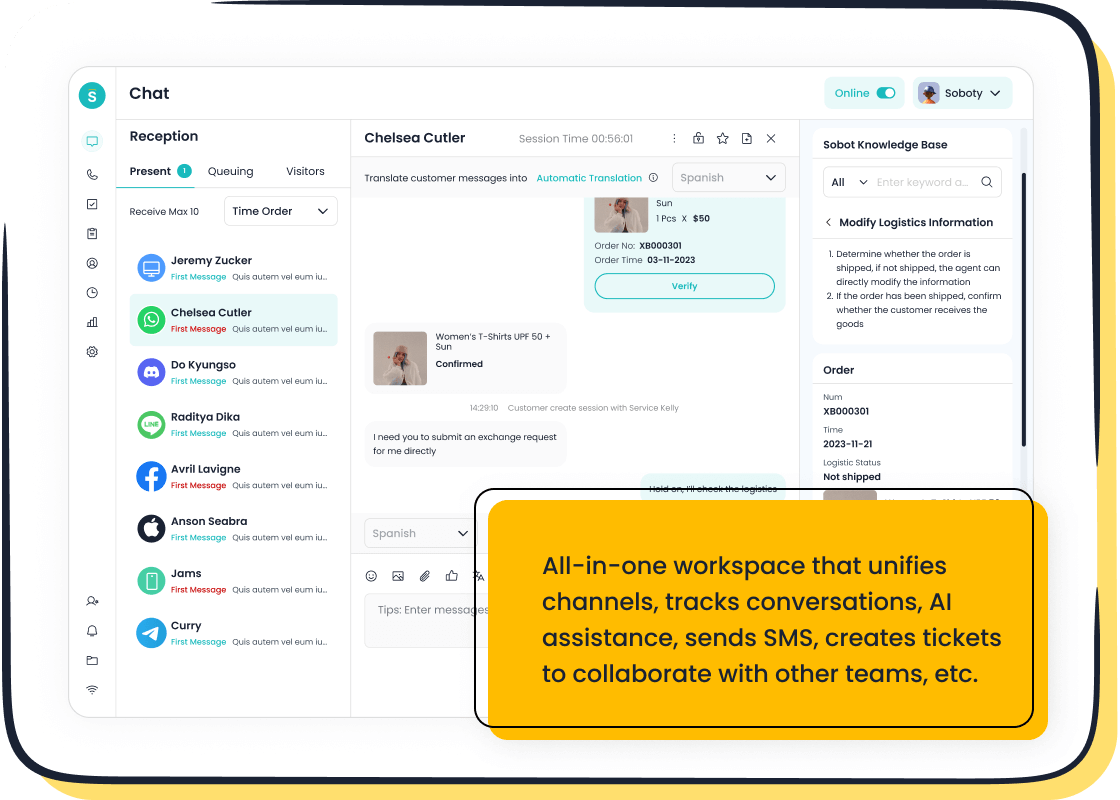
Customer experience, operational efficiency, and omnichannel solutions play a big role in choosing the right metrics. Sobot provides live chat and omnichannel tools that make it easier to monitor these ecommerce KPIs and improve your results.
Sales KPIs for Ecommerce Growth

Tracking the right sales KPIs helps you understand how well your ecommerce business performs. These ecommerce metrics show you where your store stands and what you can do to improve. Let’s look at the most important sales KPIs for ecommerce growth.
Conversion Rate
Conversion rate measures how many visitors become customers. This metric tells you if your website and marketing efforts turn interest into actual sales. A high sales conversion rate means your site convinces people to buy. If your conversion rate is low, you may need to improve your product pages, checkout process, or customer support.
Here is a table showing average ecommerce conversion rates by industry and country for Q4 2023:
| Industry | Conversion Rate Range | Average Conversion Rate (Q4 2023) |
|---|---|---|
| Fashion and Apparel | 1.01% - 2.20% | 1.9% |
| Health and Wellness | 1.87% - 4.20% | 1.8% |
| Pet Care | 2.20% - 2.53% | N/A |
| Food and Beverage | N/A | 3.7% |
| Average E-commerce | 0.78% - 4% | 2.58% |
| US | N/A | 2.3% |
| Germany | N/A | 2.22% |
| Italy | N/A | 0.99% |
| Denmark | N/A | 1.8% |
| Netherlands | N/A | 1.78% |
| United Kingdom | N/A | 4.1% |
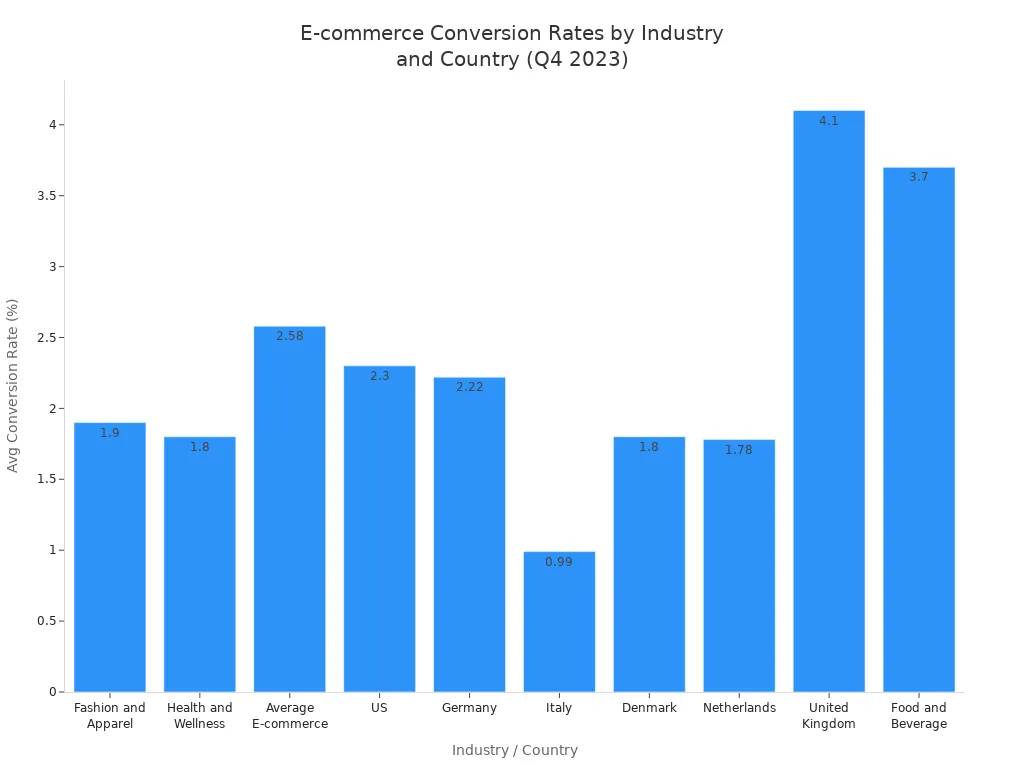
You can see that conversion rates vary by industry and country. For example, the United Kingdom has a higher average conversion rate than Italy. If your store’s conversion rate is below the average for your industry, you may need to review your site’s user experience or your marketing approach.
Sobot Live Chat can help you boost your conversion rate. By offering instant support and personalized recommendations, you can answer questions and remove doubts before customers leave your site. For example, J&T Express increased its sign-off rate by 35% and its cash-on-delivery collection rate by 40% after using Sobot Live Chat. In general, Sobot Live Chat users have seen a 15% improvement in conversion rates and a threefold increase in conversions by resolving 70% of customer inquiries quickly.
Tip: Use live chat to engage visitors in real time. Quick answers can turn browsers into buyers and raise your sales conversion rate.
Average Order Value
Average order value (AOV) shows how much customers spend each time they buy from your store. This metric helps you understand your customers’ buying habits and how you can encourage them to spend more. A higher average order value means you earn more revenue from each sale.
You can use several strategies to increase your average order value:
| Strategy | Description |
|---|---|
| Optimize product detail page (PDP) | Make product pages clear and helpful to guide buying decisions. |
| Offer cross-sells and upsells | Suggest related or higher-value products during checkout. |
| Offer limited-time promotions | Use discounts or free shipping to encourage larger purchases. |
| Bundle complementary products | Create package deals to raise the total order value. |
| Create a customer loyalty program | Reward repeat customers to encourage bigger purchases. |
For example, Avera increased its average order value by 12% by bundling products. Loyalty programs also work well, with 43% of loyal customers spending more than others.
Sobot Live Chat can support these strategies. You can use chat to recommend bundles or upsells based on customer behavior. Personalized suggestions during the shopping process can lead to higher order values and more revenue.
Revenue Metrics
Revenue metrics show how much money your ecommerce business brings in. Gross revenue is the total sales income before any deductions. Net revenue subtracts returns, discounts, and refunds, giving you a clearer picture of your actual earnings.
A healthy ecommerce business sees both gross and net revenue grow over time. If you notice a large gap between these two numbers, you may have issues with returns or discounts that need attention. Tracking these metrics helps you spot trends and make better decisions for your store.
Sobot’s analytics tools help you monitor revenue metrics in real time. You can see which products drive the most sales and where you might lose revenue due to returns or discounts. This insight lets you adjust your strategy and keep your business on track for growth.
Click-Through Rate
Click-through rate (CTR) measures how often people click on your ads, emails, or product listings. This metric shows how well your marketing attracts attention and drives traffic to your site. In ecommerce, a high CTR often means strong purchase intent and better sales performance.
- The industry benchmark for CTR in ecommerce is about 4.1% for product listing ads.
- A higher CTR usually leads to more visitors and more sales.
You can improve your CTR by writing clear ad copy, using eye-catching images, and targeting the right audience. Sobot Live Chat can also help by engaging visitors who arrive from ads, answering their questions, and guiding them to complete a purchase.
Note: Monitoring your CTR helps you understand which marketing channels work best. Focus on the channels that bring in the most engaged visitors.
Sales KPIs like conversion rate, average order value, revenue, and click-through rate give you a clear view of your ecommerce performance. By tracking these ecommerce KPIs and using tools like Sobot Live Chat, you can boost customer engagement, increase sales, and drive growth for your business.
Customer KPIs and Retention Metrics
Customer-centric ecommerce metrics help you build a business that lasts. When you focus on the right KPIs, you can increase customer retention, boost satisfaction, and drive loyalty. These metrics show you how well you keep customers coming back and how much value they bring over time. Let’s explore the most important customer KPIs for ecommerce growth.
Customer Lifetime Value
Customer lifetime value measures how much revenue a single customer brings to your business during their relationship with you. This metric helps you understand the long-term impact of your retention strategies. A rising customer lifetime value means your efforts to keep customers are working. You should see existing customers as valuable assets and invest in nurturing these relationships for sustainable growth.
Here is a table that shows why customer lifetime value and repeat purchase rate matter for ecommerce:
| Metric | Importance |
|---|---|
| Repeat Purchase Rate | Indicates customer loyalty and satisfaction, reducing reliance on new customer acquisition. |
| Customer Lifetime Value | Helps in understanding long-term customer value, optimizing marketing resources for retention. |
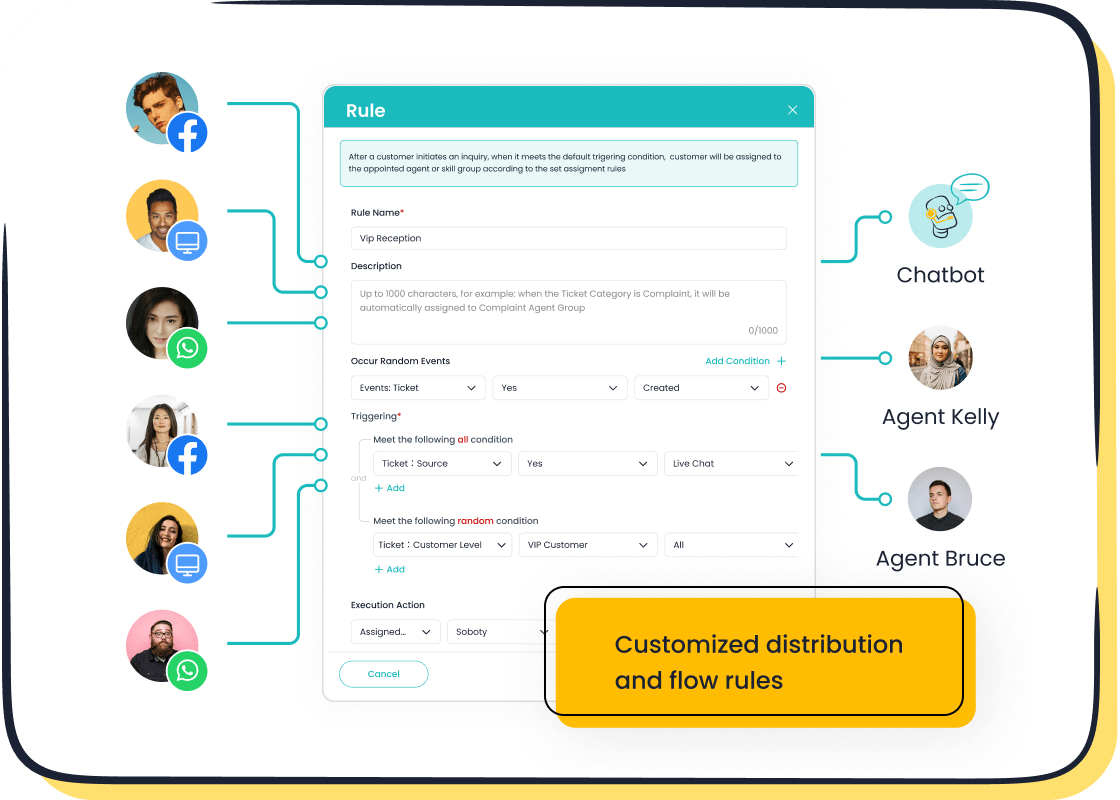
You can improve customer lifetime value by using omnichannel solutions like Sobot’s Live Chat, chatbot, and ticketing system. These tools let you connect with customers on their favorite channels, answer questions quickly, and provide personalized support. When you use Sobot’s AI-powered workspace, you can track customer interactions and offer targeted recommendations. This approach helps you keep customers happy and encourages them to buy again.
- Acquiring a new customer costs five times more than keeping an existing one.
- A 5% increase in customer retention can lead to a profit increase of 25% to 95%.
- Optimizing customer lifetime value lowers acquisition costs, raises revenue per customer, and improves retention.
You can see that focusing on customer lifetime value is one of the most important ecommerce KPIs for long-term success.
Customer Acquisition Cost
Customer acquisition cost tells you how much you spend to get a new customer. This metric includes marketing, advertising, and sales expenses. If your customer acquisition cost is too high, your profits will shrink. You need to balance this cost with the value each customer brings.
Here is a table with typical values for ecommerce businesses:
| Metric | Value Range |
|---|---|
| Average CAC in eCommerce | $50 - $130 |
| Ideal CLV to CAC Ratio | 3:1 |
Most ecommerce businesses lose an average of $29 per new customer after marketing costs and product returns. This loss has grown by 222% since 2013. You should track customer acquisition cost and compare it to customer lifetime value. A healthy business keeps the CLV to CAC ratio at least 3:1. If your ratio drops, you may need to improve your retention strategies or lower your acquisition costs.
Sobot’s omnichannel platform helps you reduce acquisition costs by improving customer engagement and support. When you use live chat and chatbots, you can answer questions faster and guide visitors to purchase. This reduces the need for expensive ads and helps you convert more leads into loyal customers.
Repeat Purchase Rate
Repeat purchase rate shows how many customers come back to buy again. This metric is a strong sign of loyalty and satisfaction. A high repeat purchase rate means your customers like your products and service.
The industry standard for repeat purchase rate is between 20% and 35%. You can increase this rate by:
- Enhancing customer experience
- Building an email list
- Monitoring customer feedback
- Sharing product updates and new arrivals
- Creating engaging content
- Asking for feedback and making improvements
Once a customer returns for a second time, their chance of buying again jumps to 45%. After the fourth return, the odds rise to 56%. You should use your dashboard to track this metric and benchmark your results.
Sobot’s omnichannel and AI-powered solutions make it easy to boost repeat purchase rates. You can use the ticketing system to follow up with customers, send personalized messages, and resolve issues quickly. The chatbot can share updates and answer questions 24/7. These tools help you build strong relationships and keep customers coming back.
Net Promoter Score
Net Promoter Score (NPS) measures how likely your customers are to recommend your business to others. This metric helps you find out who your promoters are and who your detractors are. Promoters are happy customers who spread the word about your brand. Detractors may hurt your reputation if they share negative experiences.
NPS is a key metric for customer satisfaction and retention. Fred Reichheld, the creator of NPS, found that the likelihood of customers recommending a company is a strong predictor of growth. This single question about recommendations matches customer loyalty and business growth better than other metrics.
You can use Sobot’s satisfaction surveys and analytics to track NPS. When you collect feedback, you can spot problems and make changes that improve the customer experience. Sobot’s unified workspace lets you see all customer interactions in one place, so you can respond quickly and keep satisfaction high.
Tip: Use NPS surveys after support interactions to measure how well your team meets customer needs.
Real-World Example: Samsung’s KPI-Driven Success
Samsung shows how focusing on customer KPIs leads to better results. Samsung uses A/B testing, real-time analytics, and customer feedback to improve its products and services. The company involves customers early in product development and makes changes based on their input.
- Samsung’s commitment to customer-centric innovation leads to higher satisfaction and loyalty.
- Companies with strong product experiences see a 20% higher customer retention rate.
- Samsung’s products refined through feedback have a 15% higher user satisfaction rate.
Samsung worked with Sobot to unify its communication channels and improve agent efficiency by 30%. The company reached a 97% customer satisfaction rate by using Sobot’s all-in-one contact center solution. This story shows how the right ecommerce KPIs and omnichannel solutions can drive growth and keep customers happy.
Note: When you track customer KPIs and use tools like Sobot, you can build a loyal customer base and grow your ecommerce business for the long term.
Website & Funnel Ecommerce Metrics
Tracking website and funnel ecommerce metrics helps you find opportunities and bottlenecks in the customer journey. You can use these KPIs to see where visitors drop off and what keeps them engaged. Sobot Live Chat’s analytics and omnichannel support give you real-time insights to optimize funnel performance and boost conversions.
Cart Abandonment Rate
Shopping cart abandonment rate shows how many visitors leave without completing their purchase. The average shopping cart abandonment rate for ecommerce stores is about 70.19% (Baymard Institute). Many shoppers abandon carts because of unexpected costs, complicated checkout, trust concerns, or slow site speed.
- Unexpected costs cause 49% of abandonments.
- Complicated checkout processes frustrate users.
- Trust and security worries make shoppers leave.
- Slow websites push visitors away.
You can lower your shopping cart abandonment rate by simplifying checkout, showing costs upfront, and using live chat to answer questions instantly.
Traffic Sources
Understanding traffic sources helps you see where your website traffic comes from and which channels drive sales. Different sources impact ecommerce performance in unique ways.
| Traffic Source | Impact on Sales |
|---|---|
| SEO | Drives organic traffic, leads to higher conversions |
| Paid Search | Gives immediate visibility, attracts targeted users |
| Social Media | Engages users, builds brand awareness |
| Email Marketing | Direct communication, encourages repeat purchases |
You can use Sobot Live Chat to engage visitors from all traffic channels, guiding them through the funnel and increasing conversions.
Time on Site
Time on site measures how long visitors stay on your ecommerce website. Longer time on site means your content is engaging and relevant. You can increase this metric by optimizing content, improving navigation, and adding videos or infographics.
Tip: Interactive content like quizzes and polls keeps users interested and encourages them to explore more.
Session Duration
Session duration shows how much time users spend during each visit. Longer session duration signals strong engagement and higher chances of conversion. You can boost session duration by personalizing landing pages, using internal links, and offering multimedia content.
Tracking these ecommerce metrics helps you spot friction points and make data-driven decisions. Sobot Live Chat’s analytics let you monitor funnel performance, identify bottlenecks, and improve the customer journey. You can use these ecommerce KPIs to grow your business and create a seamless experience for every visitor.
Operational KPIs for Scalability
Operational KPIs help you measure how well your ecommerce business can grow and stay profitable. These metrics show where you can improve speed, reduce costs, and keep customers happy. When you track the right ecommerce metrics, you can scale your business without losing quality or efficiency.
Fulfillment Time
Fulfillment time measures how quickly you process and deliver orders. Fast fulfillment keeps customers satisfied and encourages repeat purchases. Here is a table that shows why fulfillment speed matters:
| Metric | Description |
|---|---|
| Average Order Processing Time | Ecommerce stores usually process orders in 24-48 hours before shipping. |
| Average Delivery Time | The average delivery time improved to 3.7 days as of November 2024. |
| Impact of Fulfillment Speed | 69% of shoppers are less likely to buy again if delivery is late by two days. |
| Retention Rates | Two-day shipping increases repeat purchases by 25% and lowers cart abandonment by 18%. |
You can use Sobot’s unified workspace to track orders and automate updates. This helps your team respond faster and keeps customers informed at every step.
Return Rate
Return rate shows how many products customers send back. High return rates can hurt profits and slow growth. The average ecommerce return rate is 16.9% in 2024, but some stores see rates up to 30%. You can lower return rates by:
- Creating clear sizing charts
- Offering easy exchanges
- Giving detailed product information
- Communicating clearly about what to expect
Sobot’s automation tools help you manage returns by sending instant updates and guiding customers through the process. This reduces confusion and saves time for your team.
Inventory Turnover
Inventory turnover measures how often you sell and replace your stock. A healthy turnover rate improves cash flow, lowers storage costs, and keeps your products fresh. High inventory turnover means you avoid markdowns and spoilage. It also helps you meet customer demand and scale your ecommerce business.
Sobot’s platform connects your sales, support, and inventory data in one place. This integration lets you see which products sell best and when to restock. You can make smarter decisions and grow your business with confidence.
Tip: Use operational KPIs to spot problems early and keep your ecommerce business ready for growth.
Learn more about fulfillment and return rates from the Baymard Institute.
Prioritizing Ecommerce KPIs for Your Business
KPI Selection Framework
Choosing the right ecommerce KPIs starts with understanding your business stage and goals. You need a simple framework to guide your selection. Begin by identifying your customer experience goals. Quantify these alongside your business metrics to create a complete view. Use the following steps:
- List your main business objectives, such as increasing sales or improving customer satisfaction.
- Match each objective with relevant ecommerce metrics.
- Consider your company’s growth stage. Startups often focus on revenue growth and new customer acquisition. Established businesses may prioritize profit and shareholder value.
- Select KPIs that align with both your goals and your stage.
Sobot’s analytics and reporting tools help you track these KPIs. You receive personalized email summaries with customer feedback and churn risks. The platform triggers abandoned cart flows via email or SMS, recovering lost sales. Webhooks push qualified leads to your CRM or email platform.
Aligning KPIs with Growth Goals
You must connect your ecommerce KPIs to your growth objectives. The table below shows how different KPIs fit various focus areas:
| KPI Type | Focus Area |
|---|---|
| New Customer Acquisition | Conversion rates, customer acquisition cost, customer satisfaction |
| Growth Stage | Customer lifetime value, average order value, repeat customers |
| Assessment Frequency | Monthly for first six months, then every 3-6 months |
Review your metrics regularly. Adjust your KPIs as your business grows and your goals change.
Tracking and Optimization Steps
Tracking and optimizing ecommerce KPIs requires best practices. Use analytics tools like Sobot to make this process easier. Follow these steps:
- Focus on core KPIs that drive decisions.
- Ensure your data is reliable and statistically significant.
- Account for seasonality in your ecommerce performance.
- Create actionable reports that suggest next steps.
- Assign clear ownership for each metric to ensure accountability.
- Use tools that fit your business needs.
Sobot provides real-time feedback on product gaps and user experience pain points. You receive personalized email summaries and insights on upsell opportunities. These features help you optimize your ecommerce KPIs and drive growth.
Tip: Start with core metrics and expand as your business evolves. Use Sobot’s analytics to turn data into action.
You drive ecommerce growth by tracking key metrics like conversion rate, customer lifetime value, and net promoter score. Regular KPI review helps you spot trends and improve operational efficiency. Sobot Live Chat gives you actionable insights and boosts customer satisfaction.
- Focus on ecommerce KPIs such as revenue growth, website traffic, and customer churn rate.
- Monitor your ecommerce performance often to stay ahead.
Remember, you can’t manage what you don’t measure. Start optimizing your ecommerce KPIs today.
FAQ
What are ecommerce KPIs and why do they matter?
Ecommerce KPIs are key performance indicators that help you measure your online store’s success. You use these metrics to track sales, customer behavior, and growth. Focusing on ecommerce KPIs helps you make better decisions and improve your business.
How can Sobot help me track ecommerce KPIs?
Sobot provides analytics and reporting tools that let you monitor over 150 ecommerce KPIs in real time. You can view customer data, sales trends, and engagement metrics in one place. This helps you spot opportunities and optimize your store’s performance.
Which ecommerce KPIs should I focus on first?
Start with conversion rate, average order value, customer lifetime value, and net promoter score. These ecommerce KPIs give you a clear view of your sales, customer loyalty, and satisfaction. You can add more metrics as your business grows.
How often should I review my ecommerce KPIs?
You should check your ecommerce KPIs at least once a month. Regular reviews help you spot trends, fix problems, and adjust your strategy. Sobot’s platform can send you automated reports to keep you updated.
Can ecommerce KPIs improve customer experience?
Yes! Tracking ecommerce KPIs lets you see what customers like and where they struggle. You can use this data to improve your website, speed up support, and offer better service. Sobot’s omnichannel tools help you act on these insights quickly.
See Also
Enhancing Sales Through Ecommerce Live Chat Solutions
Best Live Chat Solutions: Shopify Compared To Rivals
Leading Ecommerce Live Chat Tools To Use In 2024
Increasing Customer Satisfaction With Chatbots In E-commerce
