Step-by-Step Guide to Analyzing Customer Experience KPIs
Customer experience KPIs are key performance indicators that show how well your business meets customer needs. These metrics help you see if your service keeps customers happy and loyal. Tracking KPIs for customer experience, like Net Promoter Score or Customer Lifetime Value, helps you spot what works and what needs fixing. When you use tools like Sobot AI, you can gather data across every channel and get a clear view of each customer’s journey. The table below shows how customer experience KPIs connect to business growth, such as revenue and retention:
| KPI Name | Description | Impact on Growth Metrics |
|---|---|---|
| Net Promoter Score (NPS) | Customer satisfaction and loyalty | Influences retention and revenue |
| Customer Retention Rate | Percentage of customers who stay | Improves long-term revenue stability |
| Customer Lifetime Value | Total value a customer brings over time | Shows impact on revenue and retention |
| Monthly Recurring Revenue | Revenue from active customers each month | Tracks revenue growth |
Sobot helps you measure and improve customer experience across all channels, making it easier to build loyalty and drive business results.
Customer Experience KPIs
What Are Customer Experience KPIs
Customer experience KPIs are special metrics that help you measure how well your business meets customer needs. These KPIs for customer experience include scores and numbers that show how happy your customers feel during their journey with your brand. You can use customer experience metrics like Customer Satisfaction Score (CSAT), Net Promoter Score (NPS), and Customer Effort Score (CES) to track satisfaction and loyalty.
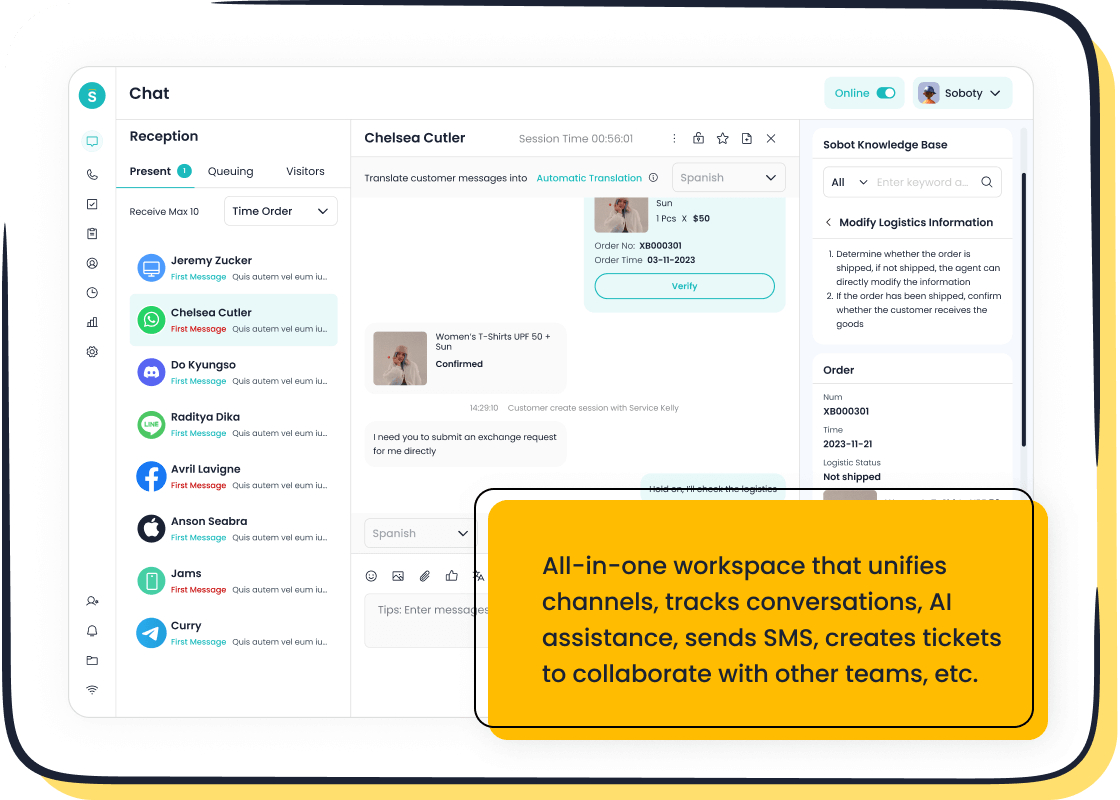
You may also look at operational metrics such as first response time and resolution time. These show how quickly your team helps customers and solves their problems. For example, CSAT tells you how satisfied customers are after a support chat, while NPS shows if they would recommend your business to others. Sobot Live Chat makes it easy to collect these metrics across all channels, so you get a full view of the customer journey.
Tip: Focus on a few key metrics that match your business goals. Too many KPIs can make it hard to see what matters most.
Why Customer Experience KPIs Matter
Tracking customer experience KPIs helps you understand what your customers think and feel. These metrics give you real data to improve customer satisfaction and loyalty. When you measure customer experience, you can spot problems early and fix them before they grow. For example, a low CSAT score may show that customers are unhappy with your support. High NPS scores mean your customers are likely to recommend your brand, which helps your business grow.
Customer experience measurement also helps you see trends over time. You can use metrics like churn rate and retention rate to find out if customers stay with your brand or leave. Sobot’s analytics tools let you track these KPIs for customer experience in real time, making it easier to take action quickly. By focusing on the right metrics, you build stronger relationships and create a better customer experience.
KPIs for Customer Experience
NPS, CSAT, CES
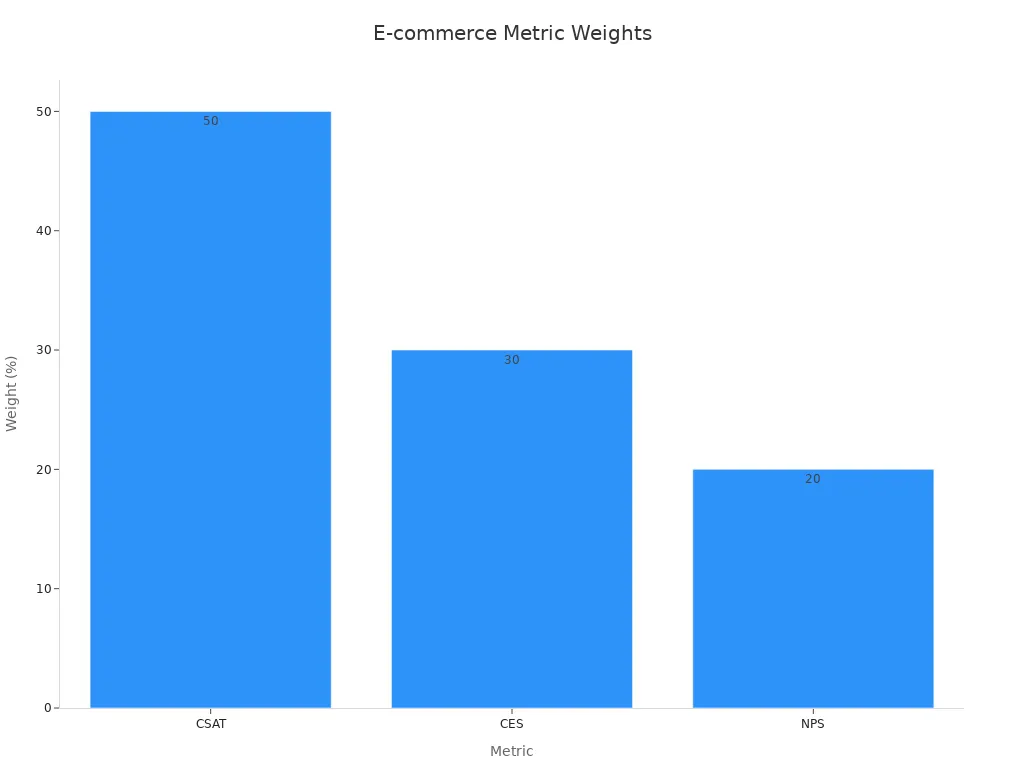
You can use three main customer experience metrics to measure how your business performs: Net Promoter Score (NPS), Customer Satisfaction Score (CSAT), and Customer Effort Score (CES). NPS shows how likely your customers are to recommend your brand. CSAT measures how happy customers feel after a specific interaction. CES tells you how easy it is for customers to get help or complete a task. In e-commerce, CSAT carries the most weight, followed by CES and then NPS. The average CSAT score for e-commerce is 80, which means most customers are satisfied. If you improve response times and solve issues on the first try, you can boost CSAT by up to 30%. Using all three metrics together helps you spot problems, fix them, and build loyalty.
| Metric | Weight in E-commerce Sector | Reason |
|---|---|---|
| CSAT | 50% | Focuses on satisfaction in online shopping |
| CES | 30% | Measures ease of use and navigation |
| NPS | 20% | Tracks likelihood to recommend |
Churn, Retention, CLV
You should track churn rate, customer retention rate, and Customer Lifetime Value (CLV) to understand long-term business health. Churn rate shows how many customers leave over time. Customer retention rate tells you how many stay. CLV measures the total value a customer brings during their relationship with your brand. In subscription e-commerce, churn averages 5-10% monthly. For non-subscription, churn can reach 30% yearly. Higher churn lowers CLV, which can drop from $500 to $200. Even a 5% increase in retention can raise revenue by up to 95%. Repeat customers make up 21% of your base but drive 44% of revenue. Sobot’s analytics help you monitor these KPIs for customer experience and take action to improve retention.
| KPI Name | What It Measures | Why It Predicts Long-Term Retention | Practical Applications and Actions |
|---|---|---|---|
| Net Promoter Score (NPS) | Customer loyalty and likelihood of referrals | High NPS indicates customers act as brand ambassadors, correlating with retention | Use feedback to recover detractors, leverage promoters for referrals, improve products/services |
| Customer Effort Score (CES) | Ease of customer interactions | Lower effort leads to higher loyalty and retention | Streamline processes, provide self-service resources, empower staff to resolve issues quickly |
| Customer Lifetime Value (CLV) | Total expected revenue from a customer over time | Directly links to long-term retention by estimating customer value | Allocate marketing budget, develop products to increase satisfaction, upsell and cross-sell to extend lifespan |
| Repeat Purchase Rate (RPR) | Percentage of customers making multiple purchases | Indicates customer loyalty and satisfaction, predicting repeat business | Use loyalty programs, personalized offers, improve post-purchase experience |
| Customer Satisfaction Score (CSAT) | Satisfaction with specific interactions or products | High satisfaction correlates with repeat business and loyalty | Identify training needs, improve service quality, follow up with dissatisfied customers |
| Churn Rate | Rate of customer loss | Directly measures attrition, critical for managing retention | Use exit surveys, develop early warning systems, personalize retention efforts |
| Average Order Value (AOV) | Average revenue per order | Provides insight into customer behavior influencing retention strategies | Adjust pricing, promote higher-value purchases, analyze buying patterns |
Response and Resolution Times
Fast response and resolution times are key customer experience KPIs. Customers expect quick answers. In live chat, the average resolution time is 5 to 10 minutes. For email, it is about 24 hours. Phone support usually resolves issues in 10 to 60 minutes. Faster response times lead to higher customer satisfaction and loyalty. Research shows that 88% of customers are more likely to buy again after good service. Sobot Live Chat helps you meet these benchmarks by unifying messages and speeding up replies. When you improve these metrics, you see better customer retention and higher satisfaction scores.
Cart Abandonment, Ticket Volume
Cart abandonment and ticket volume are important KPIs for customer experience in e-commerce. The average global cart abandonment rate is 75%. Most shoppers leave because of complicated checkouts or unexpected fees. Reducing form fields and making checkout easier can recover lost sales. High ticket volume signals product or service issues. If you see a 30% rise in product-related tickets, churn can increase by 10-15%. Sobot’s omnichannel platform helps you track ticket volume and resolve issues faster, improving customer satisfaction and retention. Monitoring these customer experience metrics lets you spot trends and act before problems grow.
Track Customer Experience
Set Objectives
To improve customer experience, you need clear goals. Start by setting specific and actionable objectives that match your business needs and your customers’ expectations. Map the entire customer journey to find where customers struggle or drop off. This helps you focus on real problems. Make sure everyone in your company understands these goals so all teams work together. Use measurable customer experience metrics like CSAT, NPS, and CES to track progress. With Sobot’s omnichannel analytics, you can see how each part of the journey affects satisfaction and retention. AI and automation tools help you measure customer experience in real time, making it easier to adjust your strategy quickly.
Tip: Set goals that everyone can support. When all teams work together, you deliver a better experience for every customer.
Select Relevant KPIs
Choose customer experience metrics that fit your business goals. There is no one-size-fits-all approach. Start by identifying what matters most—like increasing retention, boosting revenue, or improving support speed. Pick KPIs that connect directly to these goals. For example, if you want to reduce churn, track customer retention rate and NPS. Review your metrics often and adjust them as your business grows. Sobot’s Live Chat analytics let you customize reports, so you always focus on the most important KPIs. Companies like Hilton and T-Mobile align their metrics with their main objectives, showing how targeted KPIs drive real results.
Collect Data Across Channels
You need to collect customer experience data from every channel your customers use. Use omnichannel platforms like Sobot to unify data from live chat, phone, email, social media, and your website. This prevents data silos and gives you a full view of the customer journey. Analyze engagement metrics, run surveys after interactions, and listen to customer feedback on social media. Sobot’s ecommerce and retail solutions automate survey delivery and track support tickets across all channels. Agilent, for example, used Sobot to combine chatbot and phone data, which improved their service efficiency by six times and raised customer satisfaction to 95%. Always keep customer privacy in mind by using secure systems and clear consent policies.
Analyze Results and Trends
Once you have the data, look for patterns in your customer experience metrics. Use dashboards and analytics tools to spot trends in satisfaction, retention, and ticket volume. Sobot’s built-in analytics help you visualize these trends with real-time reports. Check survey results, review support logs, and use sentiment analysis to understand how customers feel. Create journey maps to see where customers get stuck or leave. By monitoring these metrics, you can quickly find areas that need improvement. For example, if you see a drop in CSAT after a new product launch, you can act fast to fix the issue.
Take Action and Monitor
Turn your analysis into action. If your metrics show high customer effort, simplify your processes. If ticket volume spikes, improve your help center or train your team. Sobot’s AI-powered tools help you automate responses and route tickets to the right agents, speeding up resolution times. After making changes, keep tracking your customer experience metrics to see if satisfaction and retention improve. Companies that act on KPI analysis see higher CSAT, lower churn, and increased revenue. Real-time monitoring lets you catch problems early and keep your customer experience strong.
Note: Loyal customers are five times more likely to buy again and recommend your brand. Small improvements in response time or satisfaction can lead to big gains in retention and revenue.
Customer Experience Analytics
Quantitative and Qualitative Data
You need both numbers and stories to understand customer experience analytics. Quantitative data gives you measurable facts, like Net Promoter Score (NPS) or Customer Satisfaction Score (CSAT). You collect this data through customer feedback surveys and polls. It shows you how many customers feel satisfied or where they face problems. Qualitative data tells you why customers feel a certain way. You get this information from interviews, open-ended survey questions, or customer comments. This type of data helps you see the emotions and reasons behind customer actions. When you combine both types, you get a full picture of the customer journey. You can spot trends, find root causes, and create actionable insights that improve customer satisfaction and engagement.
Segmentation and Personalization
Segmentation in customer experience analytics means dividing your customers into groups based on things like age, location, or buying habits. Here’s how segmentation helps you:
- You group customers by shared traits, such as behavior or preferences.
- You analyze these groups to find patterns in customer engagement and satisfaction.
- You create personalized offers, messages, or support for each group.
- You increase relevance, which boosts engagement and loyalty.
- You use tools like AI and automation to make personalization happen in real time.
Sobot Live Chat lets you segment customers and send targeted messages. This approach turns generic service into a personal experience, making each customer feel valued. Companies like Amazon and Spotify use segmentation to recommend products or music, showing how powerful this method can be.
Closing the Feedback Loop
Closing the feedback loop means acting on customer feedback and showing customers you listened. Research shows that companies who respond to feedback within 48 hours have more loyal customers and lower churn rates. You can follow these steps:
- Acknowledge every piece of feedback quickly.
- Prioritize urgent issues and act fast.
- Respond to customers and explain what you are doing.
- Communicate changes or improvements clearly.
Sobot’s customer experience analytics platform helps you track feedback, automate responses, and monitor satisfaction. When you close the loop, you build trust and improve customer engagement. This process turns feedback into actionable insights that drive better customer experience and higher satisfaction.
Tip: Use both customer feedback surveys and real-time analytics to spot issues early and keep improving your service.
Tools for Customer Experience KPIs

Sobot Live Chat Analytics

You need powerful tools to measure and improve customer experience analytics. Sobot Live Chat gives you real-time data and actionable insights across every channel. The platform uses AI to analyze customer conversations, detect emotions, and predict needs. This helps you personalize each interaction and respond faster. For example, Sobot Live Chat can reduce first response times by up to 37% and cut support ticket volume by 40%. You see a 30% boost in customer satisfaction scores when you use these analytics. The system also tracks sentiment, so you know how customers feel during each step of their journey. With Sobot, you get a complete view of the customer experience, making it easier to spot trends and take action.
| Metric / Feature | Improvement | Impact on Customer Experience |
|---|---|---|
| Response Time | 2-second AI chatbot replies | Faster help, happier customers |
| Support Ticket Volume | 40% reduction | Quicker resolutions |
| Customer Satisfaction | 30% increase | More loyal customers |
| Omnichannel Integration | Seamless service across platforms | Consistent experience everywhere |
Dashboard Features to Look For
When you choose a dashboard for customer experience analytics, look for features that make your job easier. A good dashboard should show real-time data and let you filter by channel, agent, or customer segment. You want clear visualizations like charts and graphs to spot trends quickly. Customizable reports help you focus on the most important KPIs for your business. Sobot’s dashboard lets you track metrics such as CSAT, NPS, and ticket resolution times in one place. You can also set alerts for sudden changes in customer satisfaction or ticket volume. These features help you turn raw data into useful insights that drive better decisions.
Tip: Choose dashboards that allow you to export data and share insights with your team for better collaboration.
Integration and Automation
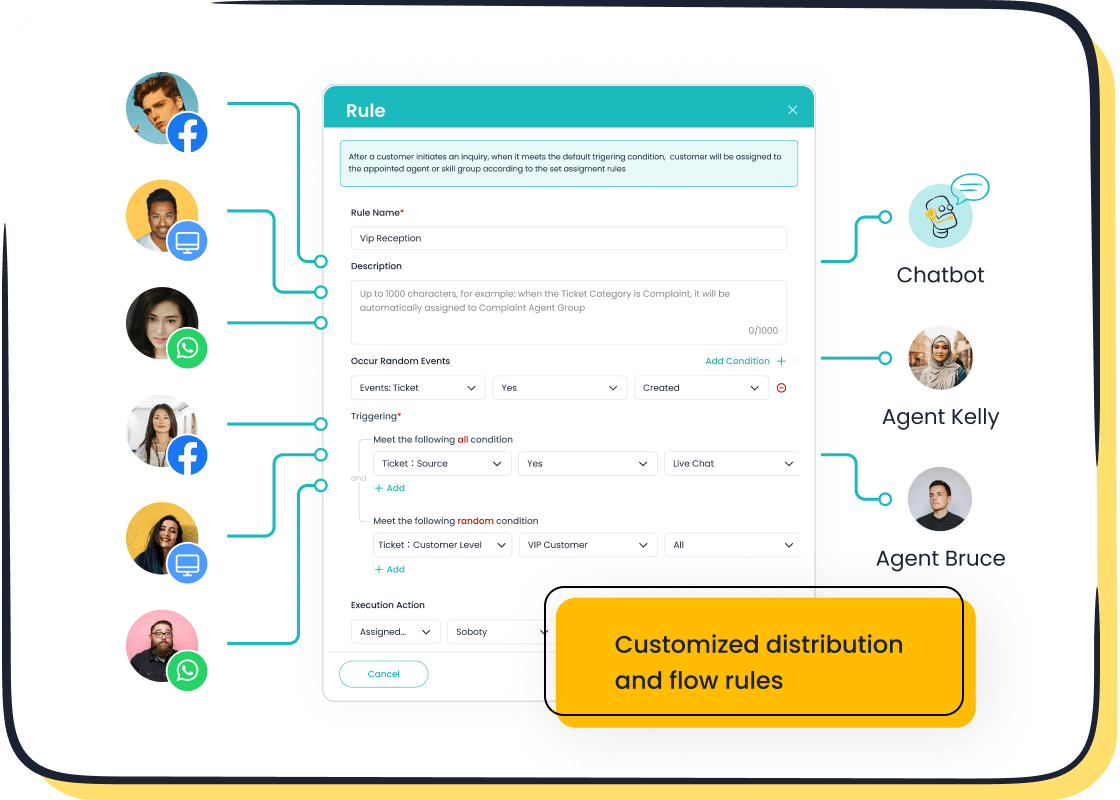
Integration and automation make customer experience analytics more effective. When you connect Sobot Live Chat with your CRM, marketing, and order systems, you get a unified view of every customer. This breaks down data silos and gives you more accurate insights into customer behavior. Automation speeds up tasks like follow-ups and ticket routing, so your team can focus on complex issues. AI tools in Sobot identify trends and suggest actions, helping you improve processes and customer loyalty. Integrated systems also let you act on insights faster, leading to better outcomes for both your business and your customers.
- Integration gives you a complete picture of the customer journey.
- Automation reduces manual work and improves response times.
- Unified data supports smarter, data-driven decisions.
You can drive customer satisfaction and engagement by tracking and analyzing customer experience KPIs at every step. Companies like Tokopedia and Maersk use ongoing measurement to boost customer loyalty and long-term growth. The USDA found that continuous KPI tracking helps organizations set clear goals and improve every department. Sobot’s Live Chat gives you real-time analytics and unified data, making it easier to act on insights. Start applying these steps now to see measurable gains in customer engagement and satisfaction.
FAQ
What are the most important customer experience KPIs for ecommerce?
You should track Net Promoter Score (NPS), Customer Satisfaction Score (CSAT), and Customer Effort Score (CES). These customer experience KPIs help you measure loyalty, satisfaction, and ease of service. Sobot Live Chat tracks these metrics in real time for better customer experience measurement.
How can I collect customer experience metrics across multiple channels?
You can use an omnichannel platform like Sobot. It gathers customer experience metrics from live chat, phone, email, and social media. This unified approach gives you a complete view of KPIs for customer experience and helps you spot trends quickly.
Why does customer experience analytics matter for business growth?
Customer experience analytics show you what customers like and dislike. For example, a 5% increase in retention can boost profits by up to 95% (Bain & Company). Sobot’s analytics tools help you turn data into actions that improve customer experience KPIs.
How often should I review my customer experience measurement data?
You should review customer experience measurement data weekly or monthly. Regular checks help you catch problems early. Sobot’s dashboard updates in real time, so you always see the latest customer experience metrics and can act fast.
Can Sobot help improve KPIs for customer experience?
Yes! Sobot offers tools like Live Chat and AI-powered analytics. These tools help you track, analyze, and improve customer experience KPIs. Many businesses see higher CSAT and NPS scores after using Sobot for customer experience measurement.
See Also
Top Strategies To Enhance Live Chat Customer Experience
Comprehensive Overview Of Quality Assurance Tools For Call Centers
Ways Chatbots Improve Customer Happiness In E-commerce
