The Most Important Ecommerce KPIs to Improve Customer Engagement

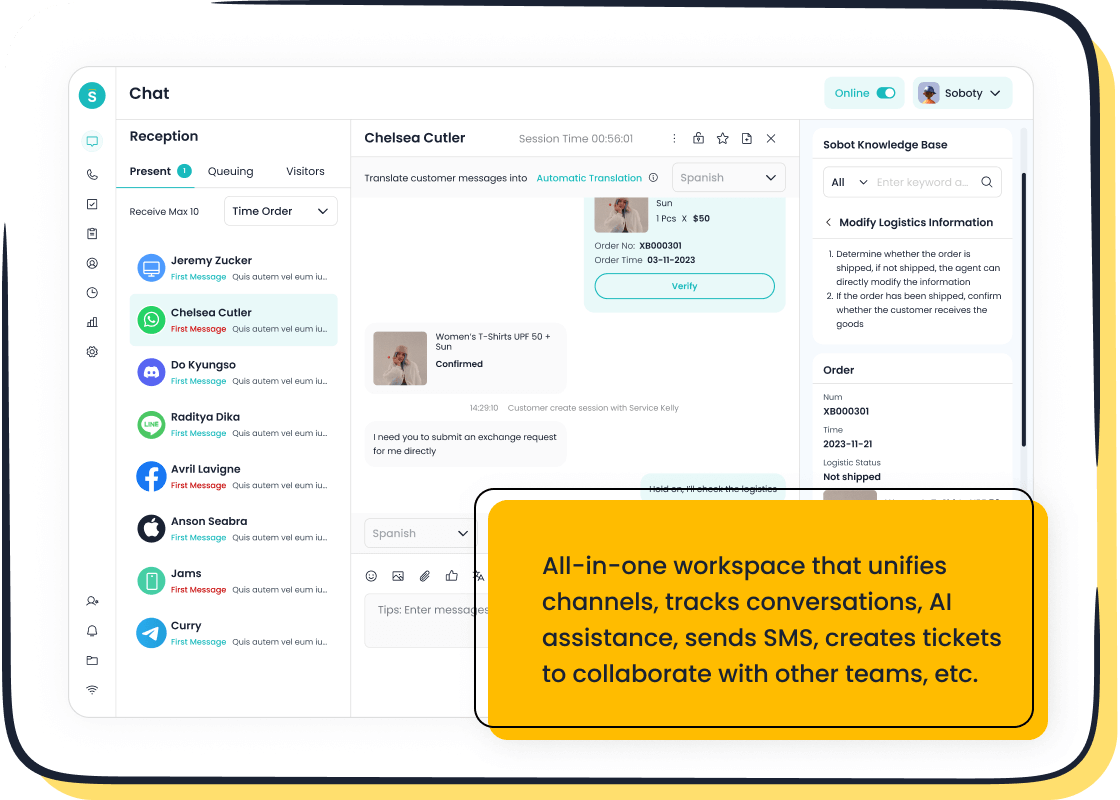
You need to track the most important ecommerce KPIs to build strong customer engagement and boost revenue. When you measure customer experience KPIs, you see how your actions affect satisfaction and loyalty. Sobot helps you connect with customers and improve key metrics. Recent studies show that KPIs such as conversion rate and retention rate have a direct impact on sales and long-term growth.
| Key Performance Indicators (KPIs) | Impact on Revenue Growth |
|---|---|
| Conversion Rate | Directly influences sales volume |
| Retention Rate | Influences long-term stability |
Think about your current KPI tracking. Are you making the most of your data to improve customer experience?
Most Important Ecommerce KPIs for Customer Experience
Customer Satisfaction Score (CSAT)
You need to measure CSAT to understand how happy your customers feel after each interaction. CSAT is one of the most important ecommerce kpis because it shows if your service meets expectations. You can collect CSAT scores by sending surveys right after a purchase or support chat. Keep your questions consistent and ask for context to learn why customers rate you a certain way. Industry benchmarks show that general eCommerce CSAT scores range from 75% to 85%. Amazon, for example, scores 83 out of 100.
Tip: Track CSAT by touchpoint to find areas needing improvement.
| Sector | CSAT Score Range |
|---|---|
| General eCommerce | 75% - 85% |
| Electronic Retail | 80/100 |
| Amazon | 83/100 |
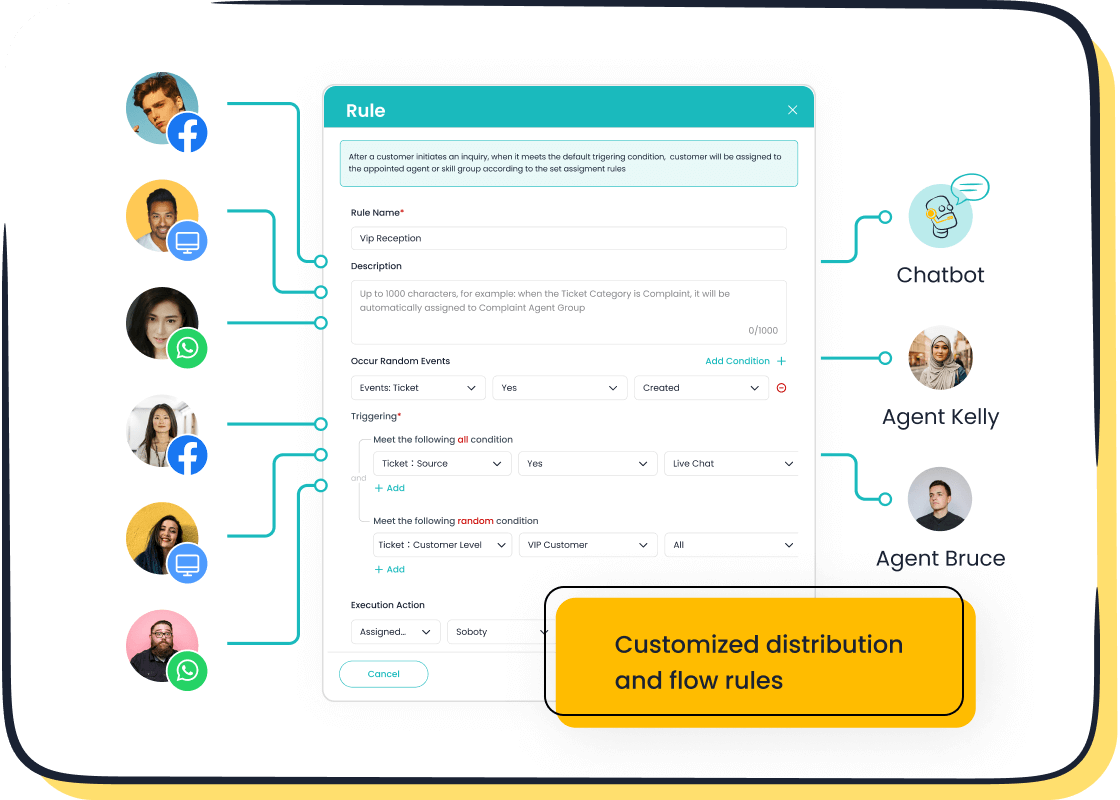
Sobot’s live chat, chatbot, and ticketing system help you collect feedback across channels. You can use satisfaction surveys and AI-powered tools to boost agent efficiency and improve CSAT.
Net Promoter Score (NPS)
NPS is another of the most important ecommerce kpis. It measures how likely customers are to recommend your business. The average NPS for e-commerce kpis is about 62, which is higher than many other industries. You can improve NPS by offering fast support, personalizing experiences, and acting on feedback.
- Enhance customer service with 24/7 support.
- Streamline checkout and provide multiple payment options.
- Personalize recommendations using customer data.
Sobot’s omnichannel contact center lets you gather NPS data from websites, apps, and social media. You can analyze feedback and respond quickly to customer needs.
Improving CSAT and NPS with Omnichannel Tools
Omnichannel tools are essential for the most important ecommerce kpis. They let you collect feedback from every channel and resolve issues fast. Sobot’s live chat, AI agent, voicebot, and call center unify customer interactions. You can track CSAT and NPS scores in real time and act on insights.
OPPO improved its CSAT and NPS by using Sobot’s chatbot and ticketing system. OPPO saw a 94% positive feedback rate and a 57% increase in repurchase rate (source).
You can use Sobot’s solutions to boost satisfaction and loyalty. Omnichannel support helps you deliver consistent service and improve the most important ecommerce kpis.
E-commerce KPIs for Customer Retention and Loyalty
Repeat Purchase Rate
Repeat purchase rate shows how often your customers return to buy again. You can measure this KPI by dividing the number of customers who make multiple purchases by your total customer count. Most online stores see repeat purchase rates between 15% and 30%. Successful ecommerce businesses often reach 28%. Product type, customer experience, loyalty programs, and delivery speed all influence this metric. Consumable products usually have higher repeat rates than durable goods.
Sobot’s chatbot and live chat help you engage customers after their first purchase. You can send personalized messages, offer exclusive deals, and answer questions quickly. These strategies encourage customers to return and buy again. Sobot’s built-in analytics let you track repeat purchase rate and spot trends.
| Metric | Description |
|---|---|
| Repeat Purchase Rate | Percentage of customers making additional purchases in a specific period |
| Retention Rate | Percentage of customers retained over time |
Tip: A repeat purchase rate above 20% is a good sign for your store.
Customer Lifetime Value (CLV)
Customer lifetime value measures the total revenue you earn from a customer throughout their relationship with your business. You can calculate CLV using average sales, repeat transactions, and retention period. Higher CLV means your strategies are working to keep customers loyal and spending more.
Sobot’s AI Agent and voicebot deliver personalized recommendations based on customer profiles. You can use upselling and cross-selling strategies to increase customer lifetime value. Loyalty programs and targeted campaigns also boost CLV by rewarding repeat buyers.
| KPI | Description |
|---|---|
| Customer Lifetime Value | Forecasts total revenue generated by a customer over their relationship |
Strategies for Retention and Loyalty
You need effective strategies to keep customers coming back. Automation and personalized engagement play a big role. Sobot’s customer contact center unifies all channels, making it easy to deliver timely, relevant messages. You can automate win-back campaigns, send reminders, and reward loyal customers.
- Implement tiered loyalty programs to motivate repeat purchases.
- Use remarketing strategies to re-engage previous buyers.
- Create win-back campaigns for inactive customers.
- Upsell and cross-sell with personalized offers.
Sobot’s ticketing system and call center help resolve issues fast, improving satisfaction. Built-in analytics let you track retention KPIs and optimize your strategies. Most shoppers become repeat buyers after personalized interactions. Automation ensures you reach customers at the right time, boosting loyalty and customer lifetime value.
Note: 60% of shoppers expect to become repeat buyers after a personalized shopping experience.
Revenue Growth KPIs in E-commerce
Conversion Rate
Conversion rate measures how many visitors become buyers in your e-commerce store. This KPI shows how well you turn traffic into revenue. Industry benchmarks vary by sector. For example, food and beverage e-commerce sites reach 3.7%, while fashion and apparel range from 1.01% to 2.20%.
| Industry | Average Conversion Rate (%) |
|---|---|
| Fashion and Apparel | 1.01% - 2.20% |
| Health and Wellness | 1.87% - 4.20% |
| Pet Care | 2.20% - 2.53% |
| Food and Beverage | 3.7% |
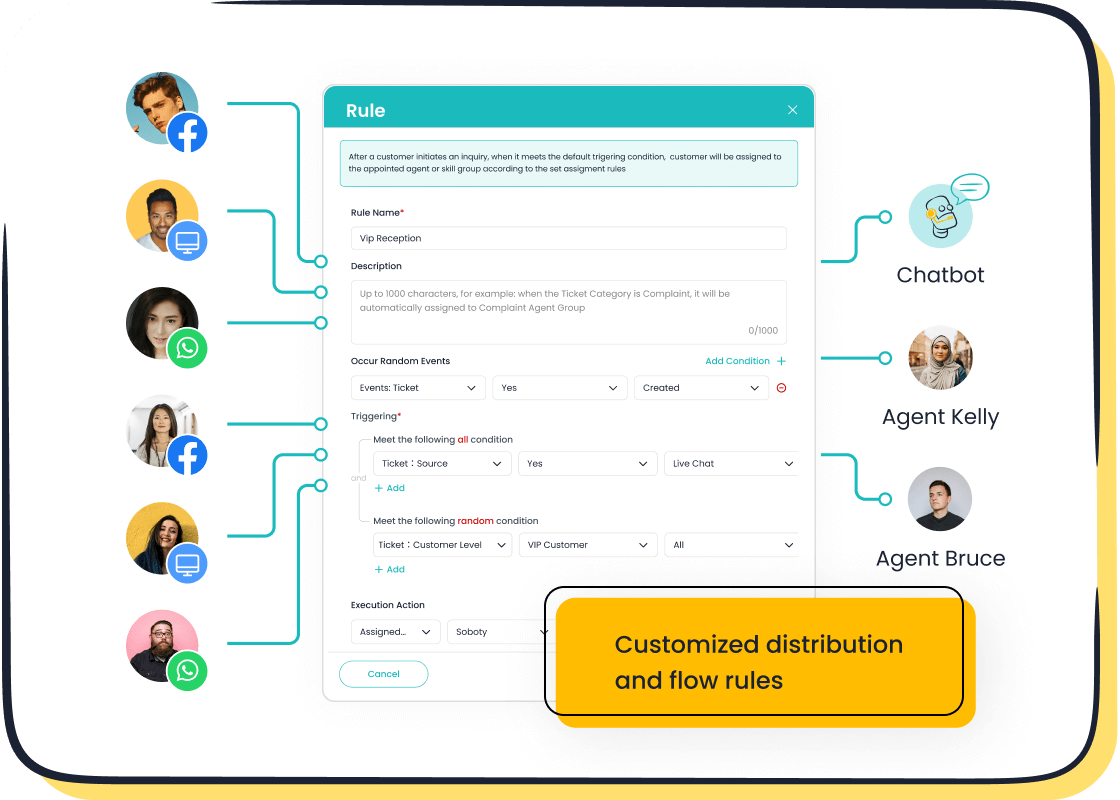
You can improve conversion by creating buyer personas, optimizing user experience, and enhancing product pages. Sobot Live Chat boosts conversion by offering instant support and personalized recommendations. Data shows that Sobot Live Chat can lift conversion rates up to four times higher, reaching 12.3% compared to the industry average of 3.1%.
Average Order Value (AOV)
Average order value tracks how much customers spend per transaction. Higher AOV means more revenue from each sale. Global e-commerce AOV averages $110, while the US average is $153. Fashion e-commerce sees an AOV of $97.
| Sector/Category | Average Order Value (AOV) |
|---|---|
| Global Average | $110 |
| US Average | $153 |
| Fashion eCommerce | $97 |
| Varies by Category | $61 to $247 |
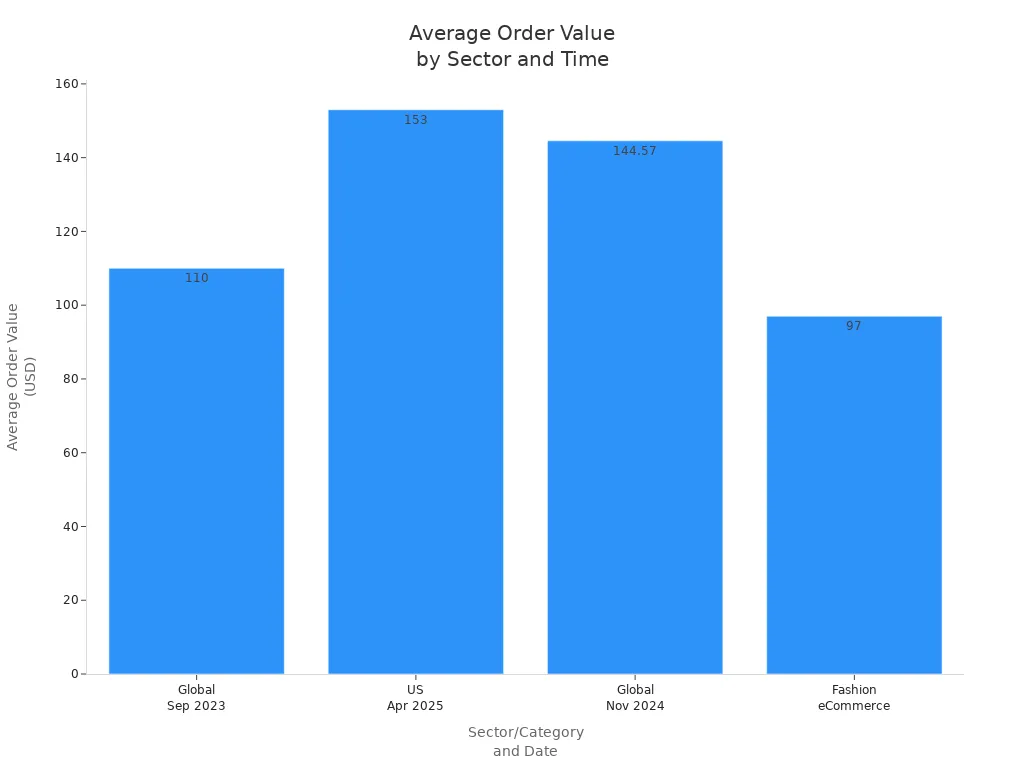
Factors like product pricing, industry type, and seasonal trends affect AOV. Sobot’s AI Agent and chatbot suggest bundles and upsell offers, helping you increase AOV and drive revenue growth.
Cart Abandonment Rate
Cart abandonment rate shows how many shoppers leave without completing their purchase. E-commerce stores face rates between 70.1% and 76.99%. High extra costs, confusing checkout, and payment concerns cause most abandonments.
- 55% leave due to unexpected fees.
- 21% leave because checkout is too complicated.
- 17% leave because they do not trust the site.
You can reduce cart abandonment by optimizing checkout, offering trust signals, and using remarketing strategies. Sobot’s live chat and AI tools recover 15–25% of lost revenue by engaging customers and providing real-time support.
Boosting Revenue with Sobot Live Chat
Sobot Live Chat helps you increase revenue growth by improving conversion, raising AOV, and reducing cart abandonment. You can use proactive messages, personalized recommendations, and 24/7 support to guide shoppers from browsing to buying. Sobot’s built-in analytics let you track revenue KPIs and optimize your strategies. Real-time personalization can increase revenue by up to 15%. Sobot’s solutions unify customer contact, making your e-commerce business more efficient and profitable.
Tip: Engage customers with Sobot Live Chat when they linger on high-intent pages to boost conversion and revenue.
Engagement Metrics and E-commerce Marketing KPIs
Email Open and Click-Through Rates
You need to track email open and click-through rates to measure how well your marketing campaigns reach customers. These metrics show if your emails grab attention and drive action. The average open rate for e-commerce is 32.67%. The average click rate is 1.07%. You can improve these metrics by sending personalized messages, using clear subject lines, and segmenting your audience. Sobot’s chatbot and AI Agent help you automate follow-ups and send targeted emails based on customer behavior. When you use Sobot’s built-in analytics, you see which campaigns perform best and adjust your strategy for higher engagement.
- Average open rate: 32.67%
- Average click rate: 1.07%
Social Media Engagement Rate
Social media engagement rate measures how your posts connect with followers. You track likes, shares, comments, and clicks to see how your content performs. Several factors influence engagement metrics:
| Factor | Description |
|---|---|
| Organic Audience | Genuine interest increases engagement. |
| Consistency of Posts | Regular posting builds loyalty. |
| Relevance of Content | Relevant posts build trust. |
| Quality of Content | Valuable information attracts attention. |
| Timing of Posts | Posting at optimal times boosts activity. |
You can use Sobot’s live chat and ticketing system to respond quickly to social media inquiries. Sobot’s omnichannel support connects all platforms, so you never miss a message. This unified approach improves engagement metrics and helps you build stronger relationships.
Enhancing Engagement with Sobot Solutions
Sobot’s products boost engagement metrics by connecting every channel and automating routine tasks. Omnichannel support gives you a single view of all customer interactions, making your communication consistent and timely. Automation tools personalize messages based on customer preferences, improving performance across campaigns. You can integrate Sobot with marketing platforms for unified analytics. This lets you track website traffic, response times, satisfaction scores, and conversion rates in one place.
Tip: Monitor performance metrics regularly and share insights with your team to improve future campaigns.
Sobot’s customization options let you match your brand identity. AI capabilities handle basic queries and after-hours support. Mobile compatibility ensures your team and customers stay connected. When you align chat widget design, set up automated greetings, and personalize interactions, you see better engagement metrics and higher website traffic. Sobot’s solutions help you deliver a seamless experience that drives performance and builds loyalty.
You can drive customer engagement and revenue growth by focusing on the most important ecommerce KPIs. Use actionable optimization strategies to improve your results. Review your KPIs often and make decisions based on data. Sobot’s solutions help you track progress and deliver better experiences. Try Sobot Live Chat or request a demo to see how you can boost your business today.
FAQ
What are the most important ecommerce kpis for tracking sales?
You should track conversion rate, repeat purchase rate, and customer lifetime value. These ecommerce kpis help you understand how well your sales strategy works. Monthly sales growth shows if your orders increase over time. Sales kpis reveal which campaigns drive the most revenue.
How can I improve ecommerce kpis like conversion rate by campaigns?
You can use targeted promotions and personalized messages. Sobot Live Chat helps you answer questions fast. Track conversion rate by campaigns to see which strategy works best. Analyze monthly sales growth to adjust your approach and boost sales.
Why is monthly sales growth a key ecommerce kpi?
Monthly sales growth measures how your sales change each month. You can spot trends and adjust your strategy. This ecommerce kpi helps you see if your orders increase. Tracking monthly sales growth lets you compare sales kpis and improve performance.
How do ecommerce kpis help with orders and sales?
Ecommerce kpis show how many orders you get and how much sales you make. You can use these kpis to find weak spots in your sales strategy. Monthly sales growth and conversion rate by campaigns help you plan for better results.
What is the best way to use sales kpis in ecommerce?
You should review sales kpis often. Look at conversion rate by campaigns and monthly sales growth. Use these ecommerce kpis to guide your sales strategy. Track orders and adjust your approach to increase sales and improve your kpi results.
See Also
Enhancing Customer Satisfaction Through E-commerce Chatbots
Increasing Sales With E-commerce Live Chat Solutions
Ten Strategies to Enhance Live Chat Satisfaction