Top Customer Success Metrics and KPIs to Track This Year
Customer success metrics and KPIs shape your strategy for business growth and customer loyalty. Key metrics for 2025 include NPS, customer health score, customer retention, renewal rate, and customer satisfaction score. These metrics help you spot trends, improve customer experience, and drive operational efficiency.
| Metric Name | Purpose | Industry Insight |
|---|---|---|
| Net Promoter Score (NPS) | Measures loyalty and referrals | Widely used as a loyalty indicator |
| Customer Health Score | Flags engagement and churn risk | Proactive management tool |
| Customer Retention | Tracks how many customers stay | Directly impacts profitability |
| Renewal Rate | Measures contract or subscription renewals | Key for SaaS and subscription models |
| Customer Satisfaction Score | Gauges satisfaction after interactions | Common post-interaction metric |
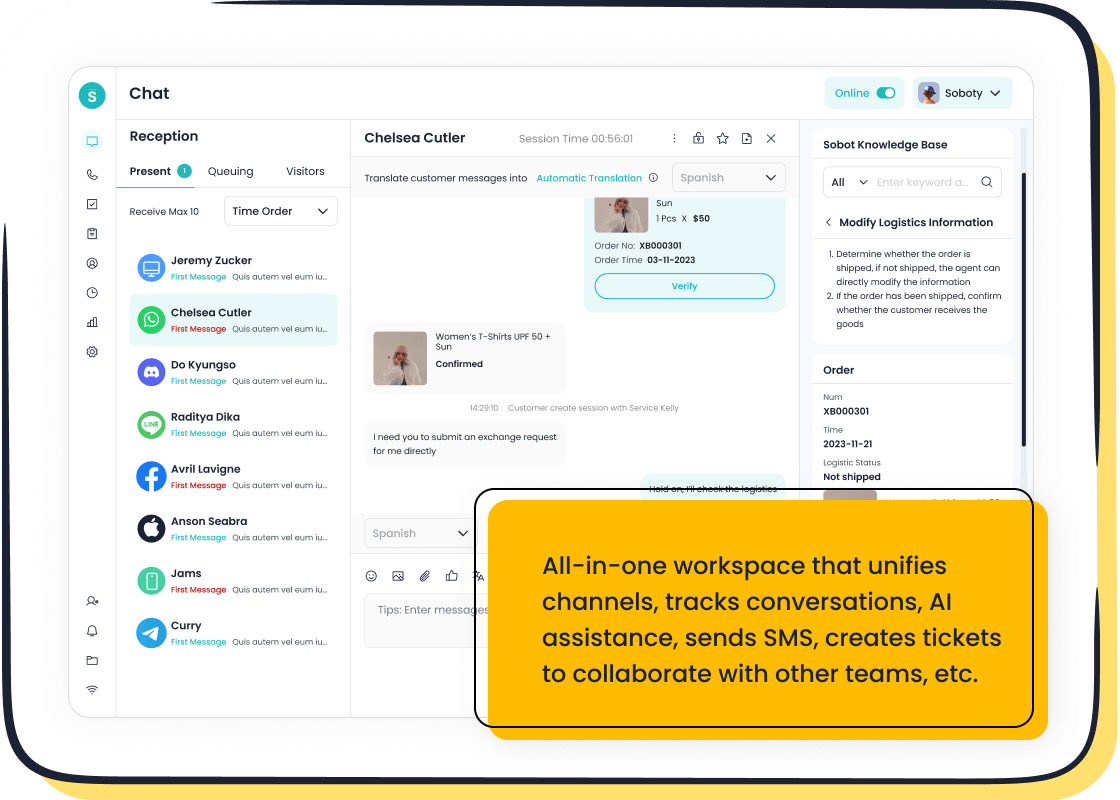
You can use Sobot and Sobot AI-driven omnichannel solutions, like Live Chat, to monitor these customer success metrics and KPIs in real time. Benchmark your current performance, focus on customer retention, and adopt best practices to strengthen customer loyalty and boost your renewal rate.
Customer Success Metrics and KPIs

What Are Customer Success Metrics?
Customer success metrics and KPIs help you measure how well your business supports and grows customer relationships. These metrics give you a clear view of your customer contact and support performance. In a modern contact center, you track both call center metrics and digital channel metrics. This approach covers every touchpoint, from phone calls to live chat and social media.
Customer success metrics include both quantitative and qualitative measures. You use them to evaluate satisfaction, loyalty, engagement, and retention. Some of the most important metrics are:
- Customer Lifetime Value (CLV)
- Net Promoter Score (NPS)
- Customer Effort Score (CES)
- First Contact Resolution rate
- Customer Health Score
- Customer Satisfaction Score (CSAT)
- Customer Retention Rate
- Average Revenue Per User (ARPU)
- Monthly Recurring Revenue (MRR)
- Renewal Rate
You can build a customer success scorecard to track these key performance indicators. This scorecard helps you spot trends and areas for improvement. Sobot’s omnichannel solutions make it easy to collect and analyze these metrics across all your channels.
Why Metrics Matter
Customer success metrics and KPIs drive your business outcomes. They show you where customers feel satisfied and where they face challenges. For example, a high Customer Effort Score means your customers find it easy to get help, which leads to higher retention and loyalty. A strong Net Promoter Score signals that your customers will recommend your brand, boosting your reputation and revenue.
Tracking customer success metrics helps you reduce churn and increase retention. When you use a customer success scorecard, you can see which areas need attention. For instance, if your churn rate rises, you know to review your support process. Sobot Live Chat and analytics tools let you monitor these metrics in real time, so you can respond quickly and keep your customer relationships strong.
Tip: Companies that track customer success metrics and KPIs with advanced tools and AI see faster improvements in customer satisfaction and operational efficiency.
Key Metrics for 2025
NPS (Net Promoter Score)
Net Promoter Score (NPS) measures how likely your customers are to recommend your product or service to others. You ask customers to rate their likelihood on a scale from 0 to 10. Scores of 9-10 are promoters, 7-8 are passives, and 0-6 are detractors. To calculate NPS, subtract the percentage of detractors from the percentage of promoters. For example, if 70% are promoters and 10% are detractors, your NPS is 60. This score ranges from -100 to 100 and gives you a clear view of customer loyalty and satisfaction.
NPS stands out as a critical customer success metric for 2025 because it captures overall brand perception, not just satisfaction with a single interaction. It helps you spot promoters who drive referrals and detractors who may churn. Tracking NPS over time reveals trends in customer sentiment and helps you make smarter decisions for growth. Sobot’s omnichannel solutions make it easy to collect and analyze NPS across all your channels.
NPS is more than a number—it is a benchmark for customer engagement and brand health.
Customer Health Score
A customer health score combines several data points to show how well your customers are doing with your product. You include factors like product usage, support tickets, satisfaction surveys, and account growth. Each factor gets a weight based on its impact. You add up positive actions and subtract negative ones to get a score, usually from 0 to 100.
Customer health scores help you identify at-risk customers and those ready for upsell. High scores mean strong relationships and higher customer retention. Low scores signal churn risk, so you can act early. Sobot Live Chat and analytics tools help you track these scores in real time, giving you a full picture of customer well-being.
Customer Retention
Customer retention measures how many customers stay with your business over time. You calculate the customer retention rate by comparing the number of customers at the end of a period to the number at the start, excluding new customers. For example, if you start with 1,000 customers and end with 900, your retention rate is 90%.
| Industry | Customer Retention Rate (2025) |
|---|---|
| Overall Average | 72.5% |
| Energy/Utilities | 89% |
| Computer Software | 86% |
| Telecommunications | 69% |
| Wholesale | 44% |
High customer retention means your customers find value and stay loyal. Quick, effective support, a user-friendly product, and personalized service all drive retention. Sobot’s unified workspace and automation features help you deliver fast, consistent service, boosting your customer retention rate.
Renewal Rate
Renewal rate shows the percentage of customers who renew their contracts or subscriptions within a set period. You calculate it by dividing the number of customers who renewed by the total eligible for renewal, then multiplying by 100%. For example, if 100 customers are up for renewal and 98 renew, your renewal rate is 98%.
| Subscription Length | Average Renewal Rate |
|---|---|
| Weekly | 73% |
| Monthly | 64% |
| Annual | 25% |
A high renewal rate signals strong customer loyalty and satisfaction. Tracking this customer success metric helps you spot trends and improve your retention strategies. Sobot’s analytics let you monitor renewal rates and take action to keep customers engaged.
CSAT (Customer Satisfaction Score)
Customer Satisfaction Score (CSAT) measures how satisfied customers are after an interaction. You ask customers to rate their experience, usually on a scale from 1 to 5 or 1 to 10. To calculate CSAT, divide the number of satisfied customers by the total number of respondents and multiply by 100. For example, if 80 out of 100 customers are satisfied, your CSAT is 80%.
A CSAT above 70% is good, while scores above 80% are excellent. The average across industries is about 78%. Sobot Live Chat makes it easy to trigger CSAT surveys after key touchpoints, helping you gather feedback and improve service quality.
CES (Customer Effort Score)
Customer Effort Score (CES) measures how easy it is for customers to get help or solve problems. You ask customers to rate the effort required, often on a 5- or 7-point scale. Low effort means customers can resolve issues quickly, which leads to higher loyalty.
Research shows that 94% of customers with low-effort experiences intend to repurchase, while only 4% with high effort do. CES is more predictive of loyalty than other customer success metrics. Sobot’s AI-powered chatbots and unified workspace help reduce customer effort by streamlining support.
Churn Rate
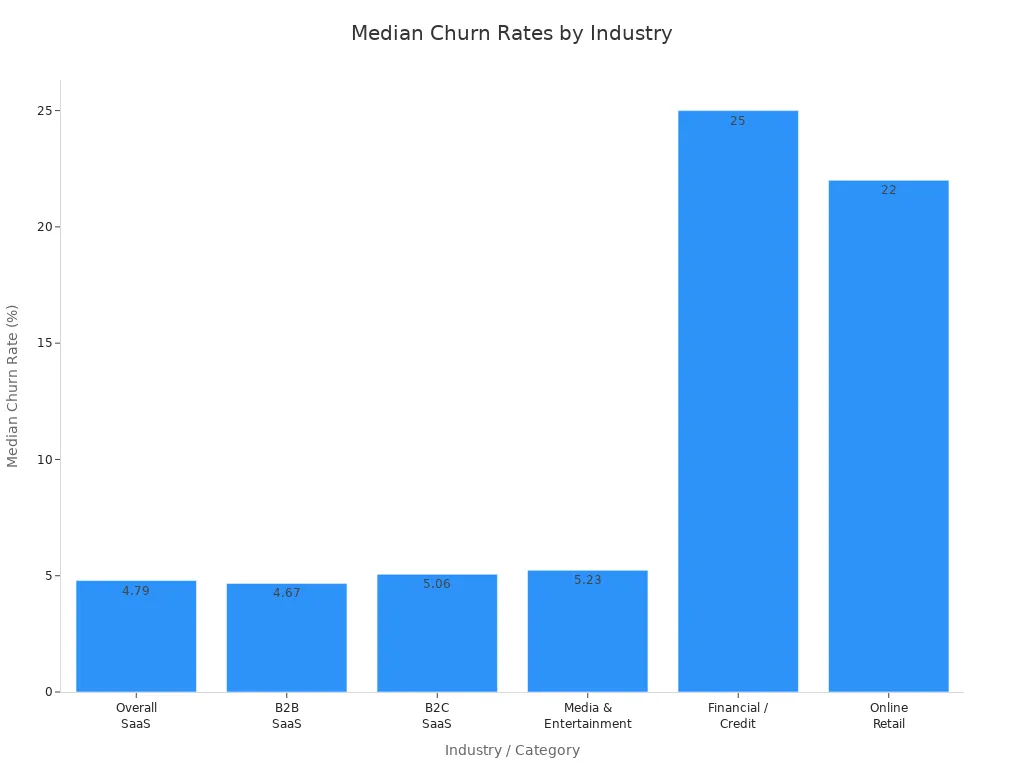
Customer churn rate tracks the percentage of customers who stop using your product or service during a specific period. To calculate, divide the number of customers lost by the number at the start of the period, then multiply by 100. For example, if you start with 2,000 customers and lose 50, your churn rate is 2.5%.
| Industry / Segment | Typical Churn Rate (%) |
|---|---|
| SaaS (annual) | ~5 |
| SaaS (monthly) | <1 (aim) |
| SMB SaaS (monthly) | 3 - 7 |
| Large Enterprise SaaS | 0.5 - 1 |
| Financial / Credit | 25 |
| Online Retail | 22 |
| Digital Media & Entertainment | 6 |
| Healthcare | 6 |
High churn signals problems with customer experience, product fit, or support. Common causes include poor service, lack of personalization, and product quality issues. Sobot’s omnichannel solution helps you address these pain points and reduce churn.
CLV (Customer Lifetime Value)
Customer lifetime value (CLV) estimates the total revenue you can expect from a customer over their relationship with your company. You calculate CLV by multiplying average purchase value, purchase frequency, and expected lifespan. For example, if a customer spends $100 per month for 3 years, their CLV is $3,600.
CLV helps you prioritize resources, optimize renewals, and personalize service. A higher CLV means more profitable, loyal customers. Sobot’s analytics help you track CLV and identify high-value customers for targeted engagement.
MRR & Revenue Metrics
Monthly Recurring Revenue (MRR) measures predictable monthly income from subscriptions. You calculate MRR by multiplying the number of customers by the average revenue per customer. For example, 200 customers paying $100 each month equals $20,000 MRR. Annual Recurring Revenue (ARR) multiplies MRR by 12 for a yearly view.
Other key revenue metrics include net dollar retention, which tracks the net impact of renewals, upsells, and churn. High net dollar retention shows your customer success metrics are driving growth. Sobot’s reporting tools help you monitor these metrics and spot trends in revenue health.
Product Usage
Product usage metrics show how customers interact with your product. Key metrics include activation rate, feature adoption, session length, and daily active users. High usage means customers find value and are more likely to stay.
| Metric Name | Definition and Calculation | Impact on Engagement and Satisfaction |
|---|---|---|
| Activation Rate | % of users who achieve first value ("aha" moment). | Sets tone for customer relationship; higher activation correlates with better engagement and satisfaction. |
| Feature Adoption | % of users interacting with a specific feature. | Reflects recognition of feature value; low adoption may signal issues affecting engagement. |
| Session Length | Time spent by a user in a single session. | Longer sessions suggest deeper engagement and interest. |
| Churn Rate | % of users who stop using the product in a period. | Indicates dissatisfaction or loss of interest; lower churn means better retention and satisfaction. |
Sobot’s analytics dashboard lets you track these customer engagement metrics in real time, helping you improve onboarding and feature adoption.
Qualitative Feedback
Qualitative feedback gives you rich insights into customer needs and pain points. You collect it through interviews, surveys, focus groups, and open-ended questions. Organize feedback by themes, use coding and analysis tools, and combine it with quantitative data for a full view.
Steps to collect and analyze qualitative feedback:
- Gather feedback through interviews, surveys, and in-app prompts.
- Group responses by themes like usability or satisfaction.
- Use AI tools to tag and analyze large volumes of feedback.
- Combine insights with customer success metrics to guide improvements.
Sobot’s omnichannel platform supports feedback collection across all channels, making it easier to turn insights into action.
Integrating all these customer success metrics gives you a holistic view of your customer journey. By tracking NPS, customer health score, customer retention rate, renewal rate, customer satisfaction score, customer churn rate, customer lifetime value, net dollar retention, and product usage, you can make informed decisions that drive loyalty and growth.
Measuring Customer Success Metrics
Data Collection Methods
You need reliable data to measure customer success metrics effectively. One of the most effective methods in 2025 is tracking the First Contact Resolution (FCR) rate. FCR shows the percentage of customer issues solved during the first interaction. A high FCR rate means your team resolves problems quickly, which boosts satisfaction and efficiency. To calculate FCR, divide the number of cases resolved on the first contact by the total cases handled, then multiply by 100. Monitoring FCR by issue type helps you spot gaps in training or your knowledge base. You can also gather data through post-interaction surveys, product usage logs, and feedback forms. These methods give you a complete view of your customer success metrics.
Benchmarking Standards
You should compare your customer success metrics to industry averages to see how you perform. Benchmarking helps you find strengths and areas for improvement. Common metrics for benchmarking include NPS, CSAT, CLV, churn rate, and Customer Health Score. Use both quantitative and qualitative benchmarks to get a full picture.
| Benchmark Type | Description | Purpose/Benefit |
|---|---|---|
| Quantitative Benchmarks | Large datasets of industry-specific customer experience metrics filtered by category, region, etc. | Show relative ranking against industry averages and competitors; identify focus areas and track improvements over time. |
| Text Benchmarks | Analysis of customer comments and sentiment to understand qualitative feedback. | Gain deeper insights into customer perceptions and identify strengths and weaknesses beyond numeric scores. |
| Branded Benchmarks | Use of market intelligence tools to compare customer experience metrics against specific competitors. | Understand competitive visit share and satisfaction, enabling targeted competitive strategies. |
No universal standards exist yet, but you can set realistic goals by using available industry data and your own historical performance.
Using Sobot Live Chat Analytics
Sobot Live Chat Analytics gives you a powerful dashboard to track customer success metrics in real time. The platform offers over 300 statistical reports and thousands of indicators. You can monitor FCR, NPS, CSAT, and more from a single dashboard. Sobot’s predictive analytics help you forecast churn and customer value. Real-time alerts let you respond quickly to changes in customer behavior. The dashboard is user-friendly, so your team can access insights without technical skills. Integration with your CRM unifies data from all channels, making your customer success metrics easy to analyze and act on. Sobot’s AI Copilot also reduces agent workload and improves conversion rates, helping you boost operational efficiency.
Tip: Use Sobot’s dashboard to set up alerts for key customer success metrics. This helps you act fast and keep your customers happy.
Improving Customer Success Metrics
Proactive Support Strategies
You can boost customer retention and satisfaction by taking action before problems arise. Proactive support means you reach out to customers with helpful information, not just wait for questions. For example, you can use health monitoring tools to spot issues early and send alerts before customers notice a problem. Many companies see fewer support tickets when they offer self-service options like FAQs and knowledge bases. Proactive education, such as onboarding webinars, helps customers use your product better and reduces confusion. AI-powered notifications, like shipping updates or service alerts, keep customers informed and build trust. These steps lead to stronger customer loyalty and a better customer experience.
Personalization and Engagement
Personalized service makes every customer feel valued. You can use customer data to tailor messages, recommend products, or offer special deals. When you address customers by name and remember their preferences, you increase customer engagement. Sobot Live Chat helps you segment customers and send targeted messages across channels. This approach improves the customer experience and encourages repeat business. Companies that personalize support often see higher customer lifetime value and stronger customer relationships.
Leveraging AI and Automation
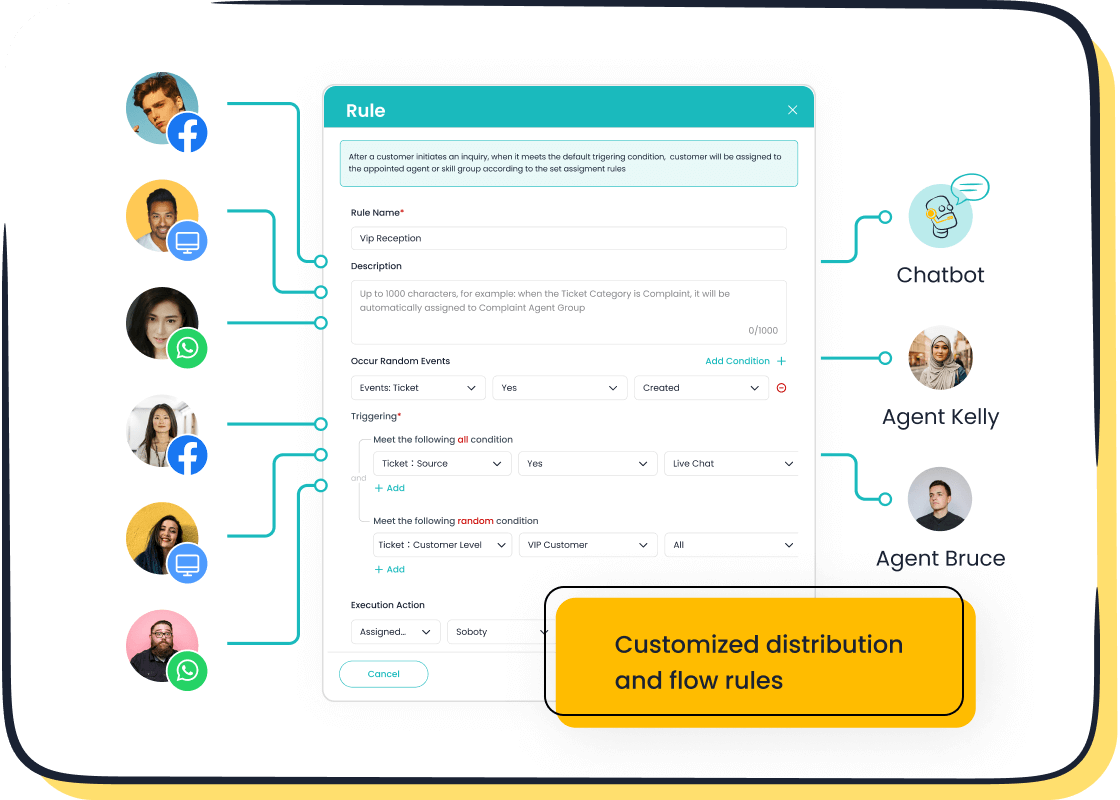
AI and automation help you deliver faster, smarter support. AI-powered chatbots answer common questions 24/7, freeing your team to handle complex issues. Predictive analytics spot patterns and alert you to customers at risk of leaving. Sobot’s omnichannel solution uses AI to route conversations to the right agent and suggest next steps. Automation speeds up responses and reduces errors, which improves customer engagement and increases customer lifetime value.
Team Training and Collaboration
Well-trained teams provide better support. You should invest in regular training so agents know your products and can solve problems quickly. Collaboration tools let your team share knowledge and work together on tough cases. Sobot’s unified workspace brings all conversations and customer data into one place, making teamwork easier. When your team works well together, you improve customer relationships and boost customer retention.
Using Sobot Solutions
Sobot’s omnichannel and Live Chat solutions give you the tools to improve every key metric. You can track customer experience in real time, send satisfaction surveys, and analyze feedback. AI-powered features help you predict churn and personalize support. With Sobot, you can increase customer retention, raise your NPS, and grow customer lifetime value. These solutions help you build lasting customer relationships and drive business growth.
Real-World Success Stories

Agilent and Sobot
You can see the impact of Sobot’s solutions in Agilent’s transformation. Agilent, a leader in life sciences and diagnostics, faced high volumes of customer inquiries and needed to improve both efficiency and service quality. By adopting Sobot’s omnichannel platform and AI-powered chatbots, Agilent achieved remarkable results:
- Operational efficiency increased by 6 times.
- Overall costs dropped by 25%.
- The customer satisfaction score soared to 95%.
- AI agents handled over 70% of routine inquiries, freeing human agents to focus on complex cases.
- This shift led to a 30% reduction in operational costs and better resource management.
- Intelligent routing and a stable system ensured customers always reached the right support quickly.
Sobot’s AI-powered tools gather context, predict needs, and resolve common requests, which reduces repetitive work for your team. This approach lets your agents focus on high-value interactions, driving both efficiency and satisfaction.
Industry Benchmarks
When you compare Agilent’s results to industry standards, the improvements stand out. For example, a typical customer satisfaction score in the technology and life sciences sector ranges from 78% to 85% (source). Agilent’s 95% score sets a new standard for excellence. Many companies struggle to automate more than 50% of routine inquiries, but Agilent’s AI agents handle over 70%. Cost reductions of 25% also exceed the industry average, where most organizations see only 10-15% savings after digital transformation.
| Metric | Industry Average | Agilent with Sobot |
|---|---|---|
| Customer Satisfaction Score | 78-85% | 95% |
| Routine Inquiry Automation | ~50% | 70%+ |
| Cost Reduction | 10-15% | 25-30% |
Lessons Learned
You can draw several lessons from Agilent’s success with Sobot:
- Invest in AI-powered chatbots to handle routine tasks and boost efficiency.
- Use omnichannel platforms to unify customer data and streamline support.
- Monitor your customer satisfaction score regularly to identify improvement areas.
- Intelligent routing ensures customers reach the right agent, improving resolution rates.
- Combining human expertise with AI leads to higher satisfaction and lower costs.
By following these strategies, you can achieve similar gains in efficiency, cost savings, and customer satisfaction.
Tracking customer success metrics and KPIs drives sustainable growth. You gain insights into customer retention, NPS, and renewal rates by using real-time analytics. Sobot’s Live Chat and omnichannel solutions help you monitor over 150 customer success metrics and KPIs, leading to a 38% increase in conversion and a 95% CSAT score for brands like Agilent.
- Start measuring your customer success metrics and KPIs today.
- Use Sobot’s tools to improve your results and build loyalty.
Strong customer success metrics and KPIs set your business apart. Explore Sobot’s solutions to boost your customer success metrics and KPIs.
FAQ
What are the most important customer success metrics and KPIs to track?
You should focus on Net Promoter Score (NPS), Customer Satisfaction Score (CSAT), customer retention, churn rate, and customer health score. These customer success metrics and KPIs help you measure loyalty, satisfaction, and business growth. Sobot’s analytics dashboard tracks over 150 indicators for a complete view.
How can Sobot help me improve my customer success metrics and KPIs?
Sobot’s omnichannel and Live Chat solutions let you monitor customer success metrics and KPIs in real time. You can collect feedback, analyze trends, and automate routine tasks. For example, Agilent improved efficiency by 6 times and reached a 95% CSAT score using Sobot.
Why should I benchmark my customer success metrics and KPIs?
Benchmarking your customer success metrics and KPIs helps you compare your results to industry standards. This process shows where you excel and where you need improvement. For example, a CSAT above 80% means you outperform most companies (source).
How often should I review my customer success metrics and KPIs?
You should review your customer success metrics and KPIs at least monthly. Regular reviews help you spot trends, address issues early, and make data-driven decisions. Sobot’s real-time analytics and alerts make it easy to stay updated and respond quickly.
See Also
Best 10 Customer Feedback Tools To Use In 2024
Comparing The Leading Voice Of Customer Software Options
The 10 Best Customer Support Software Solutions For 2024
