How Customer Service Dashboard Metrics Shape Customer Experience
Customer service dashboard metrics play a crucial role in shaping customer experience. Businesses that track these metrics see measurable improvements in service quality and satisfaction. For example, advanced dashboards can reduce average handle time by 30% and boost customer satisfaction by 20%. Companies like Sobot use Sobot AI-powered analytics to monitor real-time customer interactions, ensuring every customer receives quick, effective support. These insights help identify issues, drive agent performance, and create a seamless experience across every channel.
Customer Service Dashboard Metrics

Definition and Role
Customer service dashboard metrics are numbers and data points that show how well a support team helps customers. These metrics appear on dashboards in contact centers and customer support environments. They help managers and agents see what is happening in real time. Some common customer service metrics include First Call Resolution (FCR), Average Handle Time (AHT), Customer Satisfaction Score (CSAT), and Call Abandonment Rate. Each metric gives a different view of how customers feel and how quickly their problems get solved.
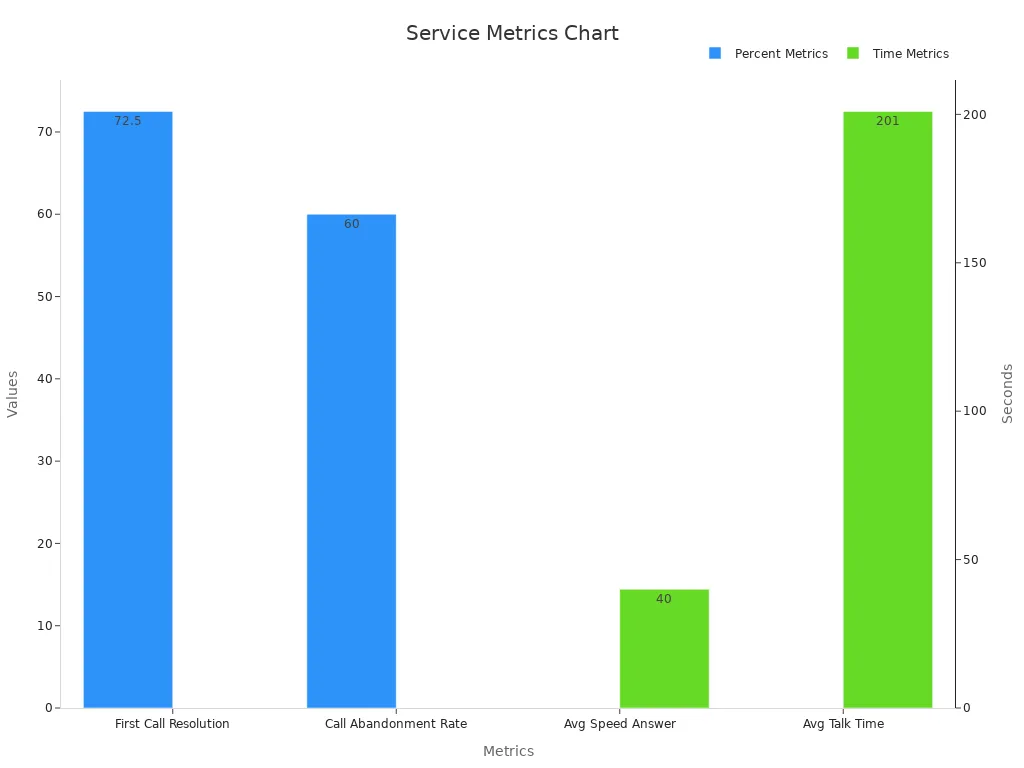
A well-designed dashboard helps teams focus on what matters most. For example, FCR shows if a customer’s problem is fixed on the first try. CSAT measures how happy customers feel after getting help. AHT tells how long agents spend on each call or chat. These customer experience metrics help teams find areas to improve and keep service quality high.
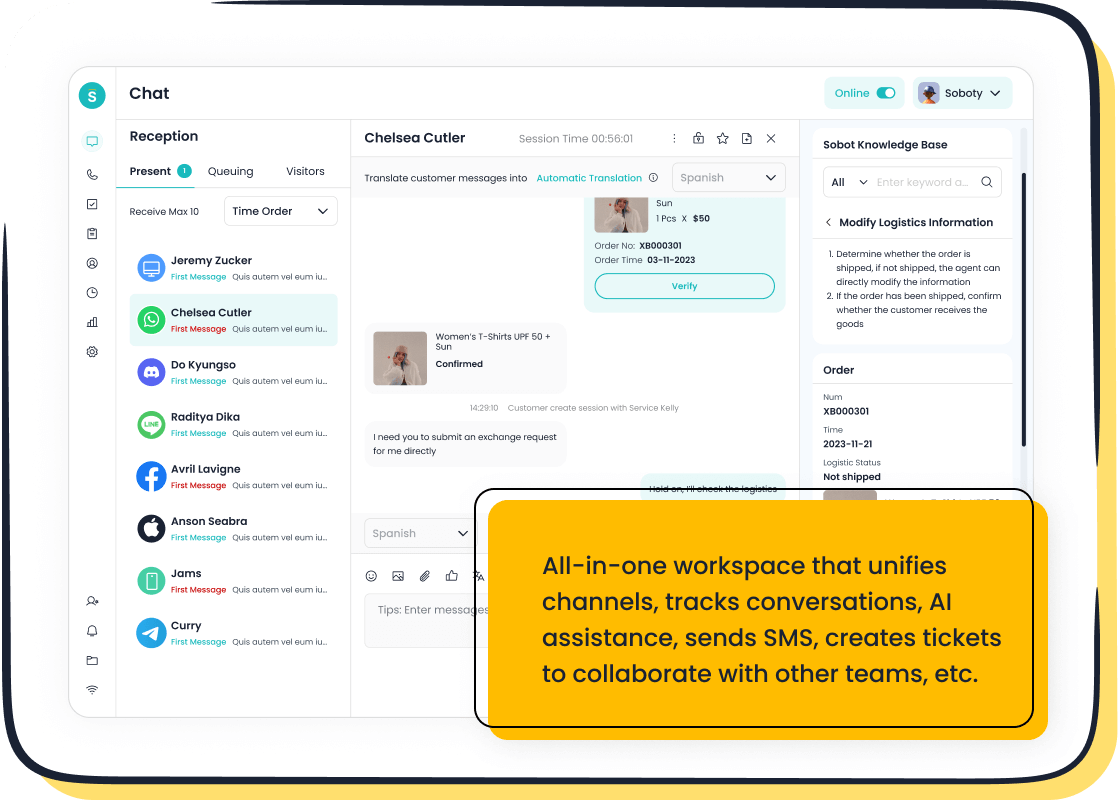
Sobot provides advanced dashboard solutions for measuring customer experience. With Sobot Live Chat, businesses can track over 150 indicators, including CSAT and response times, across all channels. The built-in analytics and satisfaction surveys help teams understand customer needs and improve service.
| Metric | Purpose | Recommended Target |
|---|---|---|
| First Call Resolution | Solves issues on first contact | Above 75% |
| Average Handle Time | Measures time spent per interaction | 5-7 minutes |
| CSAT | Tracks customer satisfaction | Above 85% |
| Wait Time | Shows how long customers wait | Under 60 seconds |
| Abandonment Rate | Measures customers leaving before connection | Under 5% |
Why Metrics Matter
Customer service dashboard metrics matter because they help teams see what works and what needs fixing. By measuring customer experience, companies can spot trends, find bottlenecks, and make better decisions. For example, high wait times or low FCR can signal problems that need quick action.
- Dashboards show real-time data, so managers can coach agents and improve productivity.
- Metrics like CSAT and NPS help measure customer loyalty and happiness.
- Tracking cx metrics lets teams set goals and see progress over time.
Sobot’s Live Chat analytics give businesses a clear view of their customer service performance. By using these tools, companies can boost satisfaction, reduce costs, and keep customers coming back. Good customer service metrics lead to better support, happier customers, and stronger business results.
Key Customer Experience Metrics
Understanding which customer experience metrics matter most helps businesses improve every interaction. These metrics give a clear picture of how customers feel and where teams can make changes for better results. Sobot Live Chat offers built-in analytics and satisfaction surveys, making it easy to track and act on these important numbers.
Customer Satisfaction Score (CSAT)
The customer satisfaction score measures how happy customers feel after an interaction. Companies collect CSAT by asking customers to rate their experience, often on a scale from 1 to 5. For example, if 80 out of 100 customers rate their experience as “satisfied” or “very satisfied,” the CSAT is 80%. This simple metric shows how well a team meets customer needs at key moments. High customer satisfaction scores mean customers are more likely to return and recommend the service. Sobot Live Chat uses real-time surveys to gather CSAT, helping teams spot trends and make quick improvements.
CSAT is a trusted way to measure customer satisfaction. Scores above 90% show excellent service, while scores below 50% signal areas that need attention.
Net Promoter Score (NPS)
Net promoter score tracks customer loyalty by asking one question: “How likely are you to recommend us to a friend?” Customers answer on a scale from 0 to 10. Companies group responses into promoters, passives, and detractors. High NPS scores link to more loyal customers and faster business growth. For example, Woodruff Sawyer in the insurance industry reached an NPS of 86.1%, far above the industry average of 34%, leading to better retention and fewer lost customers.
| Company / Industry | NPS Score | Industry Average | Key Outcomes / Insights |
|---|---|---|---|
| Woodruff Sawyer | 86.1% | 34% (Insurance) | Identified detractors, improved service, prevented revenue loss |
| Essential StaffCARE | 74% | N/A | Improved client understanding and services |
| Staffing Firms | N/A | N/A | Linked NPS to $1.4M revenue growth, better retention and referrals |
NPS helps businesses like those using Sobot Live Chat focus on what drives loyalty and where to improve.
Customer Effort Score (CES)
Customer effort score shows how easy it is for customers to get help or solve a problem. After an interaction, companies ask, “How easy was it to get your issue resolved?” Lower effort means higher satisfaction and loyalty. Research shows that 94% of customers who report low effort are likely to buy again. Sobot’s analytics help teams find and fix steps that make things harder for customers, leading to smoother experiences.
- CES predicts future purchases and referrals.
- Scores above 90% show strong customer experience.
- High effort often leads to negative reviews and lost loyalty.
Response and Resolution Times
Fast response and resolution times are key cx metrics for great customer experience. Customers expect quick answers and solutions. Studies show that 79% of people want a fast response, and 83% feel more loyal to brands that solve problems quickly. Sobot Live Chat tracks these metrics in real time, helping teams reduce wait times and boost satisfaction.
Quick responses and fast resolutions keep customers happy and loyal. Sobot’s dashboard makes it easy to monitor these numbers and take action.
Tracking these customer experience metrics with tools like Sobot Live Chat helps businesses understand what customers need, improve service, and build lasting relationships.
Impact on Customer Experience

Identifying Pain Points
Customer service dashboard metrics help businesses spot where customers struggle during their journey. By tracking key indicators like Customer Satisfaction Score, Customer Effort Score, and Net Promoter Score, companies can see which parts of the experience need attention. Real-time dashboards show patterns in complaints, long wait times, or repeated questions. This data lets teams act quickly to fix problems.
- Customer Satisfaction Score (CSAT) highlights moments when customers feel unhappy.
- Customer Effort Score (CES) shows if customers find it hard to get help.
- Net Promoter Score (NPS) reveals if customers would recommend the service.
- Social media metrics track how fast teams respond and how people feel about the brand.
- Customer churn rate signals when customers leave, often due to poor service quality.
Sobot’s analytics tools collect and display these metrics in one place. This makes it easier for managers to see pain points and make changes. For example, dashboards can show if customers wait too long for answers or if certain questions come up often. Teams can then adjust their approach, improving the overall customer experience.
Dashboards that visualize real-time data help businesses detect pain points and act before small issues become big problems.
Driving Service Quality
Careful monitoring of customer service metrics leads to better service quality. When teams track metrics like average resolution time, first response time, and customer retention rate, they can see where to improve. Lower resolution times and faster responses mean customers get help quickly, which boosts satisfaction and loyalty.
| Metric | What It Shows | Why It Matters |
|---|---|---|
| Average Resolution Time | How fast issues get solved | Faster solutions, happier customers |
| First Response Time | How quickly agents reply | Quick replies build trust |
| Customer Retention Rate | How many customers stay over time | High retention means strong loyalty |
OPPO, a global smart device brand, used Sobot’s solutions to improve service quality. During busy shopping seasons, OPPO faced a surge in customer questions. By using Sobot’s chatbot and ticketing system, OPPO handled simple questions with AI and let human agents focus on complex issues. This change led to an 83% chatbot resolution rate and a 94% positive feedback rate. OPPO also saw a 57% increase in repurchase rate, showing that better service quality leads to more loyalty and advocacy.
Companies that monitor these metrics can make data-driven decisions, leading to continuous improvements in service quality and customer experience.
Enhancing Customer Satisfaction
Systematic analysis of customer service metrics helps businesses boost customer satisfaction and loyalty. Studies show that satisfaction is a key driver of loyalty and advocacy. When companies measure satisfaction after each interaction, they can see what works and what needs fixing. This feedback loop supports ongoing improvements.
- Satisfied customers are more likely to return and recommend the brand.
- High satisfaction scores often lead to higher retention and lower churn rates.
- Tracking satisfaction helps teams spot trends and adjust their service.
Sobot’s unified dashboard brings together all these metrics, making it easy for teams to measure overall cx performance. By acting on this data, businesses can create a smoother customer journey and build lasting relationships. OPPO’s success with Sobot shows how metric analysis leads to real gains in satisfaction, loyalty, and advocacy.
Customer satisfaction and loyalty grow when companies use data to guide every step of the customer journey.
Best Practices for Using Metrics
Data Collection and Analysis
Collecting accurate data is the first step in any cx improvement strategy. Companies gather feedback through surveys, forms, social media, and support chats. Using survey software helps automate this process, sending questions right after a customer interaction. Real-time results and customizable reports make it easier to spot trends. Teams should combine numbers, like CSAT or NPS, with written feedback to get a full picture of customer engagement. Sobot’s omnichannel solution lets businesses collect and analyze data from every channel in one place, making it simple to track customer service performance and act quickly.
Tip: Keep surveys short and send them right after the interaction for the best response rates.
Dashboard Visualization
A clear dashboard helps teams understand what the metrics mean. Interactive dashboards let users filter data, drill down into details, and see real-time updates. This makes it easier to find problems and make decisions fast. For example, Lenovo improved efficiency by 95% using interactive dashboards. Good dashboards use charts, labels, and stories to show how customer engagement changes over time. Sobot’s unified workspace brings all data together, so teams can see customer experience metrics and take action without switching tools.
| Visualization Feature | Benefit |
|---|---|
| Real-time updates | Faster decisions |
| Filters & drill-down | Deeper understanding |
| Clear labels | Easy to read |
Team Engagement
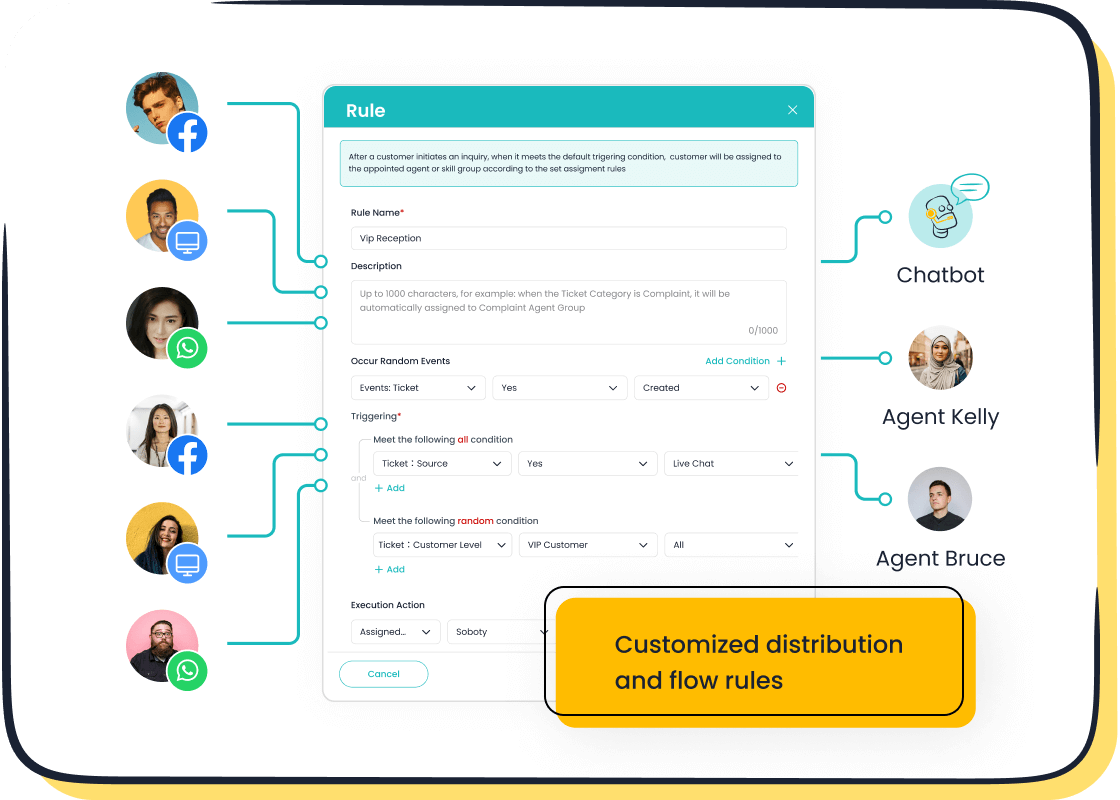
Engaged teams use dashboards to improve customer service every day. Studies show that 70% of organizations using dashboards make better decisions. When teams see their progress, they feel more motivated and aligned with company goals. Sobot’s unified workspace supports team collaboration by showing all customer data and metrics in one view. This helps agents share insights, solve problems together, and follow a strong cx improvement strategy.
Note: Regularly review metrics as a team to spot trends and celebrate wins.
Steps to Improve Customer Satisfaction
Set Clear Objectives
Successful companies start by setting clear, measurable goals for customer experience. They define what they want to achieve and make sure these goals match their business priorities. A structured approach helps teams focus on what matters most. For example:
- Define specific objectives, such as increasing satisfaction scores or reducing wait times.
- Use a customer insights framework to bring together feedback from all channels.
- Design targeted surveys at key points in the customer journey.
- Convert feedback into scores using simple rating systems.
- Analyze which factors have the biggest impact on satisfaction.
Atom Bank used this method and reduced support calls by 40%. LendingTree processed over 20,000 customer comments in 90 days, finding key themes that improved their services. These steps show that clear objectives lead to real improvements in loyalty and engagement.
Monitor and Act on Data
Continuous monitoring helps teams spot trends and act quickly. Advanced analytics tools, like those in Sobot Live Chat, track customer experience in real time. Teams can see which issues need attention and respond before problems grow. Companies use dashboards to visualize data, making it easy to understand and share insights.
- Real-time monitoring with AI and automation helps teams predict and solve issues.
- Integrating data from all channels gives a complete view of the customer journey.
- Visualization tools turn complex data into clear charts and reports.
When teams act on these insights, they improve service quality and build stronger loyalty.
Tip: Sobot Live Chat’s workflow automation lets teams assign tasks, follow up on feedback, and keep improving every day.
Measure Results and Adjust
Measuring results is key to optimizing customer experience. Companies that use satisfaction measurement programs find improvement opportunities 65% faster than those who rely on guesswork. They analyze trends, compare satisfaction scores, and link results to business outcomes like retention and productivity.
- Continuous feedback loops help teams adjust strategies and avoid stagnation.
- Advanced analytics reveal which changes drive the most loyalty.
- Companies that measure and adjust see up to 36% greater gains in satisfaction.
Sobot’s built-in analytics make it easy to track progress and adjust workflows for ongoing optimization. This approach ensures that every change leads to better customer engagement and long-term loyalty.
Effective use of dashboard metrics leads to better customer experience and business growth. Companies that focus on metrics like NPS and CSAT see double the revenue growth of their peers. For example:
- Taylor & Hart doubled revenue by tracking NPS and acting on feedback.
- Cox Communications raised NPS by 11 points and reduced churn through a Voice of the Customer program.
Sobot Live Chat helps teams track these metrics and turn insights into action. Teams can start by auditing current metrics, setting up a unified dashboard, and training staff to use data for improvement. Explore Sobot’s solutions to drive better outcomes and lasting loyalty.
FAQ
What are customer service dashboard metrics?
Customer service dashboard metrics are numbers that show how well a team helps customers. These metrics include CSAT, NPS, and response times. Sobot Live Chat tracks over 150 indicators to help companies improve customer experience and service quality.
How do customer service dashboard metrics improve customer experience?
Customer service dashboard metrics help teams find problems fast. For example, if wait times rise, managers can add more agents. Sobot’s analytics show real-time data, so teams can act quickly and keep customers happy.
Why should businesses use Sobot Live Chat for tracking metrics?
Sobot Live Chat offers built-in analytics, satisfaction surveys, and omnichannel support. Companies can track customer experience across all channels. This helps teams boost satisfaction, reduce costs, and improve service quality.
Which customer experience metrics matter most?
Key customer experience metrics include Customer Satisfaction Score (CSAT), Net Promoter Score (NPS), Customer Effort Score (CES), and response times. These metrics show how customers feel and how quickly teams solve problems. Sobot Live Chat makes tracking these metrics easy.
Can customer service dashboard metrics help increase sales?
Yes! Companies that track customer service dashboard metrics see higher conversion rates. Sobot Live Chat users report a 38% gain in conversion by using precise profiling and fast responses. Better customer experience leads to more sales and loyalty.
Tip: Regularly review your customer service dashboard metrics to spot trends and make improvements.
See Also
Effective Strategies To Enhance Call Center Monitoring Results
Artificial Intelligence Agents Transform The Future Of Support
Leading Customer Service Software Solutions Ranked For 2024
