Customer Service Dashboard Creation for Better Support in 2026

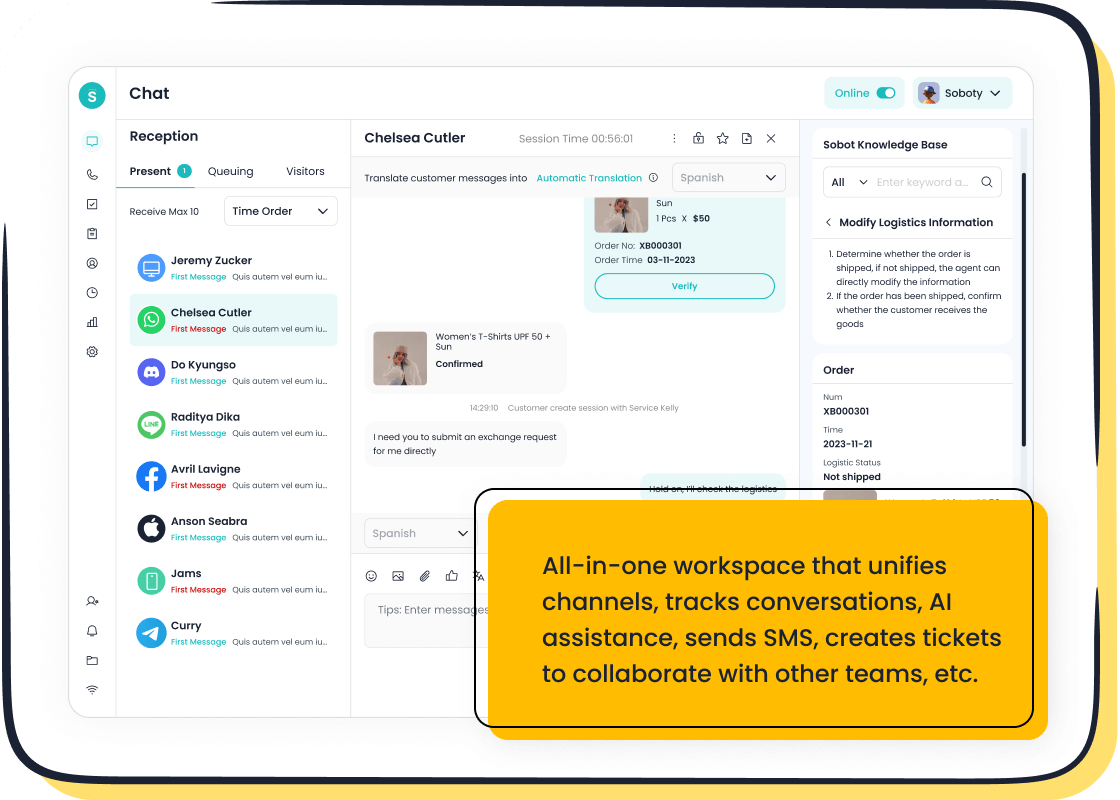
A customer service dashboard gives you the power to see customer interactions in real time. You can track data from every channel, helping you respond quickly and improve satisfaction. With omnichannel integration, you connect website, app, and social media conversations in one dashboard. The latest trends show that real-time data and customization make your dashboard faster and easier to use. Sobot focuses on innovation and customer-centricity, offering tools like Sobot Live Chat that provide smart escalation and instant feedback. You gain a competitive edge by using these tools to personalize each customer experience.
Here are some ways dashboards improve support outcomes:
| Strategic Insight | Description |
|---|---|
| Anticipating Customer Needs | Predict behaviors and engage proactively for better experience. |
| Real-Time Analytics | See customer preferences instantly and adapt your approach. |
| Omnichannel Integration | Connect all channels for seamless service and data-driven decisions. |
What Is a Customer Service Dashboard?
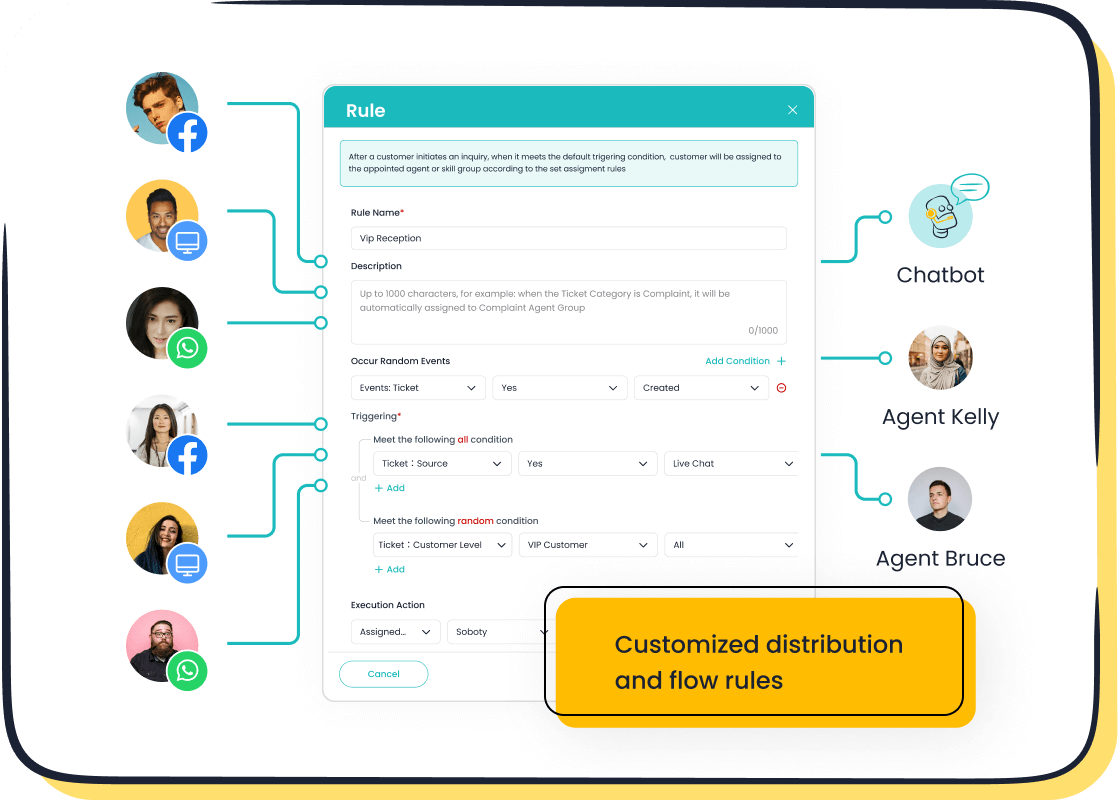
Core Functions and Benefits
A customer service dashboard gives you a clear view of every customer interaction. You can manage all your customer data in one place, making it easier to track conversations and solve problems quickly. The dashboard brings together information from websites, apps, and social media, so you never miss a message. You can see how your team works together, assign tasks, and leave notes for others. This helps your team handle complex customer questions with ease.
Here are some main features you will find in a customer service dashboard:
| Feature | Description |
|---|---|
| Unified data management | Manage all customer interactions and data seamlessly in a single platform across various channels. |
| Team collaboration | Collaborate with internal teams on complex queries, including notes and task assignments. |
| Real-time reporting | Gain insights into service performance with comprehensive reports and user-friendly dashboards. |
| Automated workflows | Automate repetitive tasks to streamline agent workflows for better focus on complex issues. |
You can use these features to improve your customer experience dashboard. Real-time reporting lets you track key performance indicators and customer service metrics. Automated workflows save time and help your team focus on what matters most—helping the customer.
Role in Modern Customer Support
Today, a customer service dashboard plays a big role in customer support. You get real-time insights into your support operations. You can see ticket volume, agent performance, and customer satisfaction all in one place. This makes it easier to spot trends and make smart decisions.
- Customer service dashboards provide real-time insights into support operations, unlike traditional tools.
- They offer a comprehensive view of ticket volume, agent performance, and customer satisfaction metrics.
- The visualization of data on dashboards aids in improving customer satisfaction and decision-making.
A customer support dashboard helps you understand what your customers need. You can use data to improve the customer experience and make changes that boost satisfaction. By tracking customer service metrics, you can see what works and what needs improvement. This makes your team more effective and keeps your customers happy.
Key Metrics for Customer Experience Dashboard 2026

Essential KPIs to Track
You need to track the right key performance indicators to get the most out of your customer experience dashboard. These KPIs help you measure how well your team supports customers and where you can improve. The following table shows some of the most important metrics for 2026:
| KPI | Description |
|---|---|
| Average Wait Time | Shows how long customers wait before speaking to a representative. |
| Average First Response Time | Measures how quickly your team responds to customers on any channel. |
| First Contact Resolution | Tracks if your team solves issues in a single interaction. |
| Average Resolution Time | Measures how long it takes to resolve more complex customer issues. |
| Handover Rate | Counts how often customers get transferred between agents. |
| Abandoned Calls | Shows when customers hang up before getting help. |
| Customer Churn Rate | Measures how many customers stop using your service. |
| Net Promoter Score | Checks how likely customers are to recommend your service. |
| Customer Satisfaction Score | Rates how happy customers are after each interaction. |
| Conversion Rate | Tracks how many visitors become customers. |
Tracking these customer service metrics gives you a clear view of your support quality and helps you make better decisions.
Omnichannel Data Integration
A modern customer service dashboard brings together data from every channel—website, app, social media, and phone. You see the full customer journey in one place. This integration lets you spot trends, understand customer needs, and make changes fast. Sobot’s omnichannel solution connects all your channels, so you never miss a message. You can customize your dashboard to show the data that matters most to you. Saving personalized views helps you focus on what is important for your team.
Analytics and Reporting with Sobot Live Chat
Sobot Live Chat gives you powerful analytics and reporting tools for your customer support dashboard. You can track real-time dashboards, agent performance, and channel comparisons. The platform shows you how customers interact with your team and how AI tools improve service. You can create custom reports to fit your business needs. Sobot’s unified workspace brings together chatbot, AI Agent, live chat, call center, voicebot, ticketing system, and customer contact center data. This gives you actionable insights to improve customer experience and boost satisfaction.
Tip: Use Sobot’s built-in analytics to identify trends and forecast future needs. This helps you stay ahead and deliver better support.
With these features, your customer experience dashboard becomes a powerful tool for growth in 2026.
Step-by-Step Dashboard Creation Guide
Creating a customer service dashboard that truly supports your team and customers in 2026 requires a clear process. You need to set goals, gather the right data, and use tools that help you see and act on customer needs. Here is a step-by-step guide to building a dashboard that delivers actionable insights and drives better customer experience.
Define Objectives and KPIs
Start by deciding what you want your dashboard to achieve. You might want to improve agent performance, boost customer satisfaction, or reduce wait times. Clear objectives help you focus on the right customer service metrics.
Follow these steps to define your objectives and KPIs:
- Identify the main goal for your dashboard. For example, you may want to track how quickly your team responds to customer questions.
- Choose the customer service metrics and KPIs that match your goal. These could include average wait time, first contact resolution, or customer satisfaction score.
- Select a dashboard template or visualization tool that fits your needs. Tools with drag-and-drop features make setup easy.
- Gather feedback from your team. Ask them if the dashboard helps them do their jobs better. Adjust your KPIs as your business grows or changes.
Tip: Sobot’s unified workspace lets you set clear objectives and track over 150 indicators, making it easy to align your dashboard with your business goals.
Integrate Data Sources
A strong customer service dashboard brings together data from every channel. You need to connect your website, app, social media, phone, and email support. This gives you a full view of the customer journey.
Sobot’s omnichannel solution makes this step simple. You can integrate chatbot, AI Agent, live chat, call center, voicebot, ticketing system, and customer contact center data into one dashboard. This unified approach helps you spot trends and respond quickly to customer needs.
- Connect all your communication channels.
- Import historical and real-time data.
- Ensure your dashboard updates automatically as new data comes in.
When you use Sobot, you never miss a message or lose track of a customer’s history. You see every interaction in one place, which helps you deliver a seamless customer experience.
Choose Visualization Tools
The right visualization tools turn raw data into clear, actionable insights. You want to see patterns, spot issues, and measure progress at a glance. Different dashboards serve different purposes.
| Dashboard Type | Key Metrics/Insights |
|---|---|
| Ticketing Dashboard | Tracks number of tickets created, resolved, unresolved, or reopened over time. |
| Support Team Performance Dashboard | Monitors agent performance against SLA metrics like first call resolution and response time. |
| Real-time Call Center Dashboard | Provides visibility into call metrics such as average handle time and talk time. |
| Customer Satisfaction Dashboard | Displays trends in CSAT scores and survey response rates. |
| Customer Experience Dashboard | Identifies patterns in NPS and CES metrics to track customer interactions. |
Sobot Live Chat offers built-in analytics and customizable widgets. You can create dashboards that show the data most important to your team. Drag-and-drop features make it easy to build and adjust your dashboard as your needs change.
- Use charts and graphs to highlight trends.
- Set up alerts for key metrics.
- Customize views for different roles, such as agents or managers.
Note: Customer service dashboards give you a real-time snapshot of team performance and customer satisfaction. They help you make fast, informed decisions.
Design for Usability
A dashboard works best when everyone can use it easily. Focus on the needs of your team and keep the design simple.
- Tailor the dashboard to user goals. For example, agents may want to see open tickets, while managers may focus on overall customer satisfaction.
- Show only the most important information. Too much data can overwhelm users.
- Embed dashboards into the tools your team already uses. Sobot’s unified workspace lets agents access dashboards without switching platforms.
Simple, clear dashboards help your team act quickly and improve the customer experience. When you design with usability in mind, you make it easier for everyone to find the information they need.
Real-Time Monitoring and Feedback
You need to monitor your dashboard in real time to keep up with changing customer needs. Regularly review your metrics and KPIs to make sure they stay relevant.
- Analyze and update your dashboard metrics often.
- Ask for feedback from both customers and employees. Their input helps you improve the dashboard.
- Make changes based on what you learn. Continuous improvement keeps your dashboard useful.
Sobot’s reporting tools let you track live data, compare channels, and measure agent performance. You can see ticket volume, customer satisfaction, and other key metrics as they happen. This helps you respond quickly and keep your support team on track.
Pro Tip: Use Sobot’s satisfaction surveys and feedback tools to gather real-time input from customers. This helps you spot issues early and improve service quality.
Iteration and Scalability with Sobot
Your dashboard should grow with your business. As your customer base expands, you need a dashboard that can handle more data and new channels.
Sobot offers scalability and customization options. You can add new channels, such as WhatsApp or Telegram, as your customers start using them. The platform supports over 550,000 users and handles millions of communications daily, so you never have to worry about outgrowing your dashboard.
- Update your dashboard as your business changes.
- Add new data sources and metrics when needed.
- Customize dashboards for different teams or regions.
Sobot’s unified workspace and integration features make it easy to scale your dashboard. You can manage chatbot, AI Agent, live chat, call center, voicebot, ticketing system, and customer contact center data all in one place. This flexibility ensures your dashboard always meets your needs, no matter how your business evolves.
Remember: A flexible, scalable dashboard helps you deliver a better customer experience and stay ahead in a fast-changing market.
By following these steps, you can create a customer service dashboard that gives you a complete view of your support operations. You will gain actionable insights, improve customer satisfaction, and drive business growth with the right tools and approach.
Best Practices for Customer Support Dashboard Success
Align with Business Goals
You need to make sure your dashboard supports your company’s main goals. Start by asking what your team wants to achieve. For example, you may want to improve customer satisfaction or reduce response times. Choose customer service metrics that match these goals. When you align your dashboard with business needs, you get actionable insights that help your team make better decisions. This approach also ensures your customer satisfaction dashboard tracks the right customer satisfaction metrics. Regularly review your dashboard to keep it in line with changing business targets.
Ensure Data Accuracy and Security
Accurate data is key to building trust with your customers. Your dashboard should always show the latest and most reliable information. Good data management helps you spot problems early and fix them fast. Security is just as important. Protecting customer information keeps your business safe and builds loyalty. The table below shows why data accuracy and security matter:
| Benefit | Description |
|---|---|
| Improved Decision-Making | Dashboards provide warnings for data quality issues, allowing quick responses to maintain accuracy. |
| Cost Efficiency | By monitoring data quality, organizations can reduce costs associated with poor data management. |
| Increased Productivity | Effective dashboards streamline data management processes, enhancing overall productivity. |
| Regulatory Compliance | Ensures adherence to data regulations, protecting the organization from legal issues. |
| Enhanced Customer Satisfaction | Accurate data leads to better service, improving customer experiences and satisfaction. |
You should use best practices for dashboard reporting to keep your data safe and useful. Always check your dashboard for errors and update your security settings often.
Drive Team Adoption and Training
Your dashboard works best when everyone on your team knows how to use it. Start with a user adoption plan. Offer training sessions and share easy-to-follow guides. Keep your team engaged by holding contests or sharing success stories. Use internal messages to remind everyone about new features. Collect feedback from your team to find out what works and what needs improvement. Here are some ways to boost adoption and training:
- Develop a user adoption plan alongside dashboard design.
- Provide ongoing training through workshops and vendor courses.
- Promote dashboards with internal communications and training materials.
- Engage users with contests to encourage practical use.
- Monitor usage and gather feedback to improve the training process.
When your team feels confident using the dashboard, you see better results in customer experience and satisfaction.
Common Pitfalls in Dashboard Implementation
When you build a dashboard for customer support, you want it to help your team and improve satisfaction. However, some common mistakes can make your dashboard less effective. Knowing these pitfalls helps you avoid them and create a tool that truly supports your goals.
Overcomplicating the Interface
A dashboard should make your work easier, not harder. If you add too many features or make the layout confusing, users feel overwhelmed or annoyed. They may not know where to start or how to find the information they need. Some common problems include:
- Multiple logins just to access basic information
- Confusing navigation that slows down your team
- Redundant features that repeat what other tools already do
Unnecessary features can slow down your customer support team and lead to frustration. Keep your dashboard simple and focused on what matters most for customer satisfaction.
Ignoring User Feedback
Your team and your customers use the dashboard every day. If you ignore their feedback, you miss chances to improve. Here are some risks:
- Missed opportunities to make the dashboard better
- Users feel unheard, which lowers trust and engagement
- Lack of new ideas keeps your dashboard from growing
- Customers stay unsatisfied if their pain points are not fixed
- Higher churn as users look for better solutions
Listening to feedback helps you spot problems early and improve satisfaction. It also keeps your dashboard useful and relevant.
Neglecting Regular Updates
Dashboards need regular updates to stay secure and effective. If you skip updates, you risk many problems. The table below shows what can happen:
| Risk Type | Description |
|---|---|
| Security Vulnerabilities | Hackers can exploit outdated systems, causing data breaches. |
| Broken Functionality | Features may stop working with new software versions. |
| Performance Issues | Slow dashboards hurt user experience and satisfaction. |
| Compatibility Problems | Old dashboards may not work on new devices or browsers. |
| Negative SEO Impact | Broken or slow dashboards can lower your search rankings. |
Regular updates keep your dashboard running smoothly and protect your customer data. They also help you keep up with new reporting needs and improve satisfaction.
Real-World Results: Sobot Customer Story
OPPO’s Dashboard Transformation
You can see how a well-designed dashboard changes customer support by looking at OPPO’s journey. OPPO wanted to handle more customer questions, especially during busy shopping times. They chose Sobot to help them build a dashboard that brings all customer channels together. This dashboard lets OPPO’s team see every customer message, whether it comes from chat, phone, or social media. You get a clear view of each conversation and can respond faster.
Sobot’s unified solution helped OPPO connect all their communication methods. The dashboard made it easy to track customer needs and agent performance. OPPO reached a customer satisfaction score of 93% in conversational support. This shows how a strong dashboard can boost satisfaction and make your team more effective.
Key Outcomes and Lessons Learned
When you use a dashboard like OPPO, you see real results. OPPO’s team solved 83% of customer issues on the first try. Customers gave a 94% positive rating after their support sessions. These numbers show that a dashboard helps you answer questions quickly and keep customers happy.
Here are some key outcomes from OPPO’s experience:
- 83% resolution rate for customer questions
- 94% positive sentiment from users
- $1.3 million saved each year in support costs
You can learn important lessons from OPPO’s story. A dashboard that brings all data together helps you spot trends and improve service. When you track customer feedback and satisfaction, you find ways to make your support even better. Sobot’s dashboard gave OPPO the tools to grow and keep customers coming back.
Note: A unified dashboard helps you manage customer data, improve satisfaction, and save money. You can use these lessons to build your own success story.
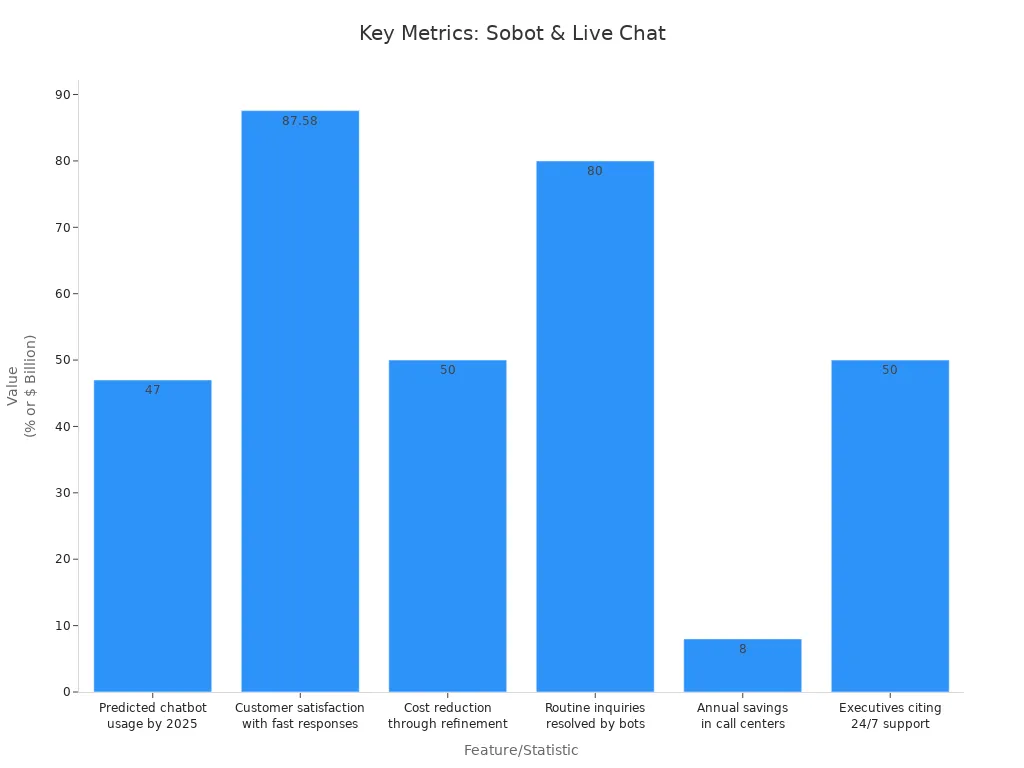
You can transform your support team with a modern dashboard. Real-time analytics help you respond fast and improve customer satisfaction. AI tools boost your team’s speed and uncover new insights. Personalized engagement builds trust with every customer. Sobot and Live Chat give you future-ready support, with features like 24/7 help and up to 50% cost savings.
| Feature/Statistic | Value/Description |
|---|---|
| Customer satisfaction with fast responses | 87.58% satisfaction reported by Sobot |
| Routine inquiries resolved without human help | 80% handled by bots |
| Annual savings in call centers | $8 billion saved through automation |
To get started, choose a dashboard that fits your needs, connect your data, and train your team. Review and update your metrics often. You can explore Sobot’s solutions to see how easy it is to improve customer satisfaction and grow your business.
FAQ
What is a customer service dashboard?
A customer service dashboard shows you real-time data from all your support channels. You can track key metrics, see team performance, and spot trends. This tool helps you improve customer satisfaction and make better decisions every day.
How does Sobot Live Chat enhance my customer service dashboard?
Sobot Live Chat brings all your conversations into one place. You get built-in analytics, AI-powered tools, and omnichannel support. These features help you boost efficiency and personalize every customer interaction on your customer service dashboard.
Can I customize my customer service dashboard with Sobot?
Yes, you can customize your customer service dashboard with Sobot. You choose which metrics to display, set up alerts, and design views for different roles. This flexibility lets you focus on what matters most for your team.
Why is omnichannel integration important for a customer service dashboard?
Omnichannel integration lets you see every customer interaction in one dashboard. You track messages from websites, apps, and social media together. This unified view helps you respond faster and deliver a seamless customer experience.
How often should I update my customer service dashboard?
You should review and update your customer service dashboard regularly. Frequent updates keep your data accurate and your dashboard useful. This practice helps you spot new trends and improve your support strategy.
See Also
The Ultimate Guide to Customer Service Tools for 2024
Transforming Customer Support with AI-Powered Agents
Essential Techniques for Effective Live Chat Support