Customer Experience Management KPIs What They Are and Why Use Them
Customer experience management KPI refers to specific metrics that track how well a business meets customer needs and expectations. These KPIs, such as Customer Effort Score and Net Promoter Score, help companies understand and improve service quality. Studies show that companies focusing on customer experience see up to 80% higher revenue and 60% more profit than competitors. Sobot leads the way by offering omnichannel analytics and Sobot AI tools, making it easier for businesses to measure and enhance every customer interaction. Tracking the right customer experience management KPI can boost retention, increase loyalty, and drive strong business growth.
Customer Experience Management KPI Basics
What Is a Customer Experience Management KPI
A customer experience management KPI is a measurable value that shows how well a business delivers on customer expectations. These key performance indicators help companies track and improve the quality of every interaction. Businesses use customer experience management kpi to understand what customers think and feel at different touchpoints.
The most common customer experience management kpi includes Net Promoter Score (NPS), Customer Satisfaction (CSAT), and Customer Effort Score (CES). Each one measures a different aspect of the customer journey. The table below highlights some of the most widely used customer experience KPIs across industries:
| KPI Name | Description | Usage Context and Importance |
|---|---|---|
| Net Promoter Score (NPS) | Measures customer loyalty by asking likelihood to recommend a brand. | Used globally; predicts loyalty and revenue; guides target setting and bonuses. |
| Customer Satisfaction (CSAT) | Measures satisfaction at specific touchpoints. | Gauges immediate satisfaction; quick for customers to answer; fits many needs. |
| Customer Effort Score (CES) | Assesses ease of customer interactions. | Linked to loyalty and churn reduction; identifies friction points. |
| Churn Rate | Percentage of customers lost over a period. | Reflects loyalty and business impact; critical for retention strategies. |
| Retention Rate | Measures how many customers remain over time. | Indicates loyalty; higher retention means more repurchase and referrals. |
| Customer Lifetime Value (CLV) | Predicts net profit from future customer relationship. | Helps forecast long-term value; important for planning. |
Why Customer Experience KPIs Matter
Customer experience management kpi plays a vital role in business success. Companies use these metrics to monitor satisfaction, loyalty, and operational efficiency. Tracking customer experience KPIs helps businesses spot problems, make improvements, and measure the results.
Companies that track customer experience management kpi see measurable gains in satisfaction and loyalty. For example, CSAT and CES scores reveal pain points, while NPS highlights promoters and detractors. Churn and retention rates show if customers stay or leave, guiding retention strategies.
Businesses often group customer experience management kpi into three categories:
- Customer Acquisition KPIs: Metrics like Customer Acquisition Cost and Conversion Rates show how well a company attracts new customers.
- Customer Engagement KPIs: Scores such as CSAT and CES, along with resolution times, measure how customers interact with the brand.
- Customer Retention KPIs: Metrics like Retention Rate, NPS, and Churn Rate track loyalty and long-term relationships.
By using these key performance indicators, companies can make data-driven decisions, improve customer experience, and drive growth.
Key Customer Experience KPIs
Net Promoter Score (NPS)
Net Promoter Score (NPS) measures how likely customers are to recommend a business to others. Companies use NPS to gauge loyalty and predict growth. NPS divides customers into three groups: promoters, passives, and detractors. Promoters are loyal and likely to refer others. Detractors may leave negative feedback or switch to competitors.
NPS benchmarks vary by industry. The table below shows typical NPS ranges for customer service and ecommerce sectors:
| Sector | Typical NPS Range | Benchmark Level |
|---|---|---|
| Ecommerce Brands | 40 - 55 | Average; leaders exceed 70 |
| Retail Industry | ~45 | Average; top brands reach 70+ |
| Technology & Services | ~66 | Strong customer loyalty |
| Consumer Industries | 50+ | 60-70 excellent; 70+ world-class |
Top ecommerce performers, such as Chewy and Zappos, score above 70 due to strong customer-centric policies. In 2025, the average NPS for ecommerce reached 59, up from 50 in 2023. Technology and services sectors average 66, reflecting a focus on customer experience.
A 7% increase in NPS correlates with about 1% revenue growth. Promoters are 50% more likely to make repeat purchases. Loyal customers spend up to 67% more than new customers. Addressing detractors can improve retention by up to 12%. Promoters also drive organic growth through referrals, lowering acquisition costs.
NPS, introduced by Frederick F. Reichheld, links customer recommendations to repeat purchases and company growth. High NPS signals a loyal customer base, which supports increased revenue and retention.
Customer Satisfaction (CSAT)
Customer Satisfaction (CSAT) measures how happy customers feel after an interaction or purchase. Companies often ask customers to rate their experience on a scale, then calculate the customer satisfaction score as a percentage of positive responses.
The table below shows average CSAT scores for leading ecommerce and retail companies:
| Source | Year | Industry | Average CSAT Score |
|---|---|---|---|
| Fullview | 2023 | E-commerce | 80 |
| Retently | 2025 | Ecommerce & Retail | 82 |
High CSAT scores, especially above 85%, indicate exceptional service and strong loyalty. Consistent tracking helps businesses spot strengths and weaknesses early. Lower scores signal problems that can harm retention and reduce repeat buying.
- High CSAT scores (above 85%) link to increased loyalty and higher customer lifetime value.
- Tracking CSAT helps identify areas for improvement, reducing churn.
- Low CSAT scores can decrease repeat purchases.
- Using CSAT data allows marketers to improve satisfaction and boost repeat purchase rates.
Improvements in CSAT scores lead to more repeat purchases by fostering loyalty and reducing churn.
Customer Effort Score (CES)
Customer Effort Score (CES) measures how easy it is for customers to get help or complete a task. Companies ask customers to rate the effort needed to resolve their issue. Lower effort means a better experience.
Gartner research shows that easy, low-effort experiences increase loyalty. High-effort experiences decrease it. Reducing customer effort leads to higher CES, which correlates with higher NPS and customer satisfaction. Customers who find it easy to get help are more likely to stay loyal and recommend the brand.
Support leaders focus on reducing customer effort to drive business growth. Building online communities and streamlining support processes help lower effort and improve advocacy.
Customer Effort Score is a strong predictor of loyalty. Lowering effort reduces churn and increases happiness.
First Contact Resolution
First Contact Resolution (FCR) tracks the percentage of customer inquiries resolved during the first interaction. High FCR means customers get answers quickly, without needing to follow up.
Industry data shows that a good FCR rate falls between 70% and 79%. High-performing teams, called "world-class," achieve rates of 80% or higher. In retail and non-profit sectors, FCR can reach up to 88%. Complex sectors like tech support average between 61% and 79%.
- Improving FCR leads to quicker, more effective issue resolution.
- Higher FCR reduces operational costs and increases efficiency.
- Customers are more satisfied when problems are solved promptly.
- Faster resolution frees agents to focus on other tasks, such as sales.
- Strong FCR impresses customers, turning dissatisfied ones into loyal advocates.
Balancing FCR with quality ensures true customer satisfaction.
Response and Resolution Time
Response and resolution time measure how quickly a company replies to and resolves customer inquiries. Fast response and resolution times are critical for a positive customer experience.
| Channel | Industry Standard Response Time | Customer Expectation / Notes |
|---|---|---|
| Live Chat | Under 30 seconds average response time | Customers expect responses within seconds |
| Phone Support | 80% of calls answered within 20 seconds; avg wait ~46 seconds | Acceptable wait time under 2 minutes |
| Social Media | Facebook: ≤15 minutes; Twitter: ~30-35 minutes | 78% expect response within 1 hour |
| SMS/Texting | 80% of messages responded to within 20 seconds | Best practice is under 1 minute |
Agent efficiency metrics include average handle time and case escalation rate. Shorter handle times and fewer escalations improve efficiency but must not sacrifice quality.
Faster first response time leads to higher customer satisfaction. Customers appreciate quick acknowledgment, which reduces frustration. Reducing average resolution time enhances efficiency and satisfaction, fostering loyalty and a positive brand image. These improvements increase retention and the likelihood of customers recommending the business, boosting NPS.
Customers who face unresolved or slow-resolved issues are more likely to churn. Monitoring support interactions and satisfaction scores helps identify at-risk customers. Faster response and resolution times reduce frustration, improve satisfaction, and support higher retention and NPS.
Improve Customer Experience with Sobot
Omnichannel Analytics
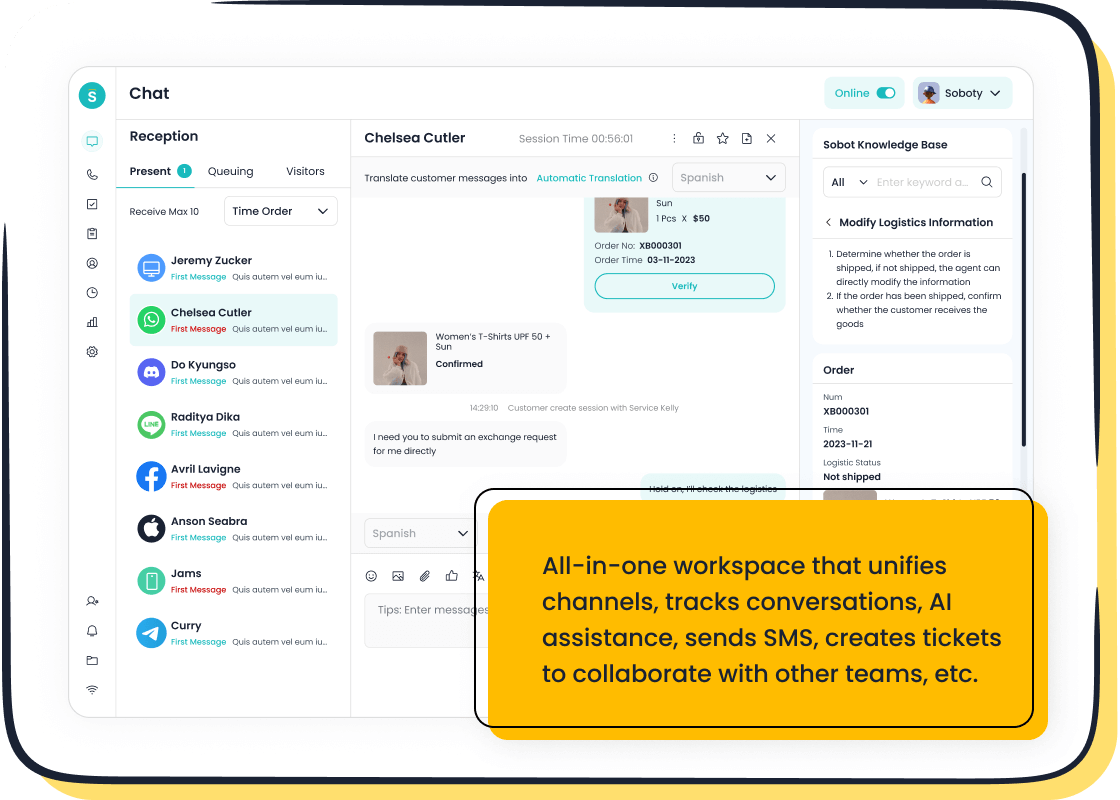
Sobot empowers businesses to improve customer experience by providing advanced omnichannel analytics. The platform unifies data from every channel, giving companies a complete view of each customer journey. Teams can track key metrics such as average handling time, first contact resolution, and sentiment trends. Supervisors use live monitoring tools to coach agents in real time or step in when needed, which boosts agent effectiveness.
- Companies using Sobot's analytics have seen up to a 45% reduction in escalation rates.
- Upsell performance has increased by 30% for many users.
- Integration with CRM and ticketing systems allows for better root-cause analysis and operational efficiency.
- AI-powered transcription and sentiment detection help spot risks and opportunities quickly.
These features enable businesses to identify pain points and improve customer experience across all touchpoints.

AI and Automation in Live Chat
Sobot Live Chat uses AI and automation to streamline support and improve customer experience. The platform handles routine inquiries with AI-powered chatbots, freeing agents to focus on complex issues. Businesses report faster ticket resolution, lower costs, and higher productivity.
| Customer Experience Metric | Reported Change with Sobot AI and Automation |
|---|---|
| Ticket Resolution Speed | 52% faster resolution |
| Customer Service Costs | 30% reduction |
| Productivity Increase | Up to 400% boost |
| Support Availability | 24/7 support enabled |
| First Response Time | Significantly faster |
| Customer Satisfaction (CSAT) | Enhanced scores |
| Resolution Rate | Increased through automation |
| Escalation Rate to Human Agents | Lowered |
Sobot’s AI-driven approach ensures customers receive quick, accurate answers, which helps improve customer experience and satisfaction.
Real-World Results
Many leading brands trust Sobot to improve customer experience. For example, Agilent, a global leader in life sciences, used Sobot’s omnichannel workbench and AI chatbot to achieve a sixfold increase in service efficiency and a 25% reduction in costs. Their customer satisfaction score reached 95%. In the ecommerce and retail sector, Sobot’s solutions have helped businesses increase conversion rates by up to 45% and retention rates by 2.5 times. Sobot’s analytics and omnichannel solutions stand alongside top industry competitors, offering predictive analytics, seamless messaging, and proactive support.
Sobot enables companies to improve customer experience, drive loyalty, and achieve measurable business growth.
Customer Experience KPIs in Retail and Ecommerce
Personalization and Engagement
Retail and ecommerce businesses rely on personalization to create memorable shopping experiences. AI and machine learning help brands tailor product recommendations, marketing messages, and customer interactions to individual preferences. This approach increases engagement and satisfaction. When customers receive personalized offers, they feel valued and are more likely to return.
- Personalization improves customer engagement by making each interaction relevant.
- Brands that use AI-driven personalization see higher conversion rates and average order values.
- Omnichannel experiences, proactive support, and loyalty programs encourage customers to stay loyal.
- Follow-up emails and feedback requests help maintain positive relationships after a purchase.
Surveys show that most consumers want personalized experiences, even if only a few brands deliver them well. Nearly 90% of business leaders believe personalization will be key to success in the coming years. Ecommerce platforms that use AI-powered tools and flexible payment options create smooth shopping journeys, boosting both engagement and conversion.
Conversion and Retention
Conversion rate and customer retention rate are two of the most important KPIs for retail and ecommerce. Conversion rate measures how many visitors become buyers. A high conversion rate means the business removes friction and delivers value. Customer retention rate shows how many customers keep coming back, which is vital for long-term growth.
| KPI | Business Tie | Why It Matters | How to Measure | How to Act on Insights |
|---|---|---|---|---|
| Conversion Rate | Sales growth, marketing ROI | Shows how well visitors turn into buyers, reflecting value and ease. | "Did you find what you needed?" "Was checkout easy?" | Fix friction points; streamline checkout. |
| Retention Rate | Lifetime value, churn reduction | Reflects loyalty and repeat business, key for growth. | "Have you shopped with us before?" | Address annoyances; target retention campaigns. |
| Customer Churn | Lost revenue, loyalty issues | Tracks how many customers stop buying, signaling problems. | Track repeat visits and feedback. | Use insights to improve service and reduce churn. |
Customer satisfaction score, net promoter score, and customer effort score also play a role. High scores in these areas mean customers are happy, loyal, and less likely to churn. By tracking these KPIs, businesses can spot issues early and take action to improve customer experience.
Future of Customer Experience Management KPIs
Trends and Innovations
The future of customer experience management KPIs shows rapid change. Companies now focus on omnichannel commerce, connecting every sales and marketing channel. This approach creates a seamless journey for customers and leads to higher spending and better engagement. Personalization stands out as another key trend. Unified customer data platforms help brands tailor experiences, which increases loyalty and boosts revenue. For example, businesses using personalization see up to 39% more items ordered.
Emerging technologies also shape the landscape. Virtual reality (VR), augmented reality (AR), and social selling are becoming more common. These tools help brands meet new customer expectations. Fast website performance matters, too. Sites that load in under three seconds see much higher conversion rates. Real-world examples include Target, which increased revenue by 10% with an omnichannel strategy, and Walmart, which improved conversions by speeding up its website.
| Trend / Feature | Description | Impact on KPIs |
|---|---|---|
| Comprehensive customer data | Collects data from all channels, not just surveys | Improves satisfaction and loyalty measurement |
| Role-based insights | Gives employees data for their specific roles | Increases accountability and targeted action |
| AI-embedded workflows | Uses AI for real-time actions and insights | Boosts efficiency and speeds up KPI improvement |
| Enterprise-level scalability | Scales platforms globally | Supports consistent customer experience |
| Unified experience insights | Combines customer, digital, and employee data | Builds trust and increases lifetime value |
Continuous Improvement
Continuous improvement remains vital for strong customer experience management. Companies use AI and automation to refine KPIs and processes. AI-driven tools analyze customer feedback, predict behavior, and automate routine tasks. This approach helps teams respond faster and focus on complex problems. For example, AI can track customer satisfaction, net promoter score, and customer effort score in real time.
Businesses also use predictive analytics to spot trends and prevent customer churn. AI-powered sentiment analysis gives deeper insights into customer needs. These innovations allow companies to act quickly and improve service quality. As a result, KPIs become dynamic tools that guide strategy and create value.
Tip: Companies that embrace new technologies and review their KPIs regularly stay ahead in customer experience and reduce customer churn.
Understanding and tracking the right KPIs drives business growth and loyalty. The table below shows how key metrics like Net Promoter Score, Customer Satisfaction Score, and First Contact Resolution support long-term success:
| KPI Metric | Business Impact |
|---|---|
| Net Promoter Score (NPS) | Indicates loyalty and predicts growth |
| CSAT | Reveals satisfaction and improvement areas |
| First Contact Resolution | Reflects efficient support and satisfaction |
Sobot’s advanced solutions help companies achieve results such as a 234% ROI and a 35% boost in NPS. Companies should review their current KPIs and explore Sobot’s platform to stay ahead.
Discover how Sobot can transform your operations—request a demo today.
FAQ
What are customer experience management KPIs?
Customer experience management KPIs are metrics that help businesses measure how well they meet customer needs. These indicators track satisfaction, loyalty, and service quality. Companies use them to improve support and drive growth.
How does Sobot help track customer experience KPIs?
Sobot provides advanced analytics and real-time dashboards. Teams can monitor key metrics like NPS, CSAT, and response times. The platform unifies data from all channels, making it easy to spot trends and improve service.
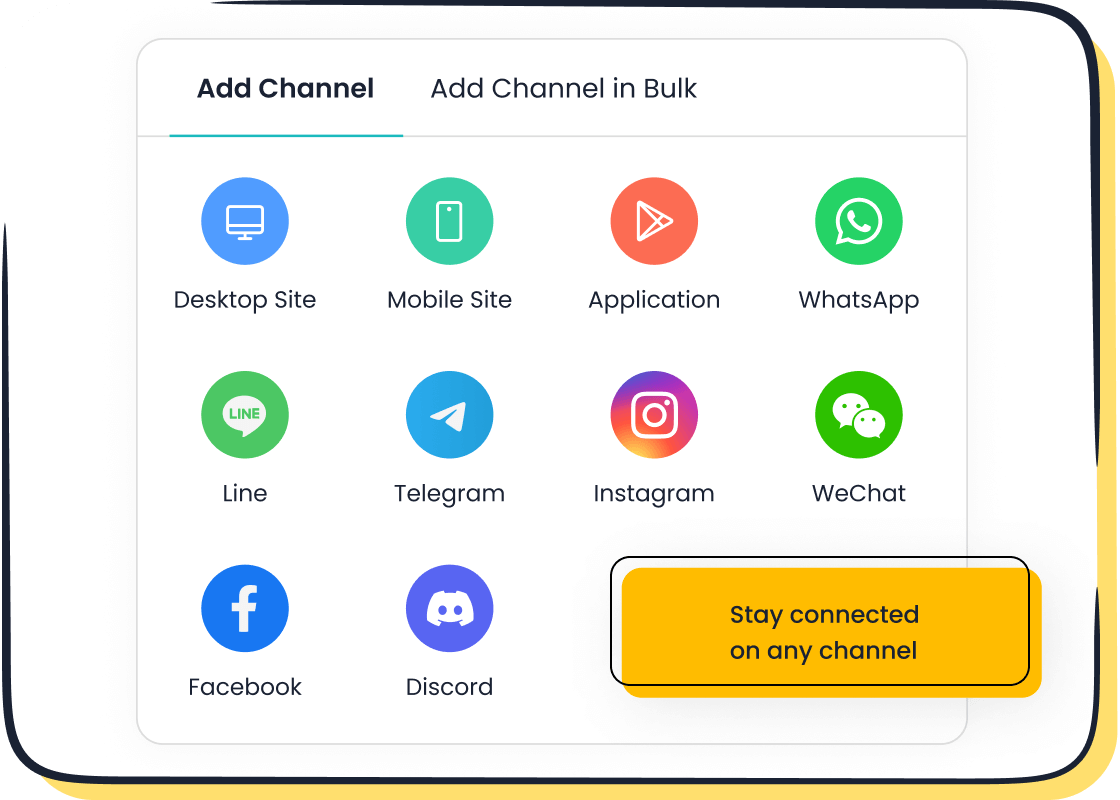
Why do retail and ecommerce companies need omnichannel solutions?
Omnichannel solutions let companies connect with customers on any platform. This approach ensures consistent service and faster responses. Retailers use these tools to boost engagement, increase sales, and build loyalty.
Can Sobot Live Chat improve customer satisfaction?
Yes. Sobot Live Chat uses AI to answer questions quickly and accurately. Agents handle complex issues while chatbots manage routine tasks. This setup leads to faster resolutions and higher satisfaction scores.
What results have Sobot clients achieved?
Many Sobot clients report higher efficiency, lower costs, and improved customer satisfaction. For example, Agilent saw a sixfold increase in service efficiency and a 95% customer satisfaction score after using Sobot’s solutions.
See Also
Effective Strategies For Managing Call Center Quality
Comprehensive Overview Of Call Center Quality Systems
Top Ten Ways To Improve Live Chat Experience
Enhancing Call Center Results Through Performance Tracking
Essential Insights Into Quality Assurance Tools For Call Centers
