Top Customer Engagement Planning Wins from Real Companies
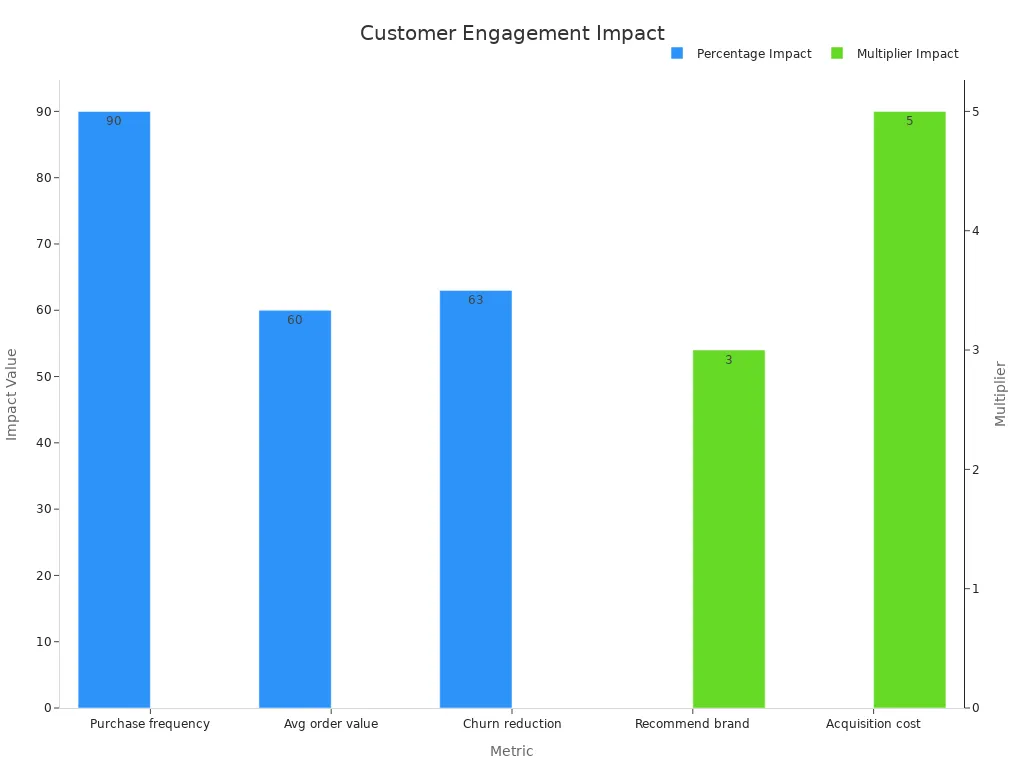
Effective customer engagement planning drives real business growth. Customer engagement means building meaningful interactions with customers at every touchpoint. Companies that focus on customer engagement planning see impressive results. Harvard Business Review found that customers with the best experiences spend 140% more than those with poor experiences. Engaged customers buy 90% more often and spend 60% more per order.
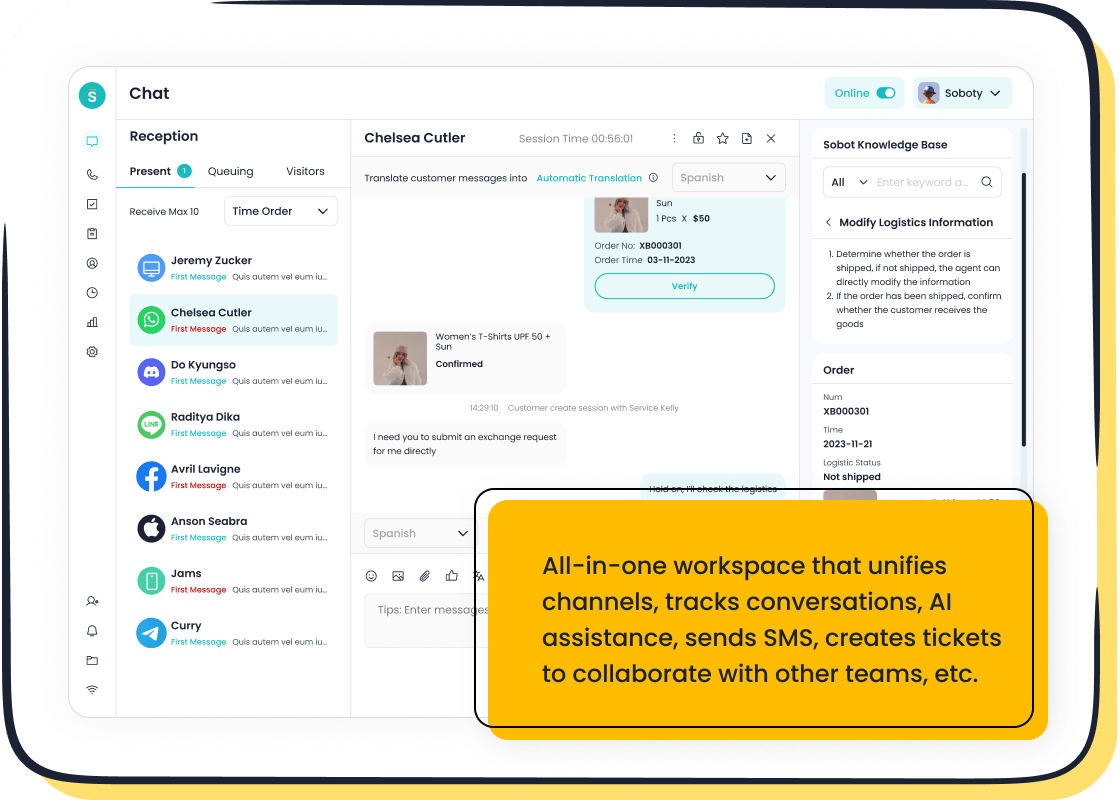
Sobot and Sobot AI help brands achieve these outcomes through advanced omnichannel solutions. Real-world examples show that customer engagement planning reduces churn, boosts revenue, and increases loyalty. Companies using proven customer engagement examples gain a clear advantage in today’s market.
Customer Engagement Planning Basics
What Is Customer Engagement?
Customer engagement describes the ongoing interactions between a business and its customers across every stage of the customer journey. These interactions can happen through many channels, such as websites, apps, social media, or in-person visits. Customer engagement planning means creating a clear roadmap for how a company will connect with customers, from onboarding to activation and beyond. A strong customer engagement strategy includes steps like building an onboarding checklist, tracking activation, and measuring satisfaction.
Companies use several metrics to measure customer engagement and activation. The table below shows some of the most common benchmarks:
| Metric Name | Definition | Measurement Methodology | Business Relevance |
|---|---|---|---|
| Net Promoter Score (NPS) | Measures customer loyalty and likelihood to recommend a product or service. | Survey score from 0-10; groups customers into Promoters, Passives, Detractors. | Indicates loyalty and potential for growth. |
| Customer Satisfaction Score (CSAT) | Measures satisfaction with a brand or product. | Average satisfaction rating from surveys. | Predicts loyalty and revenue growth. |
| Customer Effort Score (CES) | Measures ease of customer interaction. | Survey rating on ease of interaction. | Identifies friction points in the customer journey. |
| Activation Rate | Percentage of users who reach their first value moment. | (Number of users activated / Total users) × 100 | Shows early engagement and sets the tone for the relationship. |
| Churn Rate | Percentage of customers who stop using a service. | (Customers lost during period / Total customers at start) × 100 | Measures disengagement and risk. |
| Conversion Rate | Percentage of visitors completing a desired action. | (Conversions / Total visitors) × 100 | Shows effectiveness of the engagement strategy. |
Tip: Using an onboarding checklist helps teams guide new users through activation, making the customer journey smoother and more successful.
Why It Matters
Customer engagement planning shapes the entire customer experience. Companies that invest in a clear engagement strategy see higher satisfaction, loyalty, and profits. For example, increasing customer retention by just 5% can boost profits by up to 95% (Bain & Company). Loyal customers buy more and recommend brands to others. In fact, 70% of loyal customers will recommend a company, and 88% say good service makes them more likely to buy again.
A well-designed onboarding checklist and activation process help customers reach value quickly. This reduces churn and increases the chance of long-term engagement. Sobot’s solutions, such as omnichannel live chat and automated onboarding tools, support businesses in building a seamless customer journey. By focusing on activation and customer onboarding, companies can create a strong foundation for every engagement strategy.
Customer engagement planning is not a one-time task. Teams must review onboarding checklists, track activation, and adjust their engagement strategy as customer needs change. This ongoing process leads to better outcomes for both customers and businesses.
Sobot & Michael Kors: Omnichannel Success
Unified Channels
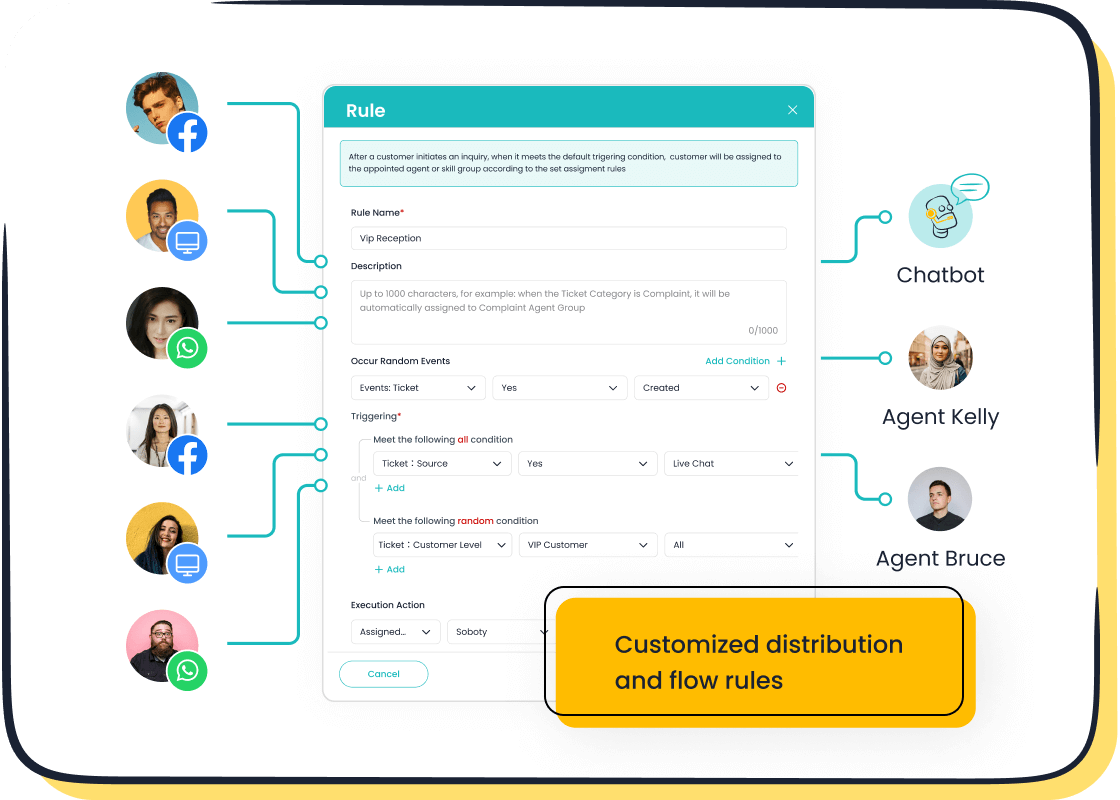
Michael Kors, a global luxury fashion brand, transformed its customer engagement strategies by partnering with Sobot. The company unified all customer communication channels—including phone, live chat, and social media—into a single, integrated platform. This approach eliminated information silos and allowed agents to access customer data instantly. By integrating Sobot’s omnichannel solution, Michael Kors improved team productivity by up to 25%. AI-powered routing reduced message delays by 40%, ensuring that critical updates reached customers quickly. The unified workspace also enabled agents to deliver personalized service, which is a key driver of user engagement and loyalty.
Companies that implement unified communication platforms often see a 21% increase in profitability and a 20% boost in sales team revenue. These results highlight the value of seamless customer engagement examples in real-world business scenarios.
Live Chat Impact
Sobot Live Chat played a central role in enhancing user engagement for Michael Kors. The platform allowed agents to respond to customer inquiries in real time across multiple channels, including WhatsApp and the company website. Fast response times proved essential—industry benchmarks show that customer satisfaction rates exceed 84% when live chat responses occur within 5 to 10 seconds. Michael Kors leveraged Sobot’s AI-assisted tools to route chats efficiently, enabling agents to handle several conversations at once. This not only improved operational efficiency but also increased customer satisfaction. Customers preferred live chat for its speed and convenience, with 42% choosing it over phone support to avoid hold times.
- 87% of live chat interactions received positive satisfaction ratings.
- 60% of customers were more likely to return to a website offering live chat.
- Businesses using live chat reported a 20% increase in website conversion rates.
These insights demonstrate how live chat solutions drive both immediate and long-term improvements in customer engagement.
Measurable Results
The collaboration between Sobot and Michael Kors produced clear, measurable outcomes. The table below summarizes the key performance metrics achieved after implementing Sobot’s omnichannel solution:
| Metric | Outcome |
|---|---|
| Net Promoter Score (NPS) Improvement | 35% increase |
| Agent Workload Reduction | 60% decrease |
| Conversion Rate Increase | 15% increase |
| Resolution Time | Under 1 minute |
These results reflect the effectiveness of Sobot’s customer engagement strategies. Michael Kors saw a 35% improvement in NPS, indicating higher customer satisfaction and loyalty. Agent workload dropped by 60%, freeing up resources for more complex tasks. The company also achieved a 15% increase in conversion, directly impacting revenue growth. Fast resolution times—often under one minute—helped build trust and encouraged repeat business.
Insights from this partnership show that omnichannel integration and real-time support can transform customer engagement. Michael Kors’ experience stands as one of the most compelling customer engagement examples in the retail industry.
Starbucks: Rewards and Personalization

Loyalty Program
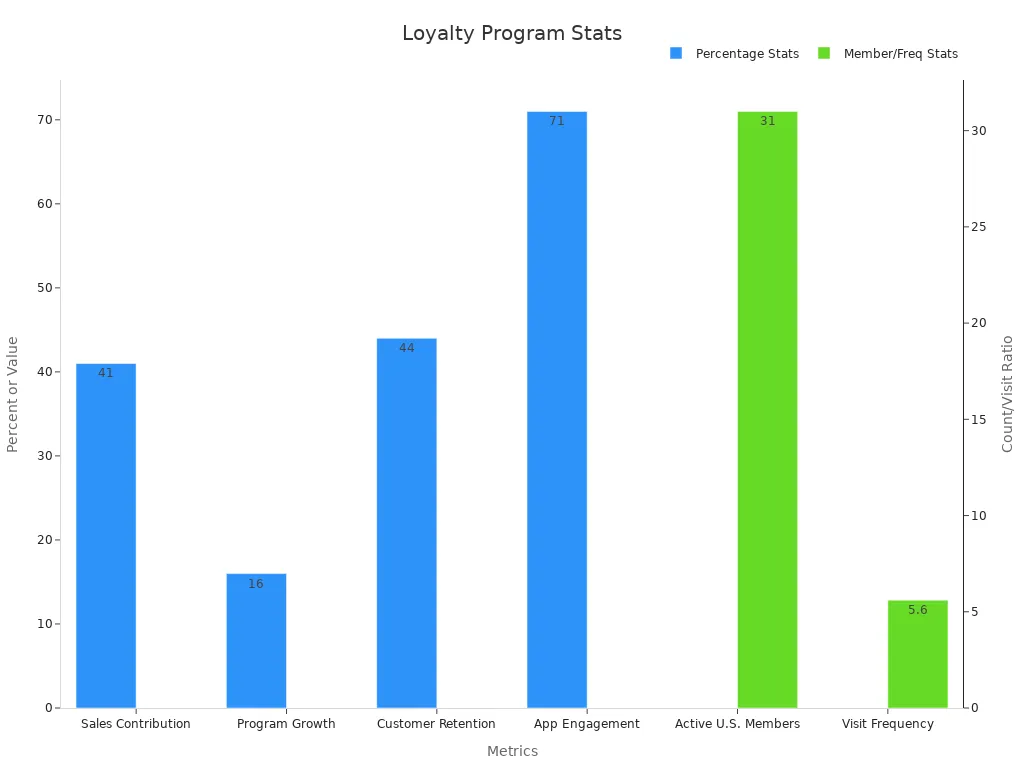
Starbucks stands out as a leader in customer loyalty programs. The Starbucks Rewards program has over 31 million active members in the United States and more than 75 million globally. These members drive significant business results, contributing between 41% and 57% of U.S. sales. Starbucks uses a tiered rewards structure, with Green and Gold levels, to encourage frequent visits and higher spending. Members earn stars for every purchase, which they can redeem for free drinks and food. This system motivates customers to return often and increases their average spend per visit.
The program’s impact goes beyond just numbers. Starbucks achieves a customer retention rate of 44%, nearly double the industry average of 25%. Members are 5.6 times more likely to visit daily, and 21% return within three days of a purchase. The mobile app plays a key role, with 71% of users visiting at least once a week and mobile orders making up 26% of U.S. transactions.
| Statistic/Insight | Description |
|---|---|
| Active Members (U.S.) | Over 31 million |
| Global Active Members | 75 million+ |
| Sales Contribution | 41%–57% of U.S. revenue |
| Retention Rate | 44% (industry average: 25%) |
| Visit Frequency | 5.6x more likely to visit daily |
| App Engagement | 71% of users visit weekly |
| Rewards Structure | Green and Gold tiers incentivize frequent visits and spending |
Starbucks’ loyalty programs set a benchmark for customer engagement examples in the retail and food service industries.
Personalized Offers
Starbucks excels at delivering personalized experiences through its rewards program and mobile app. The company uses transaction data to tailor offers based on each customer’s purchase history and preferences. For example, a customer who orders oat milk receives dairy-free promotions. Push notifications and order-ahead features make the experience seamless and convenient.
Research from Epsilon shows that 80% of consumers prefer personalized experiences. Starbucks leverages this insight by sending targeted offers and gamified promotions like “Double Star Days.” These campaigns create urgency and boost engagement. Members respond to these incentives, leading to higher spending and more frequent visits.
Starbucks’ approach to personalized engagement demonstrates how loyalty programs can drive both customer satisfaction and business growth. Companies seeking to improve their own customer loyalty programs can learn from Starbucks’ use of data, technology, and rewards to foster lasting relationships.
Businesses like Sobot help brands build similar omnichannel loyalty programs and personalized engagement strategies, supporting seamless customer journeys across digital and in-person channels.
Zappos: Service-Driven Engagement
Customer-First Culture
Zappos has built its reputation on a customer-first culture. The company places customer needs at the center of every decision. Employees receive training to listen carefully and respond with empathy. Zappos collects and analyzes customer feedback regularly. This approach helps the company understand real needs and refine its services. The company also tailors communication based on customer preferences and anticipates needs before issues arise.
A customer-first mindset drives strong results across the service industry. The table below highlights industry metrics that show the impact of this approach:
| Metric / Example | Description | Impact on Service-Based Engagement |
|---|---|---|
| Net Promoter Score (NPS) - USAA | USAA's NPS is four times the average for banking, reflecting exceptional customer loyalty due to a customer-first approach. | Demonstrates strong customer loyalty and engagement driven by prioritizing customer needs. |
| Hilton ACSI Score | Hilton scored 80, tied for the best among hotels, due to personalized service and seamless offline-online experience. | Indicates high customer satisfaction and engagement through personalized, customer-centric service. |
| Buyer Willingness to Pay More | 86% of buyers are willing to pay more for a better customer experience. | Highlights the financial value of prioritizing customer experience in service industries. |
Zappos stands as one of the most recognized customer engagement examples in retail. The company’s focus on emotional connection and proactive service keeps customers loyal and engaged.
Companies that adopt a customer-first culture often see higher retention rates and stronger brand loyalty. Sobot helps brands build similar cultures by providing omnichannel tools for seamless, personalized engagement.
Empowered Teams
Zappos empowers its teams to deliver exceptional service. Employees have the authority to make decisions without waiting for manager approval. This autonomy allows agents to resolve issues quickly and creatively. For example, a Zappos representative once authorized a non-standard refund, which led to positive media coverage and increased customer loyalty.
Operational performance indicators show the value of empowered teams:
- First Call Resolution (FCR): Zappos invests in training so agents can solve problems on the first contact. Higher FCR rates lead to happier customers and lower costs.
- Customer Effort Score (CES): Empowered agents simplify processes, making it easier for customers to get help. Lower CES scores mean smoother experiences.
- Net Promoter Score (NPS) and CSAT: These satisfaction metrics improve when teams have the tools and authority to act.
- Average Resolution Time: Fast resolutions build trust and encourage repeat business.
Zappos also supports employee well-being through mindfulness workshops. These programs have led to a 20% increase in customer satisfaction scores. Over 90% of Zappos employees report high satisfaction, which translates into better service for customers. Companies like Sobot recognize the importance of empowered teams and offer solutions that give agents the data and tools they need to succeed.
Empowered teams drive higher customer satisfaction and loyalty. They stand as powerful customer engagement examples for businesses aiming to improve service quality.
Spotify: Data-Driven Experience
Personalized Playlists
Spotify leads the music streaming industry by using data analytics to create personalized playlists for its users. The company built a dedicated analytics engineering team to make data easy to use and reliable. This team helps Spotify deliver fast and accurate recommendations, which form the core of its user experience. Personalized playlists now account for over 30% of total listening time. More than 40 million users have discovered new music through these playlists, showing the power of data-driven recommendations.
Spotify uses advanced machine learning, such as collaborative filtering and natural language processing, to match songs with user preferences. These techniques increase user engagement by 60% and boost playlist interaction by 45%. Features like Spotify Wrapped generate over 1.5 billion social media impressions each year, helping users share their music journey and deepening their connection with the platform. Real-time data updates also drive a 20% increase in new artist streams, making the listening experience dynamic and fresh.
Personalization creates unique experiences that foster relevance and connection, encouraging users to return and explore more.
User Retention
Spotify’s focus on personalization directly impacts customer retention. The platform maintains high average session durations by curating playlists that fit each user’s taste. Social features, such as collaborative playlists, keep users engaged and encourage longer sessions. Metrics like Daily Active Users (DAU), Weekly Active Users (WAU), and Monthly Active Users (MAU) reflect this strong engagement.
| Retention Metric / Factor | Description / Role | Impact on User Retention / Satisfaction |
|---|---|---|
| Service Satisfaction (SS) | Overall user satisfaction with the streaming service | Most significant determinant of continuation intention (CI), directly linked to retention |
| Continuation Intention (CI) | User's intention to continue using the service | Key retention metric reflecting user loyalty and ongoing engagement |
| Perceived Usefulness (PU) | Degree to which the service enhances user experience and meets expectations | Positively influences SS, thereby improving retention |
| Expectation Confirmation (EC) | Degree to which user expectations are met or exceeded | Influences SS; high-quality information leads to better EC, reinforcing satisfaction and retention |
| Perceived Fair Pricing (PFP) | User perception of pricing fairness | Contributes to SS and EC, affecting retention by aligning pricing with user expectations |
| Information Quality (IQ) | Accuracy, relevance, and timeliness of content and metadata | Enhances PU and EC, leading to higher SS and retention |
| System Quality (SysQ) | Reliability, usability, and performance of the platform | Improves PU and SS, supporting continued use |
| Service Quality (SQ) | Includes customer support, account management, and personalized features (e.g., content personalization) | Enhances PU and SS; personalized content is part of SQ, indirectly supporting retention through improved satisfaction |
Spotify’s approach shows that personalized experiences and high-quality service drive satisfaction and loyalty. Personalized onboarding playlists increase completion rates by 41%, helping users start their journey with confidence. Companies like Sobot also use data-driven tools to support customer retention, offering omnichannel solutions that personalize every step of the customer journey.
Best Practices for Customer Engagement Strategies
Personalization
Personalization stands at the core of effective customer engagement strategies. Brands like Apple and Spotify use data to create tailored experiences, which drive higher user engagement and loyalty. Sobot’s platform enables businesses to deliver personalized onboarding and interactive walkthroughs, ensuring every customer feels valued from the start. Companies that use personalized product recommendations see up to an 8% increase in conversion rates. Hyper-personalization can improve conversion rates by 30% and deliver up to three times higher returns compared to generic promotions.
| Personalization Strategy | Numerical Impact | Description |
|---|---|---|
| Personalized Experiences | Up to 20% increase in conversions | Personalized experiences boost overall conversion rates significantly. |
| Hyper-Personalization | 30% improvement in conversion rates | Highly personalized interactions outperform generic ones by a large margin. |
| Tailored Customer Journeys | Up to 12% increase in Average Order Value (AOV) | Customizing the shopping journey encourages higher spending per order. |
Personalization starts with understanding the customer’s needs and guiding them through onboarding with interactive walkthroughs and targeted activation steps.
Omnichannel Approach
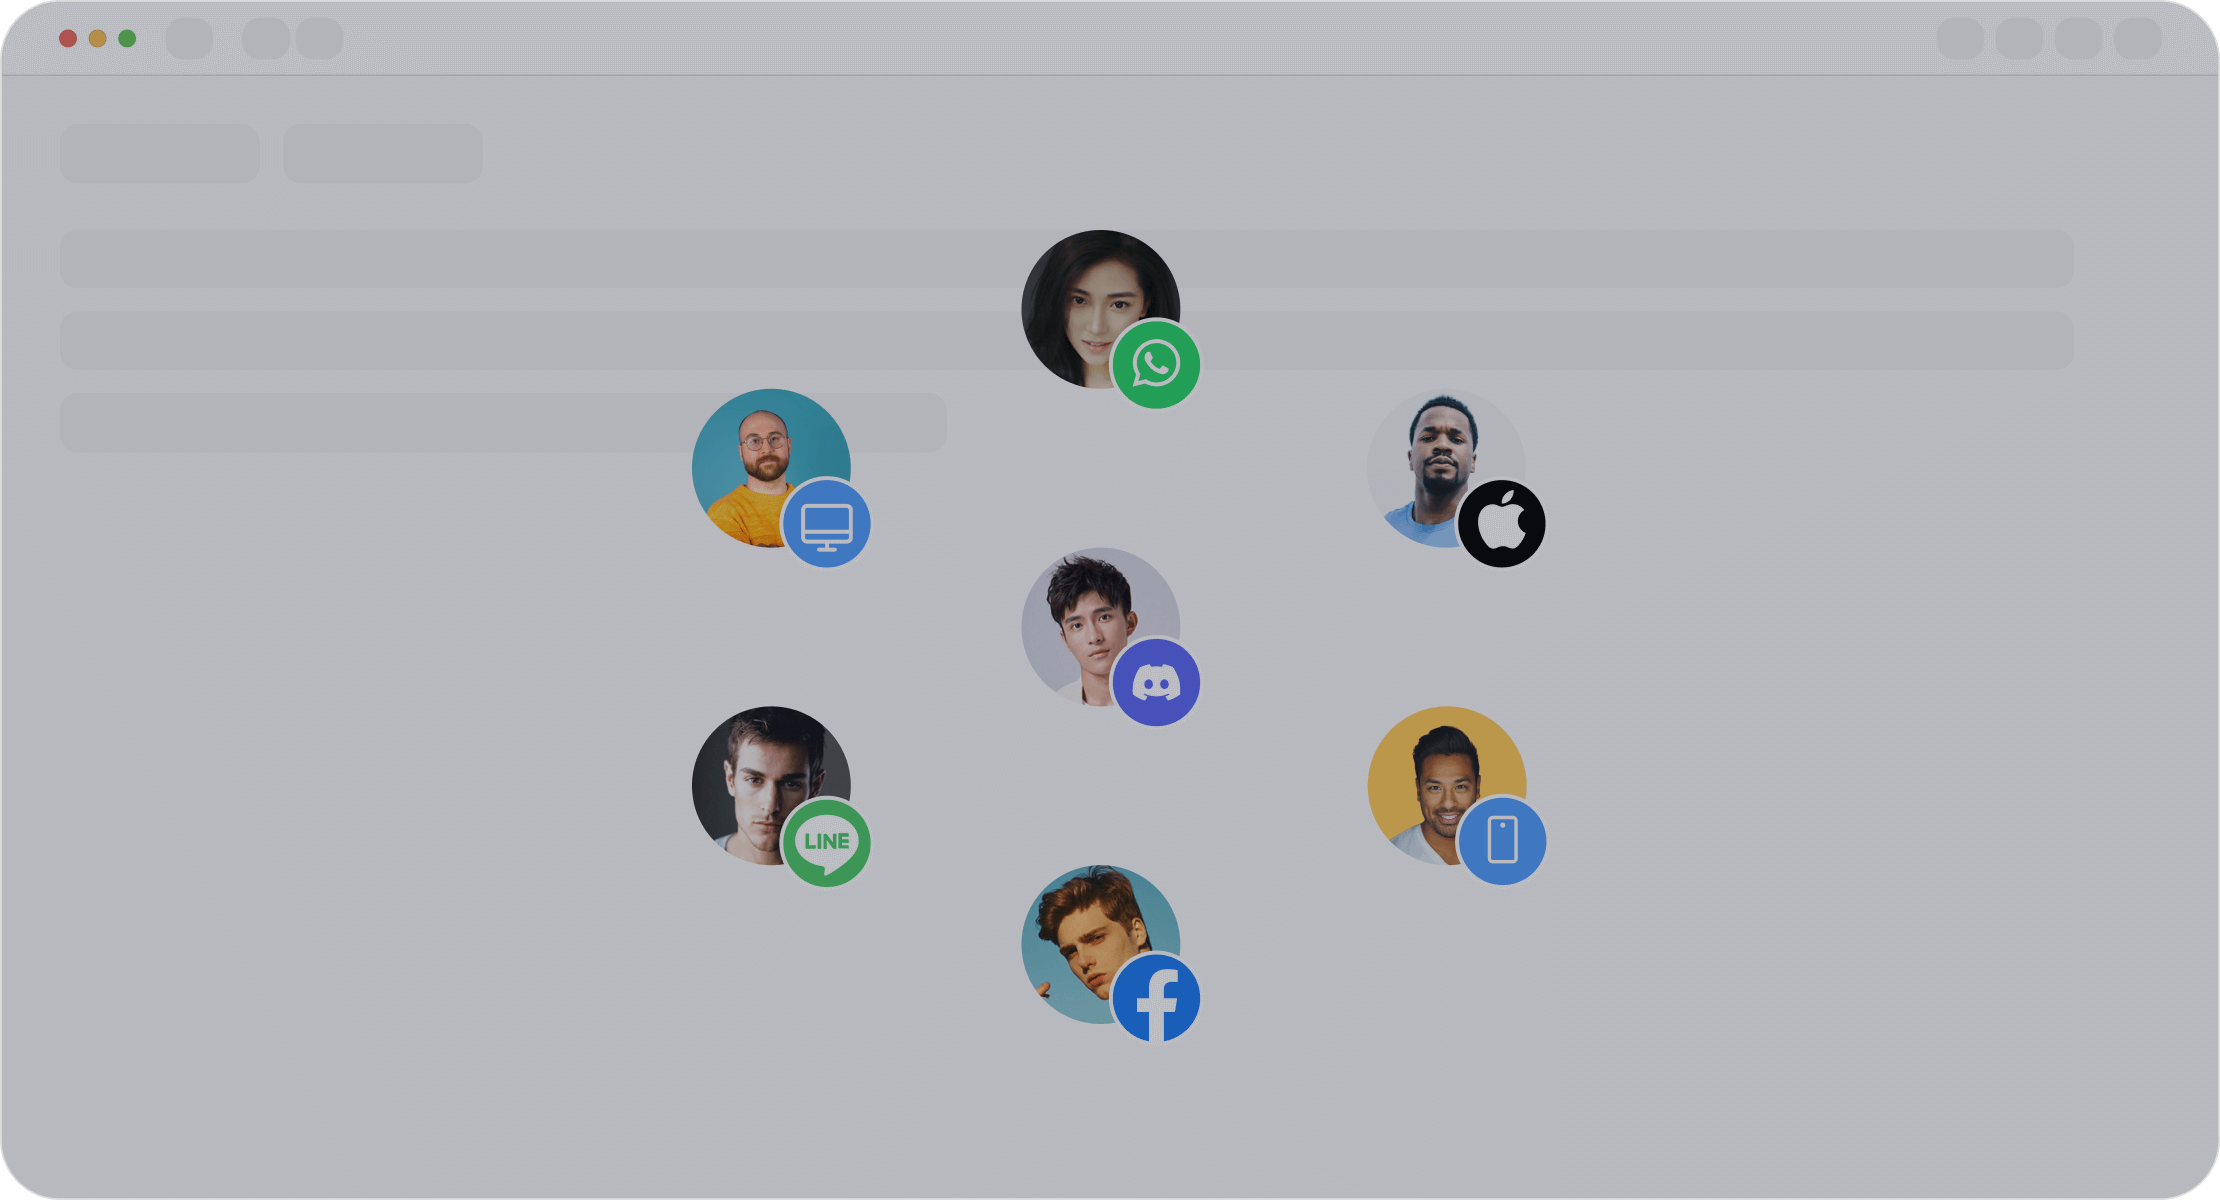
An omnichannel approach ensures that customers receive consistent communication and support across all platforms. Sobot’s omnichannel solutions unify channels like live chat, WhatsApp, and social media, making it easy for agents to track customer activation and deliver seamless walkthroughs. Companies using omnichannel engagement strategies achieve an 89% customer retention rate, compared to 33% for those without it. Engagement rates reach nearly 19% across channels, far surpassing single-channel approaches.
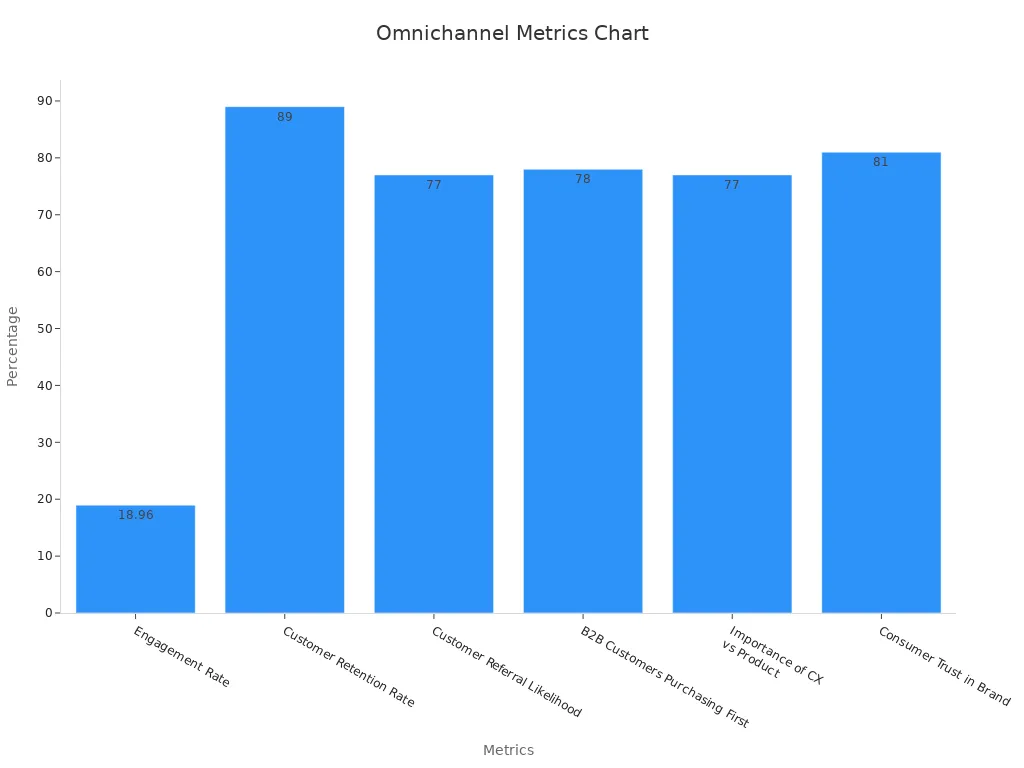
Omnichannel engagement strategies improve response times, increase customer trust, and drive higher user engagement.
Proactive Support
Proactive support helps reduce churn and keeps customers engaged. Sobot’s automated alerts and interactive walkthroughs identify users who need help during onboarding or activation. Companies that use proactive support strategies, such as in-app prompts and milestone check-ins, see up to a 20% increase in retention rates. For example, Groove retained 30% of at-risk users by sending proactive support emails. Regular customer feedback surveys and real-time insights help teams address issues before they escalate.
| Performance Indicator | Metrics / Measurement | Impact on Churn | Actionable Proactive Support Strategies |
|---|---|---|---|
| Activation Rate | % users reaching activation; time to activation | 40-60% of free trial users never return, predicting churn | Reminders for incomplete setups; in-app guided tours |
| Customer Feedback & Satisfaction | NPS, CSAT scores; % negative feedback | 10-point NPS drop increases churn by 10% | Use feedback to fix issues; follow up with dissatisfied users |
Proactive engagement through interactive walkthroughs and customer feedback surveys strengthens customer activation and loyalty.
Measuring Success
Measuring the impact of a customer engagement strategy requires clear metrics and regular review. Leading brands use frameworks that track onboarding completion, activation rates, user engagement, and customer feedback surveys. Sobot’s analytics dashboard provides real-time insights into customer journeys, helping teams refine their engagement strategy. Key metrics include Net Promoter Score (NPS), customer retention rate, and average session duration.
| Metric Name | Purpose / What it Measures | Measurement Method / Notes |
|---|---|---|
| Net Promoter Score (NPS) | Measures customer loyalty and likelihood to recommend the brand. | Customer surveys with rating scales (1-10) and open-ended questions. |
| Customer Retention Rate | Measures ability to keep customers over time. | Percentage of customers retained during a period. |
| Churn Rate | Percentage of customers lost over a period. | Monitored at various intervals to identify engagement gaps. |
| Customer Engagement Score | Tracks overall user engagement and activation. | Combines activity, onboarding, and walkthrough completion data. |
Continuous improvement relies on actionable insights from customer feedback surveys, onboarding analytics, and interactive walkthroughs.
Real-world data confirms that leading companies achieve measurable results by planning and optimizing customer engagement.
- Advanced analytics and real-world evidence guide business decisions and improve outcomes across industries.
- Programs like Wharton’s show that data-driven strategies increase customer lifetime value and support long-term growth.
Sobot’s omnichannel solutions help brands unify communication and deliver seamless experiences. Companies can apply these proven strategies to build loyalty and drive success.
Start your journey by exploring Sobot’s solutions or sharing your own customer engagement story.
FAQ
What is customer engagement planning, and why does it matter?
Customer engagement planning creates a roadmap for building strong relationships with customers. Companies using a clear customer engagement strategy see up to 89% higher retention rates. Effective planning leads to better customer experiences and increased revenue. Source: Harvard Business Review
Can you give real customer engagement examples that show measurable results?
Michael Kors unified channels with Sobot’s platform and saw a 35% increase in Net Promoter Score and a 15% rise in conversion rates. Starbucks’ loyalty program boosted retention to 44%. These customer engagement examples prove that strategy drives growth.
How does Sobot help improve customer engagement strategy?
Sobot provides omnichannel solutions like Live Chat and WhatsApp API. These tools unify communication, reduce response times by up to 83%, and increase customer satisfaction. Sobot’s analytics dashboard tracks key metrics for continuous improvement in customer engagement planning.
What metrics should companies track to measure customer engagement success?
Companies should monitor Net Promoter Score (NPS), customer satisfaction (CSAT), activation rate, and churn rate. Sobot’s platform offers built-in analytics to track these metrics, helping teams refine their customer engagement strategy and achieve better results.
Why is personalization important in customer engagement planning?
Personalization increases conversion rates by up to 30%. Brands like Spotify and Starbucks use data to tailor experiences. Sobot’s solutions enable personalized onboarding and targeted messaging, making every customer feel valued and improving overall engagement.
See Also
Best Voice of Customer Platforms To Use In 2024
Comparing The Leading Voice Of Customer Software Options
In-Depth Reviews Of Best Contact Center Solutions 2024
