CSAT vs NPS: Decoding Their Roles in Customer Success

Understanding what a CSAT score means and how it reflects customer satisfaction, along with how likely customers are to recommend your brand, can revolutionize your business. This is where CSAT and NPS become essential. While CSAT measures short-term satisfaction with specific interactions, NPS assesses long-term loyalty by determining how inclined customers are to refer your brand.
Both metrics are crucial for enhancing customer service. Here’s why:
- NPS offers valuable insights into brand trust, with surveys achieving up to a 30% response rate, significantly higher than standard surveys.
- CSAT provides immediate feedback, allowing you to pinpoint strengths and areas for improvement in your service.
With tools like Sobot’s innovative solutions, you can simplify these processes and ensure you consistently deliver outstanding customer experiences.
What Are CSAT and NPS?
What CSAT Score Means for Customer Satisfaction
CSAT, or Customer Satisfaction Score, measures how happy customers are with a specific interaction or service. It focuses on immediate satisfaction, making it a valuable tool for understanding short-term customer sentiment. High CSAT scores often indicate satisfied customers who are more likely to return, recommend your brand, and engage in repeat business.
Satisfied customers also contribute to positive word-of-mouth, which can attract new customers. On the other hand, low CSAT scores may signal dissatisfaction, which could lead to customer churn if not addressed promptly. By monitoring CSAT, you can identify areas for improvement and enhance the overall customer experience.
How CSAT Is Measured
CSAT is typically measured through surveys that ask customers to rate their satisfaction on a scale, such as 1 to 5 or 1 to 7. For example, a common question might be, "How satisfied were you with your recent experience?" The percentage of respondents who select the highest ratings (e.g., 4 or 5) represents your CSAT score.
| Metric | Measurement Scale | Good Score Benchmark | Use Cases |
|---|---|---|---|
| CSAT | 1 to 5 or 1 to 7 | Above 80% | Transactional feedback in retail, hospitality, etc. |
CSAT surveys are brief and easy to use, making them ideal for gathering customer feedback quickly. Studies show that CSAT scores correlate strongly with customer loyalty, repeat business, and upselling opportunities.
What NPS Reveals About Customer Experience
NPS, or Net Promoter Score, measures long-term customer loyalty and the likelihood of customers recommending your brand. It provides a broader view of customer experience by asking a single question: "How likely are you to recommend our company to a friend or colleague?"
Respondents rate their likelihood on a scale from 0 to 10. Scores are then categorized into three groups:
- Promoters (9-10): Loyal customers who actively promote your brand.
- Passives (7-8): Satisfied but not enthusiastic customers.
- Detractors (0-6): Unhappy customers who may harm your brand reputation.
NPS scores range from -100 to +100, with higher scores indicating better customer experience. Research shows that companies with high NPS scores often grow faster than their competitors. For instance, Bain and Company found that 20% to 60% of growth variation is linked to NPS scores.
By combining CSAT and NPS, you can gain a comprehensive understanding of both short-term satisfaction and long-term loyalty, enabling you to refine your customer service strategies effectively.
How NPS Is Calculated
Calculating the net promoter score involves a straightforward process. You start by asking customers a single question: "How likely are you to recommend our company to a friend or colleague?" Customers respond using a scale from 0 to 10. Their responses fall into three categories:
- Promoters (9-10): These are your loyal advocates.
- Passives (7-8): These customers are satisfied but not enthusiastic.
- Detractors (0-6): These individuals are unhappy and may discourage others from engaging with your brand.
To calculate NPS, subtract the percentage of detractors from the percentage of promoters. For example, if 60% of respondents are promoters and 20% are detractors, your NPS would be 40. This score ranges from -100 to +100, with higher values indicating stronger customer loyalty and better customer experience.
Statistical methods can refine NPS calculations, especially for large datasets. Industry-standard practices include approaches like Wald's Confidence Interval and the Goodman Method. These methods ensure accuracy and reliability in your results.
| Method | Description |
|---|---|
| Wald's Confidence Interval | Based on Laplace's proposal, calculated as NPS±zα/2∙σNPS/n. |
| Adjusted Wald Interval | Modified for matched pairs: NPS^±zα/2∙σNPS^/n^. |
| Goodman Method | Similar to Wald, but with different statistical properties. |
| Iterative Procedures | Based on various score tests, including Wilson's and Tango's methods. |
Using these methods, you can validate your NPS results and gain deeper insights into customer loyalty trends. This helps you identify areas where your customer service excels and where improvements are needed. Combining NPS with csat surveys provides a balanced view of immediate satisfaction and long-term loyalty, ensuring you meet the needs of both satisfied customers and those who require better service.
Key Differences Between CSAT and NPS
Transactional vs. Relational Metrics
CSAT and NPS differ in how they measure customer sentiment. CSAT focuses on transactional metrics, capturing customer satisfaction after specific interactions. For example, you might ask customers to rate their experience after a product purchase or a support call. This approach provides immediate feedback, helping you identify areas for improvement in your customer service.
NPS, on the other hand, measures relational metrics. It evaluates overall customer loyalty and sentiment toward your brand over time. Relational NPS surveys are typically conducted periodically, offering a broader view of customer experience trends. For instance, asking customers how likely they are to recommend your brand provides insights into long-term loyalty.
| Metric Type | Description | Ideal Use Cases |
|---|---|---|
| Relational NPS | Measures overall customer sentiment towards the organization. | Understanding customer perception, measuring loyalty, and comparing year-on-year improvements. |
| Transactional NPS | Focuses on customer satisfaction after specific interactions. | Gathering feedback on specific issues, assessing team performance, and identifying actionable insights. |
Sobot’s omnichannel solutions can help you manage both transactional and relational metrics effectively. By integrating tools like AI-powered chatbots and unified workspaces, you can streamline feedback collection and enhance customer satisfaction across all channels.
Short-Term Satisfaction vs. Long-Term Loyalty
CSAT emphasizes short-term satisfaction. It’s ideal for understanding how satisfied customers feel about specific interactions, such as resolving a technical issue or completing a purchase. High CSAT scores often indicate satisfied customers who are likely to return for repeat business.
NPS, however, focuses on long-term loyalty. It measures how likely customers are to recommend your brand to others, which reflects their overall trust and commitment. Companies with high NPS scores often experience faster growth and stronger customer retention. For example, Bain & Company found that businesses with high NPS scores grow 20% to 60% faster than their competitors.

Combining CSAT and NPS allows you to address both immediate concerns and long-term goals. Sobot’s Voice Call Center, with features like call tracking and AI-powered voicebots, can help you improve both metrics by delivering exceptional customer service and building lasting relationships.
Survey Timing and Frequency
Timing plays a crucial role in the effectiveness of CSAT and NPS surveys. CSAT surveys work best when deployed immediately after customer interactions. For example, sending a survey right after a support call captures real-time feedback, ensuring accuracy.
NPS surveys, however, should be conducted periodically. Sending them at key touchpoints, such as after a major purchase or annually, helps you monitor long-term customer loyalty trends. This approach balances immediate feedback with broader insights into customer experience.
- CSAT surveys: Best deployed immediately after customer interactions to capture real-time feedback.
- NPS surveys: Conducted periodically to monitor long-term customer loyalty trends.
Sobot’s omnichannel solutions simplify survey deployment across multiple channels. With tools like AI-driven automation and unified workspaces, you can gather feedback efficiently and use analytics to optimize your customer service strategy.
When to Use CSAT vs. NPS
Scenarios for Using CSAT in Customer Service
You should use CSAT when you need immediate feedback on specific customer interactions. For example, after a customer completes a support call or purchases a product, sending a CSAT survey helps you understand how satisfied they are with that particular experience. This metric is ideal for transactional scenarios where pinpointing areas for improvement is crucial.
CSAT surveys work best when deployed right after the interaction. This ensures the feedback reflects the customer's fresh experience. For instance, if 300 out of 400 survey respondents rate their satisfaction positively, your CSAT score would be 75%. The formula for calculating CSAT is straightforward:
CSAT (%) = (No. positive responses / Total no. responses) * 100
| CSAT Score | Description |
|---|---|
| 0 | No customer satisfaction |
| 75 | 75% of respondents satisfied |
| 100 | Complete satisfaction |
In industries like retail and hospitality, CSAT surveys help you measure satisfaction with service interactions. Sobot’s Voice Call Center simplifies this process by automating survey deployment and collecting real-time feedback. Its AI-powered voicebot can even assist in resolving issues before surveys are sent, boosting customer satisfaction scores.
Scenarios for Using NPS to Improve Customer Experience
NPS is your go-to metric for understanding long-term customer loyalty. You should use it when assessing how likely customers are to recommend your brand. For example, conducting an NPS survey after a major product launch or annually helps you gauge overall customer sentiment toward your business.
Studies show that NPS scores correlate strongly with growth. Bain & Company found that businesses with high NPS scores grow 20% to 60% faster than competitors. This metric also provides insights into customer experience trends. For instance, Reichheld’s 2003 study emphasized the importance of capturing NPS from customers familiar with your brand.
| Study | Findings |
|---|---|
| Reichheld (2003) | NPS scores highlight the importance of customer experience in recommendations. |
| Bendle et al. (2019) | Accurate NPS comparisons require recreating scores as originally estimated. |
| Fitzgerald (2017) | Capturing NPS from current and non-customers aids strategic decision-making. |
Sobot’s Omnichannel Solution enhances NPS collection by integrating surveys across multiple channels like email, social media, and live chat. Its unified workspace consolidates customer data, enabling you to analyze loyalty trends and refine your customer experience strategy.
Industry Applications of CSAT and NPS
Different industries use CSAT and NPS to address unique challenges. In technology, CSAT surveys measure satisfaction after specific interactions, such as resolving technical issues. NPS, on the other hand, evaluates customer loyalty and the likelihood of recommending services.
| Industry | CSAT Application | NPS Application |
|---|---|---|
| Technology | Gauges customer service effectiveness after specific interactions. | Provides insights into customer loyalty and likelihood to recommend services. |
| Retail | Measures satisfaction with service interactions. | Assesses customer likelihood to continue purchasing and sharing experiences. |
| Healthcare | Identifies satisfaction levels related to specific interactions like intake. | Evaluates overall patient experience and perception of care providers. |
For example, in retail, CSAT surveys can help you understand how satisfied customers are with checkout processes. In healthcare, NPS surveys reveal patient loyalty and trust in care providers. Sobot’s solutions, such as its AI-driven chatbots and analytics tools, streamline survey deployment and provide actionable insights across industries. Samsung’s success story demonstrates how Sobot’s contact center solutions improved customer satisfaction by 30%, showcasing the power of combining CSAT and NPS metrics.
Using CSAT and NPS Together

Combining Metrics for Holistic Customer Success
Using CSAT and NPS together provides a complete view of your customer journey. CSAT measures satisfaction at specific touchpoints, while NPS evaluates overall loyalty. Together, they help you understand both immediate feedback and long-term trends. For example, a high CSAT score after a support call might indicate excellent service, but a low NPS score could reveal broader issues affecting customer loyalty.
Combining these metrics with Customer Effort Score (CES) adds even more depth. CES identifies friction points in the customer journey, ensuring smoother experiences even when CSAT and NPS are high.
| Metric | Contribution to Customer Success |
|---|---|
| CSAT | Measures customer satisfaction at specific touchpoints, allowing for immediate investigation of issues. |
| NPS | Indicates overall customer loyalty trends, helping to maintain focus on broader relationships. |
| CES | Identifies friction points in the customer journey, ensuring smoother experiences even when CSAT and NPS are high. |
Integrating these metrics with CRM data enhances predictive capabilities. You can identify potential brand advocates and areas for improvement, ensuring a holistic approach to customer success.
Bridging Immediate Feedback and Long-Term Insights
CSAT and NPS complement each other by bridging short-term feedback with long-term insights. CSAT surveys capture real-time reactions, helping you address issues quickly. NPS surveys, on the other hand, reveal loyalty trends over time. This combination allows you to act on immediate concerns while planning for sustained customer satisfaction.
For instance, if your CSAT score drops after a product launch, you can investigate and resolve the issue promptly. Meanwhile, monitoring NPS ensures you maintain focus on building lasting relationships. Sobot’s omnichannel solutions simplify this process by integrating survey data across multiple channels, providing a unified view of customer experience.
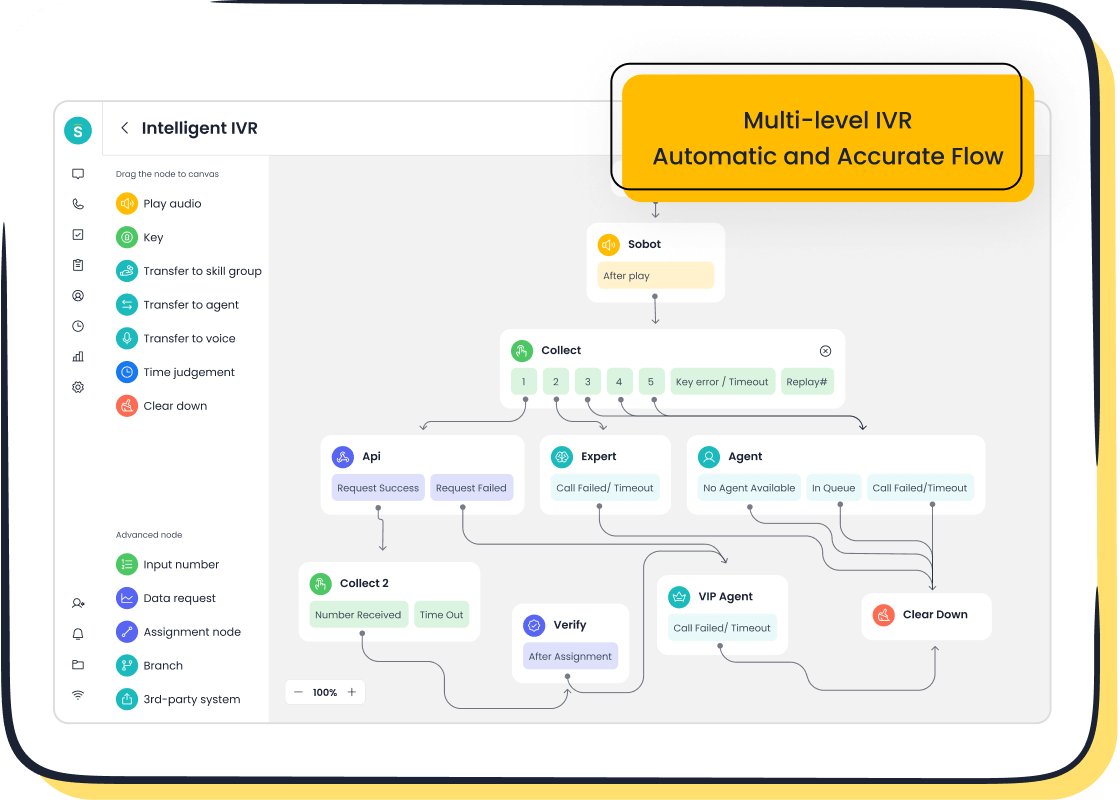
Sobot’s Voice/Call Center Role in Enhancing Metrics
Sobot’s Voice Call Center plays a pivotal role in improving both CSAT and NPS. Its AI-powered voicebot resolves repetitive queries, reducing inbound call volume by 20%. This efficiency boosts customer satisfaction, as evidenced by a 97% CSAT score and a 96% positive feedback rate.
The platform’s unified workspace consolidates customer data, enabling agents to provide personalized service. Features like call tracking and smart routing ensure faster resolutions, contributing to an 85% problem resolution rate.
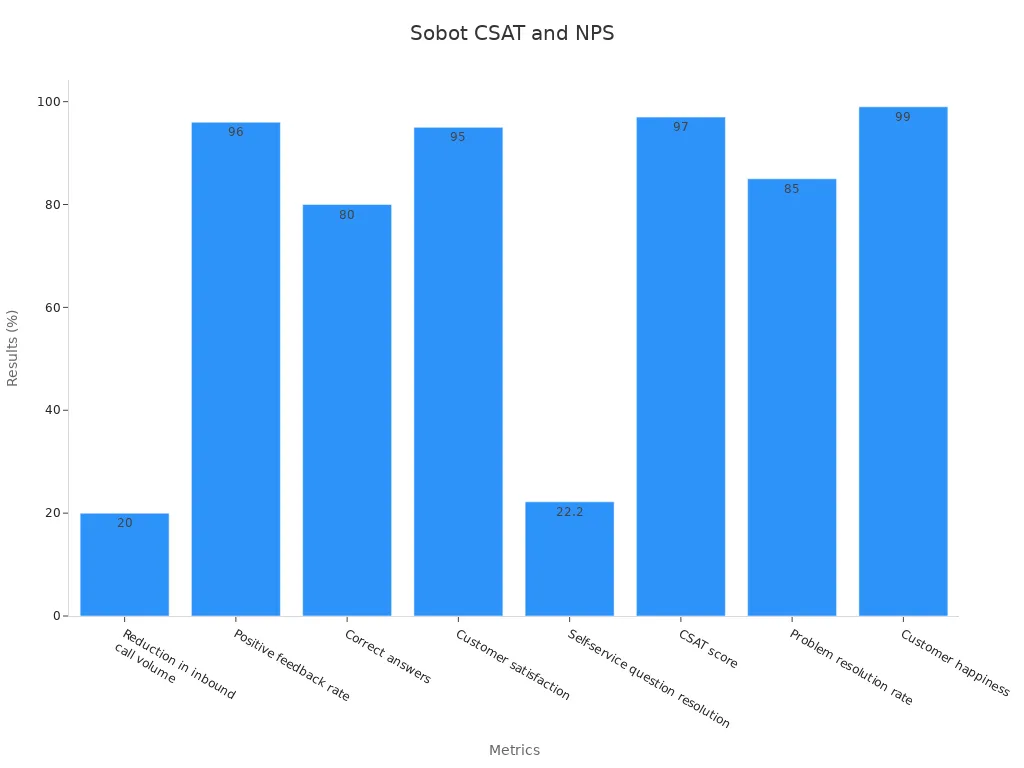
By leveraging Sobot’s solutions, you can enhance customer experience, improve satisfaction scores, and build stronger loyalty. These tools empower you to address immediate concerns while fostering long-term trust.
Best Practices for CSAT and NPS
Designing Surveys to Improve Customer Satisfaction
Designing effective surveys is crucial for improving csat and nps scores. Start by setting clear objectives. For example, if you aim to measure customer satisfaction after a support call, focus your questions on that interaction. Reaching the right audience is equally important. Targeting customers who recently interacted with your brand ensures accurate feedback.
Crafting clear and unbiased questions minimizes confusion. For instance, instead of asking, "Was your experience bad?" ask, "How satisfied were you with your experience?" Using innovative data collection methods, such as mobile-friendly surveys, can boost response rates. A well-designed survey not only improves customer satisfaction surveys but also provides actionable insights.
| Survey Design Strategy | Description |
|---|---|
| Planning and Setting Objectives | Establishing clear goals ensures that your survey aligns with your research objectives. |
| Choosing the Right Audience | Reaching the correct sample of respondents promotes representativeness. |
| Effective Question Design | Crafting clear and unbiased questions minimizes the risk of misleading responses. |
| Data Collection Methods | Innovative data collection techniques, including digital and mobile surveys, improve response rates and engagement. |
| Data Analysis and Reporting | The final step transforms raw numbers into insights that can influence decision-making. |
Sobot’s omnichannel solutions simplify survey deployment. With tools like AI-driven automation, you can design and distribute surveys across multiple channels, ensuring you capture feedback efficiently.
Analyzing Data to Enhance Customer Experience
Analyzing survey data helps you understand customer sentiment and identify trends. For example, by categorizing respondents into Promoters, Passives, and Detractors, you can pinpoint areas needing improvement. Promoters often highlight what you’re doing well, while Detractors reveal pain points in customer interactions.
Use analytics to track csat and nps trends over time. For instance, if your csat score drops after a product launch, investigate the cause. Similarly, a declining nps score might indicate broader issues affecting customer retention. Regular analysis ensures you address immediate concerns while planning long-term strategies.
Sobot’s unified workspace consolidates customer data, making it easier to analyze feedback. Features like real-time monitoring and performance insights help you refine your customer experience metrics and improve customer retention.
Leveraging Sobot’s Omnichannel Solutions for Better Results
Sobot’s omnichannel solutions enhance both csat and nps by streamlining customer interactions. The platform integrates multiple communication channels, allowing you to gather feedback seamlessly. For example, Sobot’s AI-powered chatbots handle repetitive queries, freeing agents to focus on complex issues. This efficiency boosts satisfaction and loyalty.
The unified workspace provides a comprehensive view of customer interactions, enabling personalized service. By leveraging these tools, you can improve customer satisfaction and build stronger relationships. Samsung’s success story illustrates this. After implementing Sobot’s solutions, Samsung achieved a 97% customer satisfaction rate and a 30% increase in agent efficiency.
By combining advanced technology with proven strategies, Sobot empowers you to enhance customer experience metrics and drive long-term success.
Understanding the differences between CSAT and NPS helps you choose the right metric for your business goals. CSAT measures immediate customer satisfaction with specific interactions, while NPS tracks long-term loyalty through recommendations. CSAT captures in-the-moment feelings, whereas NPS reflects ongoing commitment to your company. A satisfied customer may not always become a loyal advocate.
Selecting the appropriate metric improves business outcomes. Metrics tied to customer experiences, such as service quality, act as a barometer for customer happiness. By addressing areas that matter most to customers, you foster loyalty and positive word-of-mouth. Combining CSAT and NPS offers a balanced view of satisfaction and loyalty, ensuring holistic customer success.
FAQ
What is the best way to deploy CSAT surveys?
Deploy CSAT surveys immediately after customer interactions. Timing ensures feedback reflects the customer’s fresh experience. Use tools like Sobot’s omnichannel solutions to automate survey distribution across multiple channels, capturing insights efficiently.
How often should you conduct NPS surveys?
Conduct NPS surveys periodically, such as quarterly or annually. This helps you monitor long-term loyalty trends and identify areas for improvement in the customer journey. Use Sobot’s analytics tools to track changes over time.
Can CSAT and NPS work together in customer feedback programs?
Yes, combining CSAT and NPS provides a balanced view of satisfaction and loyalty. CSAT captures immediate feedback, while NPS reveals broader trends in the customer journey. Together, they enhance your customer feedback programs.
How can Sobot’s solutions improve CSAT and NPS scores?
Sobot’s tools streamline customer interactions. Features like AI-powered chatbots and unified workspaces reduce friction in the customer journey. These innovations improve satisfaction and loyalty, boosting both CSAT and NPS scores.
What industries benefit most from CSAT and NPS?
Retail, healthcare, and technology industries benefit significantly. CSAT measures satisfaction with specific interactions, while NPS evaluates loyalty across the customer journey. Sobot’s solutions adapt to diverse industry needs, ensuring effective feedback collection.
See Also
Comparing Leading Customer Feedback Software Solutions
Enhance SaaS Customer Support Using Live Chat Techniques
Transforming Customer Support with AI Service Agents
