Comprehensive Guide to the Top 10 Ecommerce KPIs

Here’s a quick look at the top 10 KPIs for ecommerce beginners:
- Conversion Rate
- Average Order Value
- Customer Acquisition Cost
- Customer Lifetime Value
- Shopping Cart Abandonment Rate
- Return on Advertising Spend
- Revenue Per Visitor
- Net Promoter Score
- Customer Retention Rate
- Website Traffic
Tracking key performance indicators helps you see how well your store performs. Companies that use e-commerce analytics often find more customers, keep them longer, and boost profits. Sobot and its Live Chat make it easy for you to monitor these numbers. With this comprehensive guide, you’ll find that understanding KPIs is simple—even if you’re just starting your beginner's guide to e-commerce KPIs journey.
Ecommerce KPIs and Metrics Explained
What Are Ecommerce KPIs?
Let’s break it down. Ecommerce KPIs are targets that help you measure how well your online store is doing. These are not just numbers—they show you if you’re reaching your goals. For example, you might want to know how many visitors buy something, how much each customer spends, or how many people come back to shop again. These targets are different from general business metrics. While general metrics look at things like total profit or revenue, ecommerce KPIs focus on what matters most for online stores, like conversion rate, customer acquisition cost, and retention.
Here’s a quick table to show the difference:
| eCommerce KPIs | General Business Metrics |
|---|---|
| Tailored to measure online business performance | May not capture unique eCommerce aspects |
| Focus on customer acquisition cost, conversion rate, and customer lifetime value | Often centered around overall profit and revenue |
| Emphasizes metrics like abandoned cart rate and customer churn rate | Typically includes broader financial metrics like net income and revenue growth |
Why Ecommerce Metrics Matter
You need e-commerce metrics to see what’s working and what’s not. These targets help you track sales, website traffic, and how much it costs to get a new customer. Successful online retailers use metrics like sales conversion rate, average order value, and cost per acquisition to make smart decisions. When you follow these targets, you can spot trends, fix problems, and grow your business. E-commerce metrics also help you set clear targets for your team, so everyone knows what to aim for.
Impact on Customer Experience
Tracking e-commerce metrics does more than boost sales. It helps you understand your customers and improve their experience. When you know how many people return to your store, you can focus on customer retention. If you see a high cart abandonment rate, you can make checkout easier. These targets show you where to improve. Sobot’s analytics give you a unified view of all your customer data. With Sobot, you can see everything in one place, spot patterns, and make changes fast. This leads to better customer retention and happier shoppers.
Top 10 KPIs for Ecommerce Success
Quick List of Top 10 KPIs
You want to achieve e-commerce success, right? Tracking the top 10 KPIs for ecommerce helps you see what’s working and what needs improvement. Here’s a quick look at these KPIs and what they mean for your store:
| KPI | Definition | Formula |
|---|---|---|
| Conversion Rate | Percentage of visitors who complete a desired action, like making a purchase. | (Number of conversions / Number of visitors) × 100 |
| Average Order Value | Average amount spent each time a customer places an order. | Total revenue / Number of orders |
| Customer Acquisition Cost | Average cost to get a new customer, including marketing and sales. | Spend on gaining new customers / Number of new customers |
| Customer Lifetime Value | Total value a customer brings during their relationship with your store. | Average order value × Purchase frequency × Customer lifespan |
| Shopping Cart Abandonment Rate | Percentage of shoppers who add items to their cart but don’t finish the purchase. | (Abandoned carts / Total carts) × 100 |
| Return on Advertising Spend | Revenue generated from advertising compared to the cost of ads. | Revenue from ads / Cost of ads |
| Revenue Per Visitor | Average revenue earned from each website visitor. | Total revenue / Website visits |
| Net Promoter Score | Measures how likely customers are to recommend your store. | % Promoters - % Detractors |
| Customer Retention Rate | Percentage of customers who return to make another purchase. | (Customers at end of period - New customers) / Customers at start × 100 |
| Website Traffic | Total number of visitors to your site. | Count of site visits |
These KPIs give you a clear picture of your store’s performance. You can use them to track sales, measure customer loyalty, and see how well your marketing works.
How to Prioritize KPIs
You might wonder which KPIs matter most for e-commerce success. Not every store needs to focus on all ten at once. Start by defining your main business goals. Are you trying to boost transactions, grow revenue, or improve customer satisfaction? Identify which metrics help you track progress toward those goals.
Tip: Focus on 2-3 KPIs that directly measure your progress. Make sure your KPIs are specific, measurable, achievable, relevant, and time-specific.
If you run a direct-to-consumer store, you might prioritize conversion rate, customer acquisition cost, and customer retention rate. Subscription-based businesses often focus on customer lifetime value and churn rate. Marketplace platforms track active seller count and average transaction value.
Choosing the right KPIs helps you stay on track and reach e-commerce success faster. Keep your goals clear, and let the top 10 KPIs for ecommerce guide your decisions.
Conversion Rate Optimization with Sobot Live Chat
What Is Conversion Rate?
You want your visitors to become buyers. That’s what conversion rate measures. It shows the percentage of people who visit your store and then make a purchase. If you have 100 visitors and 3 buy something, your conversion rate is 3%. Most e-commerce stores see conversion rates between 2.5% and 3%. The global average conversion rate sits at 2.9% (source).
- The average conversion rate for ecommerce websites is approximately 2.5% to 3%.
- The global average ecommerce conversion rate is reported to be 2.9%.
Why It Matters for E-commerce
Conversion rate is one of the most important kpis for your online store. It tells you how well your site turns visitors into customers. A higher conversion rate means more profit from the same amount of traffic. You don’t need more visitors to grow your revenue. You just need more of them to buy. If your conversion rate goes up, your profit increases. You can spend less on ads and still make more money. Conversion rate affects every part of your business, from marketing to customer service. It helps you see if your website design, product pages, and checkout process work well.
How Sobot Live Chat Improves Conversion
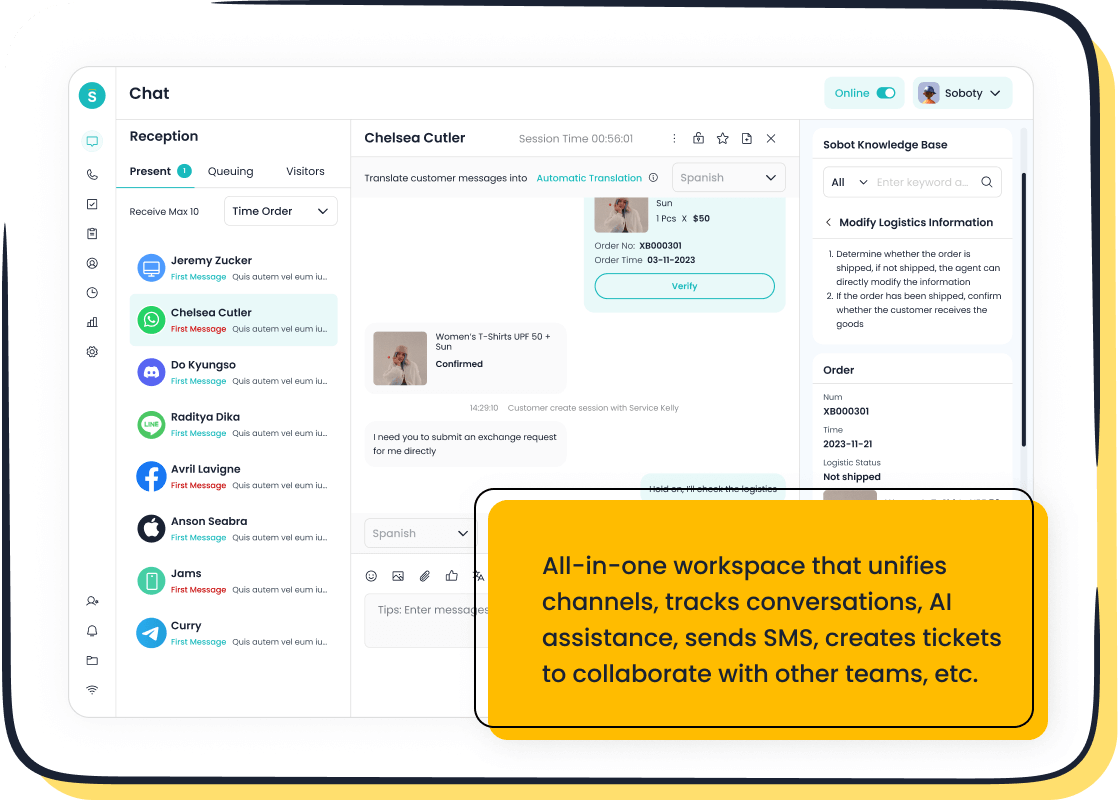
Sobot Live Chat helps you boost your conversion rate. You can talk to visitors in real time. You answer their questions fast. You help them find what they need. Sobot’s chatbot and AI Agent guide shoppers through the buying process. They handle common questions and reduce cart abandonment. Sobot Live Chat supports many channels, so you never miss a chance to connect. You keep all conversations in one place. You use built-in analytics to track conversion and profit. Sobot’s tools help you profile visitors and offer tailored service. This leads to a 38% gain in conversion for many stores (Sobot Live Chat).
Here’s a real-world example:
| Case Study | Result |
|---|---|
| Underoutfit | Achieved a 315% increase in conversion rates by deploying chatbots to address cart abandonment. |
You can see how Sobot Live Chat turns visitors into buyers. You improve customer experience and increase profit. You get more revenue without extra effort. Sobot helps you optimize your conversion rate and grow your e-commerce business.
Average Order Value in E-commerce
Definition of AOV
Average order value, or AOV, tells you how much money a customer spends each time they buy from your store. You find this number by dividing your total revenue by the number of orders. For example, if your store makes $1,000 from 10 orders, your average order value is $100. This number helps you see how much each sale is worth. It’s a simple way to track how your store performs.
Why AOV Is Important
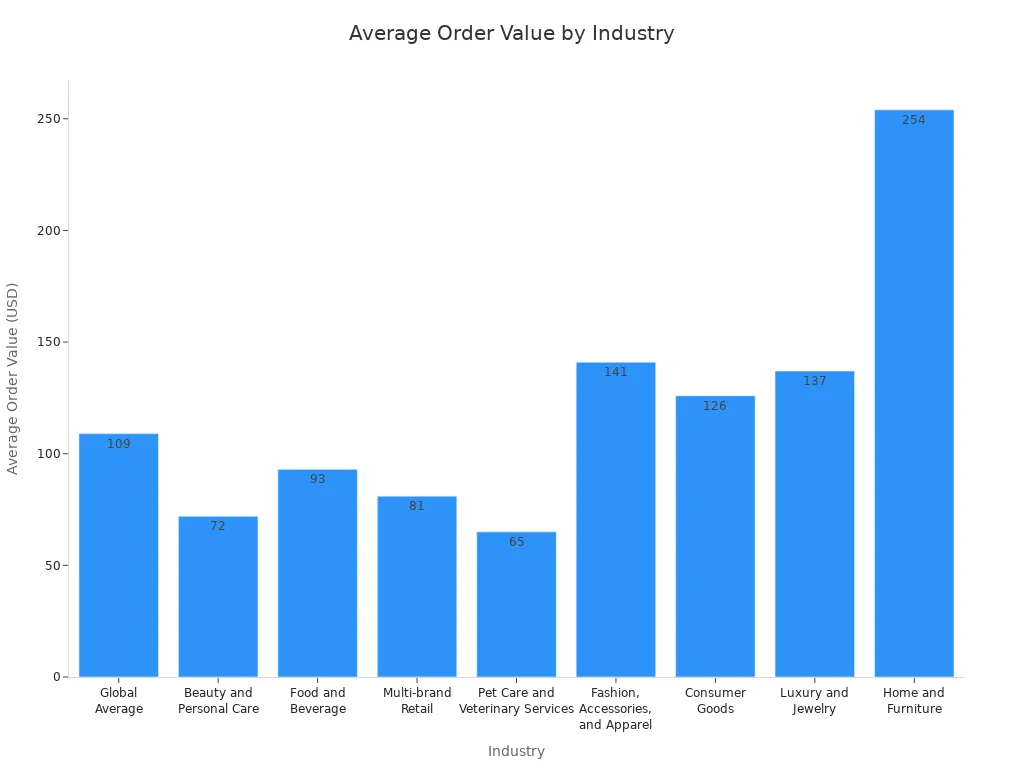
You want to grow your revenue, right? A higher average order value means you make more money from every sale. This helps you cover costs and boost profit. When you know your AOV, you can set better goals and measure your kpis. You can also compare your store to others in your industry. Check out the table below to see how AOV looks in different fields:
| Industry | Average Order Value (AOV) |
|---|---|
| Global Average | $109 |
| Beauty and Personal Care | $72 |
| Food and Beverage | $93 |
| Multi-brand Retail | $81 |
| Pet Care and Veterinary Services | $65 |
| Fashion, Accessories, and Apparel | $141 |
| Consumer Goods | $126 |
| Luxury and Jewelry | $137 |
| Home and Furniture | $254 |
Strategies to Increase AOV
You can use smart strategies to raise your average order value and boost your revenue. Here are some ideas:
- Bundle products together. People love deals, and bundles can raise purchase frequency.
- Offer free shipping when shoppers spend more. This encourages higher purchase frequency.
- Suggest related items during checkout. This can increase purchase frequency and average lifetime revenue.
- Use discounts for buying more. Volume deals help you grow average lifetime revenue.
- Personalize recommendations based on what shoppers like. This can drive average lifetime revenue.
- Try loyalty programs. Points and rewards can boost average lifetime revenue.
- Add gifts for big spenders. Shoppers may buy more to get a freebie.
You don’t need to use every strategy at once. Test a few and see what works for your e-commerce store. When you focus on AOV, you help your business grow and improve average lifetime revenue.
Customer Acquisition Cost (CAC) in Ecommerce
What Is CAC?
Customer acquisition cost, or CAC, shows you how much you spend to get a new customer. You add up all your marketing and sales costs, then divide by the number of new customers you gained. For example, if you spend $500 on ads and get 10 new buyers, your CAC is $50. This number helps you see if your marketing works well or if you pay too much to get each customer.
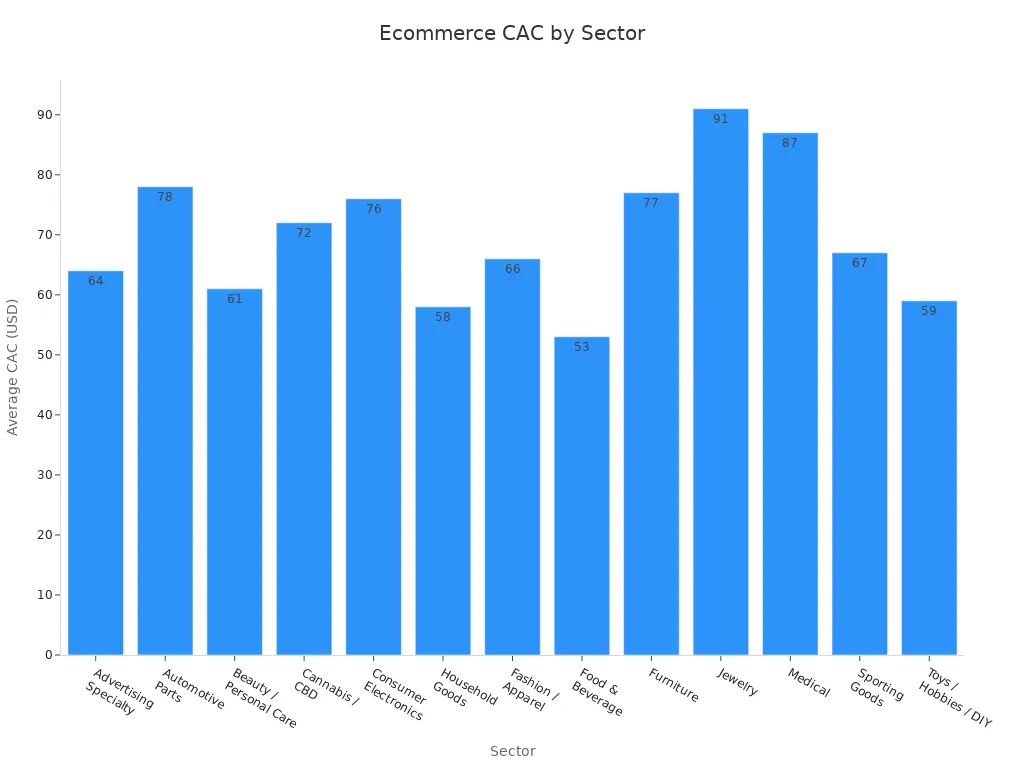
Here’s a quick look at average CAC by sector:
| Sector | Average CAC |
|---|---|
| Advertising Specialty | $64 |
| Automotive Parts | $78 |
| Beauty / Personal Care | $61 |
| Cannabis / CBD | $72 |
| Consumer Electronics | $76 |
| Household Goods | $58 |
| Fashion / Apparel | $66 |
| Food & Beverage | $53 |
| Furniture | $77 |
| Jewelry | $91 |
| Medical | $87 |
| Sporting Goods | $67 |
| Toys / Hobbies / DIY | $59 |
Why CAC Matters
You want to grow your e-commerce store without wasting money. CAC tells you if your spending brings in enough new buyers. If your CAC is too high, you might lose money on each sale. If it’s low, you keep more profit. Most e-commerce businesses see CAC between $50 and $130. Some sectors, like electronics, can go even higher. When you track CAC as one of your kpis, you make smarter choices about where to spend your budget.
Reducing CAC with Omnichannel Tools
You can lower your customer acquisition cost by using smart tools. Omnichannel platforms help you reach shoppers on their favorite channels—like social media, email, and live chat—all in one place. These tools let you segment your audience and target the right people. When you use data to find the best customers, you waste less money on ads that don’t work. You can also team up with partners or use referral programs to share costs and reach more buyers. Many companies see their CAC drop when they use these strategies. With the right approach, you get more value from every dollar you spend.
Tip: Focus on data-driven marketing and unified communication tools to keep your CAC low and your profits high.
Customer Lifetime Value (CLV) for Online Stores
What Is CLV?
Customer lifetime value, or CLV, shows you how much money a customer brings to your store over their entire relationship with your business. You can think of it as the total revenue you earn from one person before they stop buying from you. To find this number, multiply the average order value by how often a customer buys and how long they stay with your store. This number helps you see which shoppers are most valuable.
Here are some typical CLV numbers for e-commerce businesses:
- Most e-commerce stores see a lifetime value between $100 and $300.
- Some stores with niche products or high-ticket items have a lifetime value above $300.
- Stores that sell everyday items often have a lower lifetime value.
Why CLV Is Key
You want your business to grow. CLV helps you focus on the right shoppers. When you know your lifetime value, you can decide how much to spend to get new customers. If you spend less to get a customer than their lifetime value, you make a profit. This number also helps you set smart kpis and plan for the future. You can use CLV to spot your best shoppers and reward them. This keeps them coming back and boosts your revenue.
Boosting CLV with Personalization
Personalization can make a big difference in your store. When you give shoppers a personal touch, they feel special and want to return. Many people expect businesses to know what they like and offer products just for them.
- About 71% of shoppers want personalized experiences.
- Around 76% feel upset when they do not get this kind of service.
- Stores that use personalization well see 40% more revenue than those that do not.
You can use simple tools to recommend products, send special offers, or remember birthdays. These actions help you increase customer loyalty and lifetime value. When you focus on each shopper, you build trust and grow your business.
Cart Abandonment Rate in E-commerce
What Is Cart Abandonment?
You probably know the feeling. You add items to your cart, then leave the site without buying. That’s cart abandonment. It happens when shoppers start the checkout process but don’t finish. This metric shows how many people leave before completing their purchase. You can track it as one of your kpis to see how well your store turns browsers into buyers.
- The global average cart abandonment rate is 70.19% as of 2024-2025. That means about 7 out of 10 shoppers leave without buying (Baymard Institute).
- Most e-commerce sites see a cart abandonment rate of 70.19%.
Why It’s a Critical Metric
Cart abandonment rate matters because it shows where you lose sales. If your rate is high, you miss out on revenue. Many shoppers leave because of unexpected fees, confusing checkout steps, or trust issues. Trust barriers cause 10-15% of drop-offs, especially in busy stores. Personalized abandoned cart emails can bring back shoppers, with a 50% conversion rate for those who click through.
Here’s a quick look at strategies that help reduce cart abandonment:
| Intervention Strategy | Description |
|---|---|
| Simplifying the checkout process | Make buying easy and fast. |
| Showing costs upfront | Display all fees early to avoid surprises. |
| Building trust signals | Use SSL badges and reviews to reassure shoppers. |
| Sending abandoned cart emails | Remind shoppers about their cart and encourage them to finish checkout. |
| Personalizing the shopping experience | Tailor the experience to each customer for better engagement. |
Reducing Abandonment with Sobot
You can lower your cart abandonment rate with Sobot’s tools. Sobot Live Chat lets you answer questions instantly, so shoppers don’t leave confused. The chatbot guides customers through checkout and handles common concerns. Sobot’s ticketing system helps you follow up with shoppers who left items in their cart. You can send personalized reminders and offer support across channels like WhatsApp, Facebook, and your website. Sobot’s analytics show you where shoppers drop off, so you can fix problems fast. Many stores see fewer abandoned carts and more completed sales after using Sobot’s solutions. If you want to improve your e-commerce results, Sobot gives you the tools to keep customers engaged and boost your revenue (Sobot Live Chat).
Ecommerce Traffic Sources and Analytics
Understanding Traffic Sources
You want to know where your shoppers come from. That’s what traffic sources tell you. Most e-commerce stores get visitors from a mix of places. Here’s how it usually breaks down:
- About 68% of all trackable website traffic comes from search engines. This includes both organic and paid search.
- Organic search alone brings in around 53% of all visits. People find your store by typing questions or products into Google or Bing.
- The other 32% of traffic comes from direct visits, social media, email marketing, and referrals.
You can see how important it is to show up in search results. If you want more details, check out BrightEdge’s research.
Why Traffic Analytics Matter
You need to track where your visitors come from. Traffic analytics help you see which channels work best. When you know your top sources, you can spend your time and money wisely. For example, one retailer doubled their organic traffic in just three months by focusing on what worked best. You can do the same. Analytics let you spot trends, test new ideas, and grow your store faster.
Here’s what you get when you analyze your traffic:
- You find out which marketing efforts bring in the most visitors.
- You see which channels lead to more sales.
- You can adjust your strategy to get better results.
Tip: Use traffic analytics as one of your kpis to measure your store’s growth.
Using Sobot Analytics for Insights
Sobot gives you powerful tools to track and understand your traffic. The dashboard shows you real-time data from every channel. You can see how many people visit, where they come from, and what they do on your site. Sobot’s AI Agent helps you spot patterns and gives you tips to improve. You get a unified view of all your customer interactions, not just numbers. This makes it easy to see what works and what needs fixing. With Sobot, you can make smart choices and help your business grow.
Bounce Rate and User Engagement
What Is Bounce Rate?
Bounce rate shows you how many visitors leave your site after viewing just one page. If someone lands on your homepage and clicks away without exploring, that counts as a bounce. You want a low bounce rate because it means people stay longer and interact more. Let’s look at how bounce rates compare across industries:
| Industry | Average Bounce Rate |
|---|---|
| Overall eCommerce | 45.68% |
| Beauty | 38.7% |
| Jewelry | 51% |
| Food and Beverage | >65% |
A bounce rate above 50% is common for many e-commerce stores. If your site falls in the food and beverage category, you might see rates over 65%. Lower rates mean visitors find your site interesting and want to explore.
Why Engagement Matters
You want visitors to stick around and become buyers. Engagement means people interact with your site, click on products, and ask questions. When you keep visitors engaged, you boost your kpis and increase sales. A clean design, clear fonts, and attractive visuals help create a positive first impression. Intuitive layouts encourage visitors to stay longer. Real-time support makes a big difference. According to Khoros, 79% of customers say their buying experience improves when they can chat with a support representative online. If you offer instant help, you build trust and keep shoppers from leaving.
Tip: Make your site easy to use and offer quick support to keep visitors engaged.
Lowering Bounce Rate
You can lower your bounce rate with a few smart moves:
- Compress images so your site loads fast.
- Minimize HTTP requests by reducing page elements.
- Make sure your site works well on phones and tablets.
A modern design and clear visuals help visitors feel comfortable. Responsive layouts keep your site looking good on any device. When you provide real-time support, you show visitors you care about their experience. This keeps them engaged and turns them into loyal customers. If you focus on engagement, you help your e-commerce store grow and improve your kpis.
Repeat Customer Rate in E-commerce
What Is Repeat Customer Rate?
Repeat customer rate shows you how many shoppers come back to buy from your store again. You measure it by dividing the number of customers who made more than one purchase by the total number of customers, then multiply by 100. This kpis helps you see how well you keep buyers coming back. Most e-commerce stores have a repeat customer rate between 25% and 30%. Shopify stores average about 27%. If your store has a rate between 20% and 40%, you’re doing well (source). Tracking this number helps you understand your month over month retention and spot trends in customer retention rate.
Why Repeat Customers Are Valuable
Repeat buyers are the backbone of your business. They spend more, buy more often, and cost less to serve. When you focus on customer retention, you boost your profits and grow your store faster. A high customer retention rate means you don’t need to spend as much on ads to get new shoppers. You also see better month over month retention and stronger relationships with your audience. Stores with strong retention often see higher lifetime value and more positive reviews. You can use this metric to measure how well your loyalty programs and customer service work.
Encouraging Loyalty with Sobot
You can raise your repeat customer rate by building trust and making shopping easy. Sobot’s customer contact center gives you a single place to manage all conversations. You can use live chat to answer questions fast and help shoppers find what they need. The ticketing system lets you follow up with buyers and solve problems quickly. Sobot helps you send targeted messages and reminders, which keeps your brand top of mind. You can also reward loyal shoppers with exclusive offers or points. Many stores use these strategies:
- Build a community with loyalty points for social media engagement.
- Re-engage buyers through email or SMS campaigns.
- Create seamless experiences across all platforms.
- Focus on relationship marketing to connect with shoppers.
- Use data analytics to track satisfaction and behaviors.
- Offer exclusive discounts for returning buyers.
Visible progress and easy rewards drive repeat behavior. When you use Sobot’s tools, you make it simple for shoppers to come back. This boosts your customer retention rate and improves month over month retention. You build a loyal customer base that supports your e-commerce growth.
Net Promoter Score (NPS) and Customer Satisfaction
What Is NPS?
NPS stands for Net Promoter Score. It measures how likely your customers are to recommend your store to friends or family. You ask one simple question: “How likely are you to recommend us on a scale from 0 to 10?” People who answer 9 or 10 are promoters. Those who pick 7 or 8 are passives. Anyone who chooses 6 or below is a detractor. You find your NPS by subtracting the percentage of detractors from the percentage of promoters. This score gives you a quick look at customer satisfaction and loyalty.
- The average Net Promoter Score for e-commerce businesses is about 62. This is a strong sign that many stores keep their shoppers happy.
- Research shows that an NPS of 62 is a good benchmark for marketers in the e-commerce world.
Why NPS Is Essential
You want to know if your customers love your store. NPS helps you see this fast. A high score means people enjoy shopping with you. They trust your brand and want to come back. A low score tells you there are problems to fix. NPS is one of the most important kpis for online stores. It shows how well you meet customer needs and if your service stands out. When you track NPS, you spot trends and take action before small issues grow. You can use this score to set goals and measure progress over time.
Improving NPS with Sobot Live Chat
You can boost your NPS by giving better service. Sobot Live Chat helps you do this in real time. When shoppers have questions, you answer right away. Fast help makes people feel valued. Sobot’s tools let you chat across websites, apps, and social media. You keep all conversations in one place, so nothing gets lost. The AI Agent and chatbot handle common questions, freeing you up for complex issues. This leads to happier shoppers and higher customer satisfaction.
Here’s how live chat improves NPS:
| Benefit of Live Chat on NPS | Description |
|---|---|
| Immediate Assistance | Provides quick help to customers, enhancing satisfaction. |
| Increased Customer Satisfaction | Leads to a better overall experience, positively influencing NPS. |
| Fostering Loyalty | Satisfied customers are more likely to recommend the brand. |
You can see the results in your store. When you use Sobot Live Chat, you build trust and loyalty. Happy shoppers tell others about your business. Your NPS goes up, and your store grows.
Return Rate and E-commerce Efficiency
What Is Return Rate?
Return rate tells you how many orders come back to your store. You measure it by dividing the number of returned items by the total number of sold items, then multiply by 100. This number helps you see how often shoppers send things back. Return rates can look very different depending on what you sell. Take a look at this table to see how return rates compare across popular e-commerce categories:
| Category | Return Rate | Reasons |
|---|---|---|
| Fashion & Clothing | 20-30% | Fit issues, color differences, buying multiple sizes |
| Luxury Fashion & Swimwear | Up to 50% | Fit, style, personal preference |
| Shoes & Accessories | 15-20% | Comfort, mismatch with expectations |
| Electronics | 5-10% | Defects, compatibility issues |
| Beauty & Personal Care | 1-5% | Hygiene reasons (no returns once opened) |
Fashion and clothing have some of the highest return rates. Fit issues cause most returns in this group. Electronics see fewer returns, usually because of defects or problems with how things work.
Why Returns Matter
Returns can cost your business a lot of money. High return rates mean you spend more on shipping, restocking, and customer service. They also affect your kpis by lowering your profit and making it harder to track real sales. When shoppers return items, you lose time and resources. You also risk losing trust if returns happen too often. If you want to keep your store running smoothly, you need to watch your return rate closely.
Note: A high return rate can signal problems with product descriptions, sizing charts, or even quality. Tracking returns helps you spot these issues early.
Reducing Returns with Better Support
You can lower your return rate by making a few smart changes. Try these proven strategies:
- Make returns easy and clear. Shoppers feel happier when the process is simple.
- Let customers cancel orders before shipping. This stops unwanted returns before they start.
- Use accurate product descriptions and clear photos. This helps shoppers know what to expect.
- Study your returns data. Look for patterns and fix common problems.
- Teach customers how to use and care for products. This reduces confusion and mistakes.
- Keep shoppers updated with tracking info. Good communication builds trust.
- Set a clear return policy. Everyone knows the rules from the start.
- Offer exchanges or store credit. Some shoppers just want a different size or color.
- Charge return fees for certain cases. This can stop unnecessary returns.
- Listen to customer feedback. Use it to improve your products and service.
When you focus on support and clear information, you help shoppers make better choices. This keeps your return rate low and your business efficient.
Choosing and Tracking the Right Ecommerce KPIs
Aligning KPIs with Business Goals
You want your store to grow. The best way to do that is to pick kpis that match your goals. Start by asking yourself what you want to achieve. Do you want more sales, happier customers, or better marketing? Your kpis should fit your main targets. For example, if you want to boost sales, track conversion rate and average order value. If you want to improve service, focus on customer satisfaction and repeat customer rate.
Here’s a simple table to help you choose the right kpis for your e-commerce store:
| Criteria for KPI Selection | Explanation |
|---|---|
| Business Goals | KPIs should reflect specific objectives such as increasing sales or enhancing customer satisfaction. |
| Market Dynamics | Understanding current trends, consumer behavior, and competition is crucial for selecting relevant KPIs. |
| Actionable Insights | The chosen KPIs must provide insights that lead to improvements and growth opportunities. |
Pick kpis that give you clear answers. You want numbers that help you make changes and see results.
Avoiding KPI Overload
It’s easy to feel overwhelmed by too many numbers. You don’t need to track everything at once. Focus on a few key kpis that matter most for your store. Too many metrics can confuse your team and slow you down. Choose two or three main kpis to start. Review them often. If you see progress, you can add more later. This way, you stay focused and make better decisions.
Tip: Less is more. Track what matters most to your business right now.
Tools for KPI Tracking (Sobot)
You need the right tools to track your kpis in real time. Sobot gives you a powerful dashboard that shows all your important numbers at a glance. You can see orders, traffic, and customer chats in one place. Sobot’s analytics help you spot trends and find ways to improve. The customer contact center brings together live chat, chatbot, voice, and ticketing, so you never miss a thing.
Here’s how top tools compare for real-time tracking:
| Tool/Platform | Description |
|---|---|
| Ecommerce Dashboard | Provides real-time visibility of KPIs like current orders and top-selling items, enhancing team decision-making. |
| Improvado | An automated data integration platform that centralizes data from various sources, ensuring accuracy and a unified view of performance. |
Sobot’s dashboard stands out because it unifies all your channels and gives you instant insights. You can act fast and keep your store running smoothly. If you want a simple way to track and improve your results, Sobot is a smart choice for any e-commerce business.
When you track the top 10 kpis, you turn scattered numbers into a clear plan for your e-commerce store. You spot gaps, make smart choices, and see real growth. Sobot and Live Chat give you the tools to connect with every customer and improve results. Start today—set up your KPI dashboard or try Sobot’s free trial. Small steps lead to big wins!
- Set up your KPI dashboard
- Try Sobot’s free trial
FAQ
What are KPIs in e-commerce?
KPIs are numbers that show how well your online store works. You use them to track sales, visits, and other important results. They help you see what’s going right and what needs fixing.
How often should I check my KPIs?
You should check your KPIs every week. This helps you spot changes fast. If you see a problem, you can act quickly and keep your store on track.
Why does customer experience matter for my store?
Customer experience shapes how people feel about your business. Happy shoppers come back and tell friends. Good service builds trust and helps your store grow.
Can Sobot help me track my KPIs?
Yes! Sobot gives you a dashboard that shows your numbers in real time. You can see orders, chats, and traffic all in one place. This makes tracking easy.
What’s the best way to improve my e-commerce results?
Start by picking a few KPIs that match your goals. Use tools like Sobot to watch your numbers. Make small changes, test them, and see what works best for your store.
See Also
Explore The 10 Best Live Chat Solutions For Shopify
Uncover 12 Essential Live Chat Applications For Shopify
The 10 Leading Call Center Analytics Tools For 2024