Key differences between churn rate and retention rate for SaaS in 2025
Churn rate measures how many customers a SaaS company loses over a period, while retention rate shows how many customers stay. These numbers matter because SaaS customer retention drives profit and growth. For example, a 5% boost in retention can raise profits by up to 95%, and acquiring new users costs five times more than keeping current ones. In 2025, top SaaS products keep nearly twice as many users as average ones, showing that strong customer retention strategies offer a real edge. Sobot’s Live Chat helps SaaS teams engage users quickly and support customers wherever they are, making it easier to improve both churn rate vs retention rate.
Churn Rate vs Retention Rate

What Is Churn Rate?
Churn rate measures how many customers leave a SaaS business during a set period. Companies track churn to understand customer attrition and spot problems in their service or product. A high churn rate signals that many users cancel or downgrade their subscriptions. This can hurt revenue and slow growth. Most SaaS companies calculate monthly churn by dividing the number of customers lost in a month by the number at the start of that month, then multiplying by 100. For example, if a company starts with 200 customers and loses 5, the monthly churn rate is 2.5%.
Churn can also refer to lost revenue, not just lost customers. Revenue churn tracks how much recurring revenue drops from cancellations or downgrades. SaaS leaders often monitor both customer churn rate and revenue churn to get a full picture. Monthly churn is a key metric for SaaS teams, especially those using tools like Sobot Live Chat to engage users and reduce cancellations. Companies with a low churn rate often see better long-term results.
| Metric | Formula | Example / Notes |
|---|---|---|
| Customer Churn Rate | (Customers who left during timeframe / Total customers at start of timeframe) * 100 | Example: 5 customers left out of 200 acquired = 2.5% churn rate |
| Annual Churn Rate | 1 - (Monthly churn rate) ^ 12 | Monthly churn of 5% compounds to 54% annual churn |
| Revenue Churn Rate | (MRR last month - MRR this month) / MRR last month | Example: $9,000 to $8,750 MRR results in 2.7% revenue churn |
| Notes | Churn calculations can be complex due to upsells and downgrades; revenue churn can be negative while customer churn is positive. |
Tip: Segmenting churn by contract type (monthly vs. annual) and excluding trial users gives a more accurate view of true customer attrition.
What Is Retention Rate?
Retention rate shows how many customers stay with a SaaS company over a period. A high retention rate means users find value and remain loyal. This metric helps SaaS teams measure customer satisfaction and the success of their retention strategies. To calculate retention rate, subtract new customers gained during the period from the total at the end, divide by the number at the start, and multiply by 100.
For example, if a company starts with 200 customers, ends with 210, and gains 20 new ones, the retention rate is ((210-20)/200)*100 = 95%. This means 95% of the original customers stayed. SaaS leaders use retention to track loyalty and spot trends. Companies like DataDog and Vertex use annual recurring revenue (ARR) and monthly recurring revenue (MRR) to calculate retention, focusing on both customer and revenue retention rates. Industry benchmarks show top SaaS firms aim for a gross retention rate above 90%. Sobot Live Chat helps boost retention by keeping users engaged and solving issues quickly.
| Aspect | Description |
|---|---|
| Retention Rate Definition | Measures the percentage of customers retained over a specific period. |
| Formula | ((Customers at end of period - New customers acquired during period) / Customers at start of period) * 100 |
| Interpretation | High rate indicates customer loyalty and satisfaction; low rate signals potential churn and dissatisfaction. |
| Business Use | Helps assess customer relationship health and guides retention strategies to reduce churn and improve loyalty. |
Why the Difference Matters
Understanding the key differences between retention rate and churn rate is vital for SaaS growth. Churn rate focuses on loss—how many customers leave or downgrade. Retention rate highlights loyalty—how many customers stay and keep using the service. Both metrics reveal different sides of customer behavior.
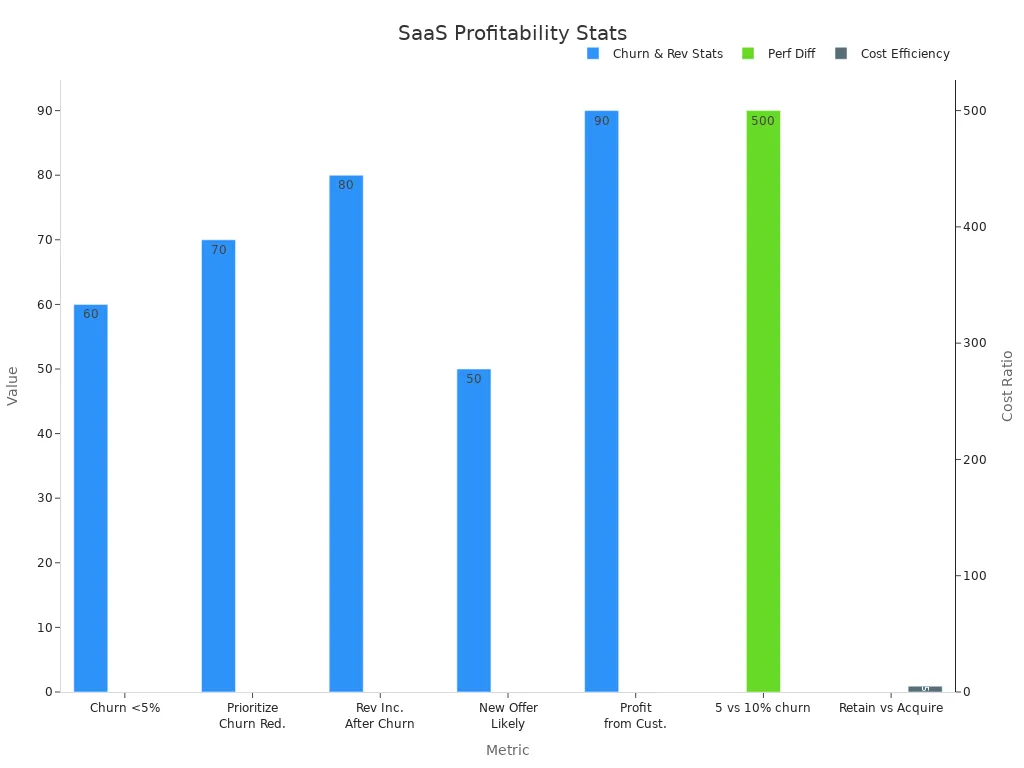
A high churn rate can signal product issues, poor support, or weak engagement. A high retention rate shows strong customer satisfaction and effective retention strategies. SaaS companies with a low churn rate and high retention rate outperform those with high churn. For example, a company with 5% monthly churn can outperform one with 10% churn by over 500% in two years. Retaining customers costs five times less than acquiring new ones, and existing users are 50% more likely to try new offers.
SaaS leaders use both metrics to guide decisions. Sobot’s omnichannel solutions, like Live Chat, help reduce churn and improve retention by providing fast, personalized support. This approach increases customer lifetime value and drives sustainable growth. The churn rate vs retention rate debate matters because each metric uncovers unique insights. By tracking both, SaaS teams can spot risks, double down on what works, and build a loyal customer base.
Calculating Churn Rate and Retention Rate
Churn Rate Formula
SaaS companies use the churn rate to measure how many customers or how much revenue they lose in a set period. To calculate churn rate, divide the number of customers lost by the number at the start of the period, then multiply by 100. For monthly churn, this formula helps teams see how quickly users leave. Companies often track user churn each month to spot trends and act fast.
| Metric Type | Formula / Calculation Description | Numerical Example | Result |
|---|---|---|---|
| Customer Churn Rate | (Lost Customers / Total Customers at start of period) x 100 | Start with 100 customers, 5 cancel during the year | 5% |
| Customer Churn Rate | (Lost Customers / Total Customers at start of period) x 100 | Start month with 2,000 customers, 50 leave | 2.5% |
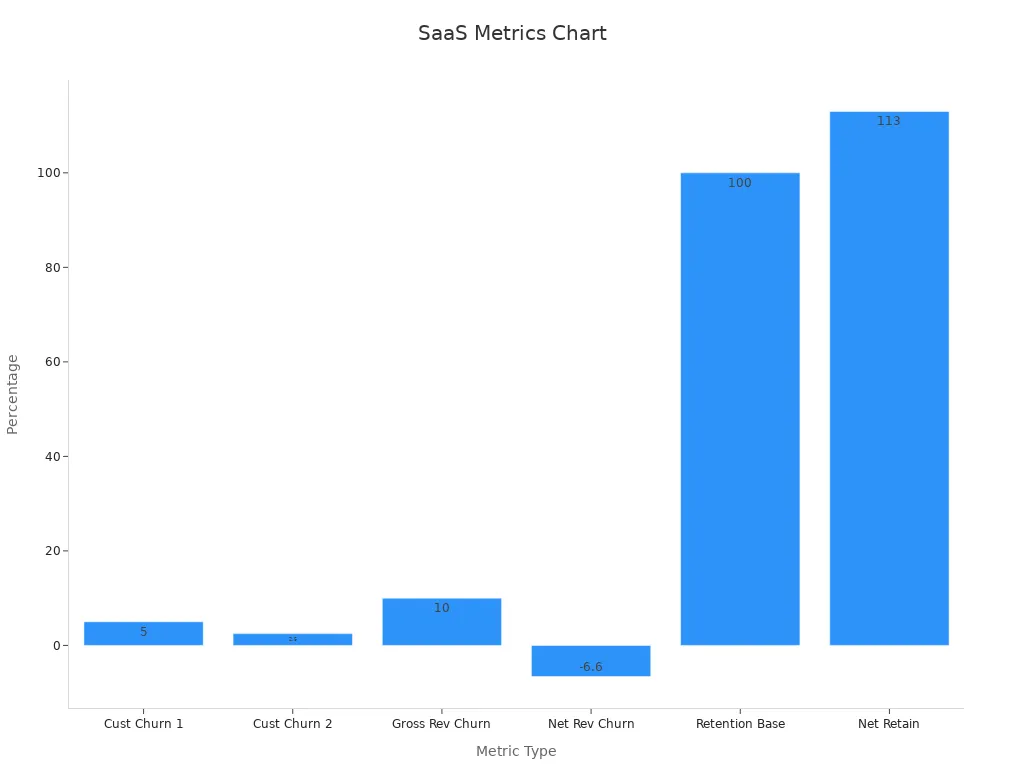
| Gross Revenue Churn | [(Downgrade MRR + Cancellation MRR) / Total MRR at start] x 100 | $100,000 MRR at start, $10,000 lost | 10% |
A SaaS business with 100 customers at the start and 90 at the end of the month has a 10% churn rate. If monthly recurring revenue drops from $10,000 to $9,000, the monthly churn rate is also 10%. Sobot Live Chat helps companies monitor monthly churn by providing real-time analytics and customer engagement data.
Retention Rate Formula
Retention rate shows how many customers stay over a period. To calculate retention rate, subtract new customers from the total at the end, divide by the number at the start, and multiply by 100. This metric helps SaaS teams measure loyalty and the success of their retention strategies.
| Source | Formula for Retention Rate | Example Details | Calculation | Result |
|---|---|---|---|---|
| Userpilot | ((Customers at end – New customers) / Customers at start) x 100 | Start: 200, New: 50, End: 230 | ((230 - 50) / 200) x 100 | 90% |
| Hubifi | ((Customers at end – New customers) / Customers at start) x 100 | Start: 200, New: 20, End: 210 | ((210 - 20) / 200) x 100 | 95% |
A company starting with 200 customers, gaining 20 new ones, and ending with 210, has a 95% retention rate. Sobot Live Chat supports teams as they calculate retention rate by tracking user engagement and satisfaction across all channels.
Common Calculation Pitfalls
Many SaaS teams make mistakes when they calculate churn rate or retention rate. Using the wrong time frame or mixing new and existing customers can give misleading results. For example, monthly churn should only count customers present at the start, not new signups. Rapid growth can also distort churn rate if the denominator does not match the period measured. Revenue churn calculations may miss discounts or refunds, leading to errors.
Tip: Always define what counts as churn and retention for your business. Use tools like Sobot Live Chat to segment users, analyze monthly churn, and avoid common pitfalls.
Sobot Live Chat offers built-in analytics to help SaaS leaders track user churn, calculate churn rate, and calculate retention rate accurately. By using these insights, companies can improve monthly churn and boost retention.
SaaS Customer Retention Strategies
Reducing Customer Churn Rate
SaaS leaders can reduce churn by using proven, data-driven strategies. Regular communication, onboarding optimization, and personalized engagement help keep users connected. The table below shows effective ways to lower churn rate and boost customer loyalty:
| Strategy / Tool | Description | Example / Outcome |
|---|---|---|
| Regular Communication | Personalized emails and in-app messages keep customers engaged. | Groove reduced churn by 71% with targeted emails. |
| User Onboarding Optimization | Simple onboarding steps help users reach value faster. | Improved onboarding led to a 90% completion rate. |
| Human Touch Management | Dedicated account managers build trust and spot churn risks early. | Scheduled check-ins lowered customer churn rate. |
| Trigger-Based Emails | Automated emails guide users to valuable features. | Trigger emails increased engagement and retention. |
| Engagement Initiatives | Gamification and community events foster customer loyalty. | Webinars and forums improved retention rate and reduced churn. |
Flexible payment terms and usage-based pricing also help reduce churn, especially during economic shifts. Proactive customer success teams can increase customer retention rates by up to 20%. Monitoring login frequency and using predictive analytics allow teams to reach out before users leave.
Improving Retention Rate
To improve retention, SaaS companies should focus on customer retention rate benchmarks and continuous engagement. The table below outlines key benchmarks:
| SaaS Vertical | Typical Retention Rate |
|---|---|
| Enterprise SaaS | 85-95%+ annual retention |
| SMB/Mid-Market SaaS | 70-85% annual retention |
| Consumer Apps | 30-60% monthly retention |
| Media/Content Sites | 45-80% monthly retention |
Companies can improve retention by segmenting users, running cohort analysis, and using A/B testing to refine onboarding and messaging. Customer feedback, loyalty programs, and targeted upselling also increase customer retention and lifetime value. Tracking the Magic Number (LTV/CAC) helps ensure profitable growth and strong retention strategies.
Tip: Proactive support and personalized communication are key to customer retention. Engaged users are more likely to stay and become loyal advocates.
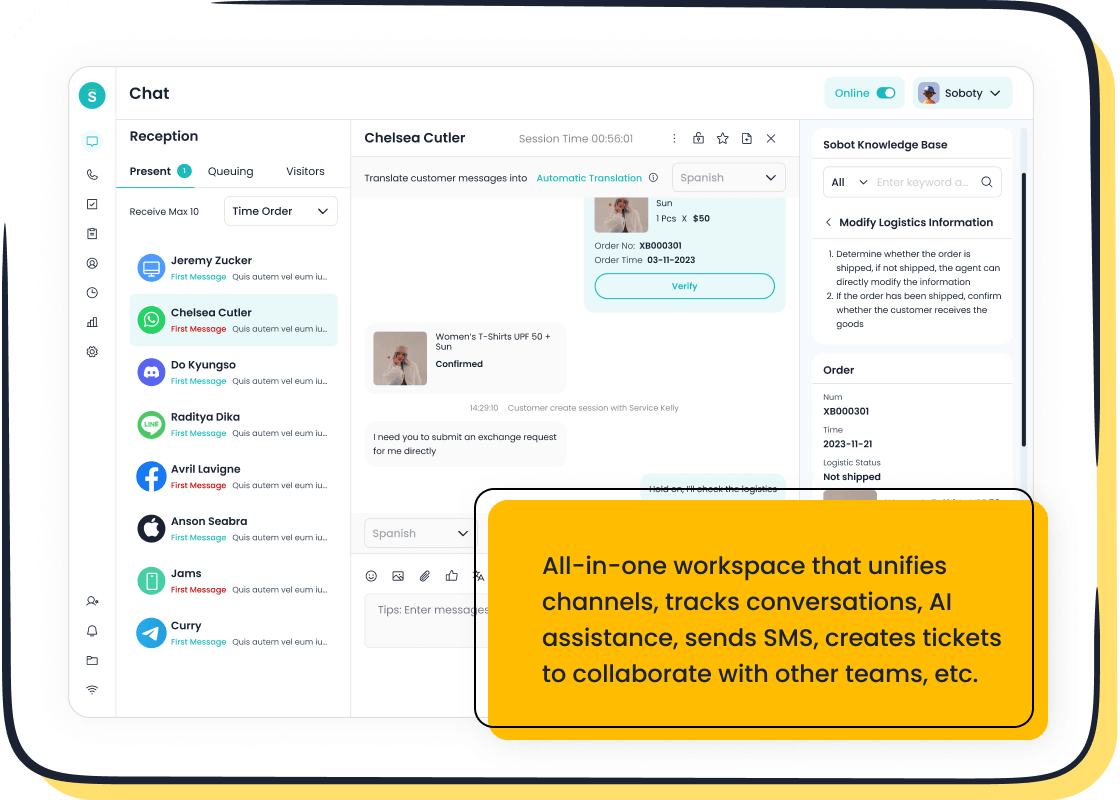
Sobot Live Chat for Customer Retention
Sobot Live Chat empowers SaaS teams to reduce churn and improve retention across all channels. The platform unifies customer conversations, supports omnichannel engagement, and provides real-time analytics. With Sobot, agents can spot at-risk users, deliver timely support, and personalize every interaction. Built-in analytics track customer retention rate and churn rate, helping teams refine retention strategies. Sobot’s AI-powered tools and seamless integration make it easier to improve retention, foster customer loyalty, and drive SaaS customer retention success.
Churn Rate vs Retention Rate: Impact on SaaS
Revenue and Growth
Revenue retention stands at the core of SaaS growth. Companies that keep more customers and expand their accounts see faster revenue gains. A low revenue churn rate means a business holds onto its recurring income, while a high revenue churn rate signals lost opportunities. The following table shows how these metrics connect to financial performance:
| Metric | Definition | Formula | Benchmark / Example |
|---|---|---|---|
| Customer Churn Rate | Percentage of customers lost over a period | (Lost Customers During Period ÷ Total Customers at Start of Period) × 100 | Example: Losing 20 customers out of 1,000 → (20 ÷ 1,000) × 100 = 2% |
| Revenue Churn Rate | Percentage of Monthly Recurring Revenue (MRR) lost over a period | (Lost MRR During Period ÷ Total MRR at Start of Period) × 100 | Benchmark: Net MRR churn rate ranges from 0.2% to -1.2% depending on ARR size |
| Net Revenue Retention | Percentage of recurring revenue retained from existing customers, including expansions & churn | [(Starting MRR + Expansion MRR – Churned MRR – Contraction MRR) ÷ Starting MRR] × 100 | Example: Starting $100,000 MRR, +$15,000 upsells, -$5,000 churn, -$2,000 downgrades → NRR = 108% |
A SaaS company with a net revenue retention above 100% grows even without new customers. Sobot’s analytics help teams track revenue churn and spot trends early, supporting smarter decisions for growth.
Customer Success and Support
Customer success teams play a vital role in reducing revenue churn and boosting retention. They use customer retention metrics to identify at-risk users and deliver proactive support. Companies that invest in customer success see measurable results. For example, targeted campaigns and improved support can cut churn by up to 71%. The table below highlights real-world impacts:
| Company | Numerical Impact on Churn Rate |
|---|---|
| Groove | 71% reduction in customer churn rate through targeted email campaigns and data-driven insights |
| Mention | 22% reduction in customer churn rate within one month due to improved customer support and engagement |
| HubSpot | Retained 33% of previously unhappy customers by offering personalized support based on churn analysis |
Sobot Live Chat enables SaaS teams to deliver timely, personalized support across channels. This approach increases revenue retention and strengthens customer loyalty.
2025 SaaS Trends
The SaaS market continues to expand rapidly. By 2025, organizations will use over 110 SaaS apps on average. The global SaaS market is projected to surpass $900 billion by 2030, with a CAGR of 18.7%. Companies focus more on customer success and retention as competition rises. The following chart shows key industry trends:
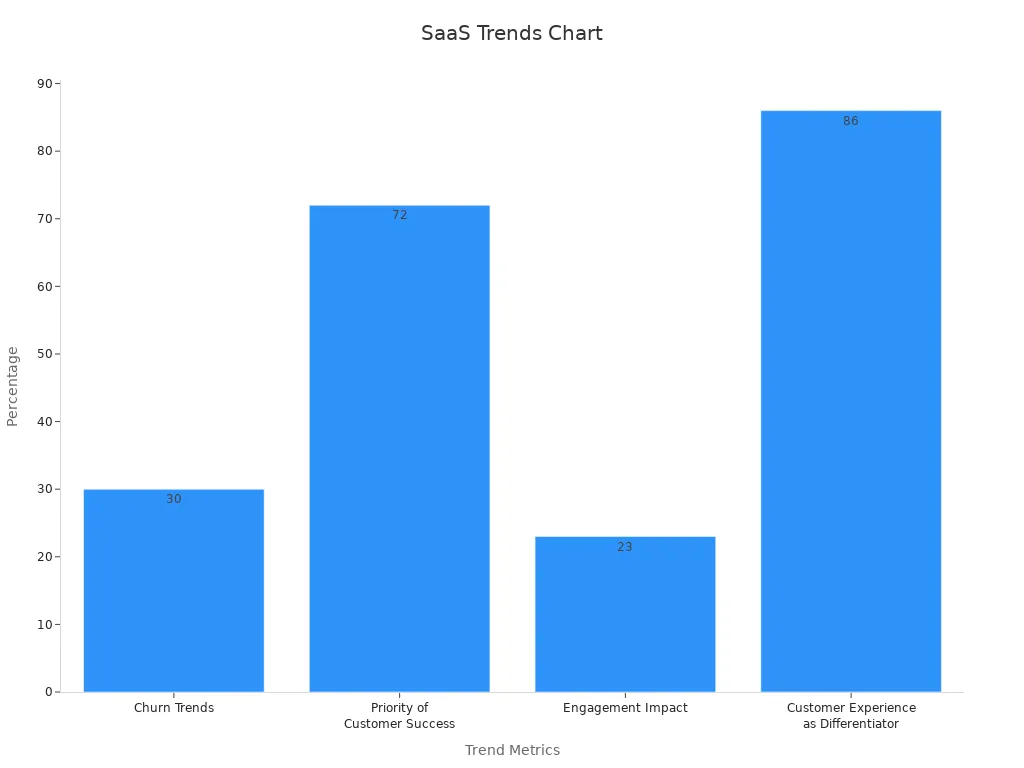
SaaS leaders prioritize revenue retention and customer success to stay ahead. Tools like Sobot help businesses monitor revenue churn rate, improve customer retention metrics, and adapt to changing market demands.
Benchmarks for Churn Rate and Retention Rate
Industry Standards
SaaS companies rely on industry standards to measure their performance. Most leading SaaS firms aim for a median customer retention rate of around 87% annually. Net dollar retention rates often exceed 100%, showing that many companies grow revenue from existing customers. Churn benchmarks help leaders compare their results with others in the market. Experts recommend keeping annual churn rates below 10% for high-quality SaaS businesses. Monthly churn rates should stay under 5%, with top performers achieving rates below 3%. The table below summarizes key industry standards:
| Metric / Segment | Benchmark Range / Median Value |
|---|---|
| Median Customer Retention Rate | Around 87% annually |
| Median Net Dollar Retention Rate | Above 100% annually |
| Median Churn Rate (Customer & Revenue) | 5-15% annually |
| SaaS SMB Monthly Churn Rate | 5-7% monthly |
| SaaS Enterprise Monthly Churn Rate | 1-2% monthly |
| Healthy Subscription Churn Rate | Under 5% monthly, ideally below 3% |
Note: Monthly churn rates compound quickly. A 6% monthly churn can lead to over 50% annual churn, which can threaten business growth.
B2B vs B2C SaaS
Churn and retention rates differ between B2B and B2C SaaS models. B2B SaaS companies usually have higher retention and lower churn because they serve businesses with larger contracts and longer commitments. B2C SaaS faces higher churn due to shorter contracts and more impulsive buying. The table below highlights these differences:
| Metric | B2B SaaS (High ARPA > $1k/month) | B2C SaaS (Low ARPA < $25/month) |
|---|---|---|
| Net Revenue Retention (NRR) | 110-125% best-in-class | Top quartile around 70% |
| Customer Retention Rate | ~90% best-in-class | ~75% best-in-class |
| Churn Rate | <2% monthly, often negative | >3-4% monthly |
| Expansion Revenue | ~40% of new revenue | Minimal |
- B2B SaaS benefits from upselling and cross-selling, leading to negative churn.
- B2C SaaS struggles with higher churn and fewer expansion opportunities.
- Retention strategies like customer education and loyalty programs work better in B2B.
Enterprise and SMB Segments
Enterprise SaaS companies enjoy lower churn and higher retention due to longer contracts and higher switching costs. Annual customer churn in enterprise SaaS often stays below 5%, or about 0.4% monthly. In contrast, SMB SaaS faces higher churn, with monthly rates between 3% and 7%. Top-performing SMBs can still achieve net revenue retention above 100%, as seen with Zoom’s SMB segment, which maintained over 130% NRR for 11 quarters. The table below compares these segments:
| Metric | Enterprise SaaS | SMB SaaS |
|---|---|---|
| Annual Customer Churn | Below 5% (0.4% monthly) | 36-84% annual (3-7% monthly) |
| Annual Retention Rate | 85-95%+ | 75-80% (top 90%+) |
| Net Revenue Retention | >100% stable | >100%, best 110-120% |
| Contract Duration | Longer | Shorter |
| Sales Cycle | Longer, complex | Shorter, simpler |
Sobot’s analytics and omnichannel tools help both enterprise and SMB SaaS companies track these metrics, identify risks, and improve retention strategies.
Key Differences Table
Side-by-Side Comparison
Understanding the key differences between retention rate and churn rate helps SaaS leaders make better decisions. The table below provides a clear, side-by-side comparison using real SaaS data and industry averages:
| Aspect | Churn Rate | Retention Rate |
|---|---|---|
| Definition | Percentage of customers who leave during a period | Percentage of customers who stay during a period |
| Formula | (Number of customers who left / Total customers at start) x 100 | (Number of customers retained / Total customers at start) x 100 |
| Example Calculation | 50 out of 1,000 customers leave → churn rate = 5% | 950 out of 1,000 customers stay → retention rate = 95% |
| Relationship | Retention rate = 100% - churn rate | Churn rate = 100% - retention rate |
| Industry Average | Monthly churn: 3-8%; Annual churn: 32-50% | Monthly retention: 92-97%; Annual retention: 50-68% |
| Revenue Impact | Losing 50 customers at $100/month = $5,000 MRR lost | High retention protects and grows recurring revenue |
| Types | Customer churn, revenue churn | Logo retention (customer count), net MRR retention (revenue) |
| SaaS Analytics Tools | Track churn with real-time dashboards, cohort analysis, and alerts | Monitor retention with cohort reports, segmentation, and journey analytics |
Note: Many SaaS analytics platforms, such as ChartMogul and Mixpanel, offer dashboards that visualize both churn and retention rates. These tools help teams benchmark performance and identify trends. Sobot’s Live Chat solution also provides built-in analytics, making it easy to monitor customer engagement and optimize retention strategies.
SaaS companies often use these metrics together to evaluate customer health. For example, a company with a 5% churn rate will have a 95% retention rate. This direct relationship makes it simple to track progress and set goals. The key differences between retention rate and churn rate become clear when teams analyze both metrics side by side.
Churn rate and retention rate give SaaS leaders a clear view of customer loyalty and business health in 2025. Tracking both metrics helps companies spot risks and drive growth.
- A SaaS company cut early-stage churn by 45% in 90 days and boosted product adoption by 30%.
- Reducing churn by just 5% can raise profits by at least 20%.
- Keeping customers costs much less than finding new ones.
Sobot Live Chat supports SaaS teams by unifying customer conversations and providing real-time analytics. Leaders should review their churn rate and retention rate monthly, use tools like Sobot, and focus on proactive support to build lasting customer relationships.
FAQ
What is the main difference between churn rate and retention rate?
Churn rate measures the percentage of customers who leave during a period. Retention rate shows the percentage who stay. Both metrics help SaaS companies understand customer loyalty and track user churn. High retention rate signals strong customer retention and business health.
How can SaaS companies reduce churn and improve retention?
SaaS companies use onboarding, proactive support, and personalized engagement to reduce churn. Sobot Live Chat helps teams deliver fast responses and track customer retention metrics. Companies with a low churn rate often see higher revenue retention and customer loyalty.
Why do customer retention metrics matter for SaaS growth?
Customer retention metrics reveal how well a company keeps users. A high retention rate leads to more revenue retention and lower acquisition costs. According to Harvard Business Review, increasing retention by 5% can boost profits by up to 95%.
How do you calculate churn rate and retention rate?
To calculate churn rate, divide the number of customers lost by the number at the start, then multiply by 100. To calculate retention rate, subtract new customers from the total at the end, divide by the number at the start, and multiply by 100.
What are common churn benchmarks for SaaS companies?
Monthly churn rates below 5% and annual retention rates above 85% are common benchmarks. Enterprise SaaS often achieves a lower churn rate than SMBs. Sobot’s analytics help SaaS leaders compare their performance to industry churn benchmarks and improve retention strategies.
See Also
Enhance SaaS Customer Service Using Live Chat Techniques
Comprehensive Guide To Comparing Live Chat Support Expenses
Best Ten Call Center Analytics Tools For 2024
