10 Essential Metrics to Measure Customer Retention Effectively
Customer retention plays a critical role in driving sustainable business success. Keeping loyal customers is more cost-effective than acquiring new ones, and it directly impacts your bottom line. Did you know that raising retention by just 5% can boost your revenue by 25% to 95%? This highlights the power of focusing on loyalty.
To achieve this, you need clear measures of customer retention. Key metrics such as customer lifetime value and repeat purchase rate offer insights into your loyalty levels. These metrics help you evaluate your user retention strategy and refine your customer retention strategies for long-term growth. Tools like Sobot can support you in analyzing these metrics and implementing effective strategies to retain your customers.
Understanding and tracking these metrics isn’t just about numbers—it’s about building meaningful relationships with your audience. By prioritizing customer retention, you lay the foundation for consistent growth and satisfied customers.
Customer Retention Rate (CRR)
Definition and Importance of CRR
Customer retention rate (CRR) measures the percentage of customers who continue to engage with your business over a specific period. It is one of the most critical customer retention metrics because it directly reflects your ability to maintain relationships with existing customers. High retention rates indicate strong customer loyalty, which leads to repeat purchases and long-term revenue growth.
Building a loyal customer base is essential for sustainability. Loyal customers not only contribute to consistent revenue but also act as brand advocates, spreading positive word-of-mouth and attracting new customers. By tracking CRR, you can identify areas where your customer retention strategies excel and where improvements are needed.
How to Calculate Customer Retention Rate
Calculating CRR involves a straightforward formula:
- Determine the number of customers at the start of the period.
- Note the number of customers at the end of the period.
- Subtract new customers acquired during the period from the end number.
- Divide the result by the number of customers at the start.
- Multiply by 100 to get the retention rate percentage.
For example, if you started with 500 customers, ended with 600, and acquired 150 new customers during the period, your CRR would be:
CRR = [(600 - 150) / 500] x 100 = 90%
Using tools like Sobot can simplify this process. Sobot’s analytics platform provides real-time insights into customer retention KPIs, helping you track CRR and other metrics effortlessly.
Benchmarks for Customer Retention Rate
Retention benchmarks vary across industries. Comparing your CRR to industry standards helps you understand your performance. Below is a table showcasing average retention rates:
| Industry | Customer Retention Rate |
|---|---|
| Media | 84% |
| Professional Services | 84% |
| IT Services | 81% |
| Insurance | 83% |
| Software/SaaS | 86% |
| E-commerce | 38% |
| Fintech | 78% |
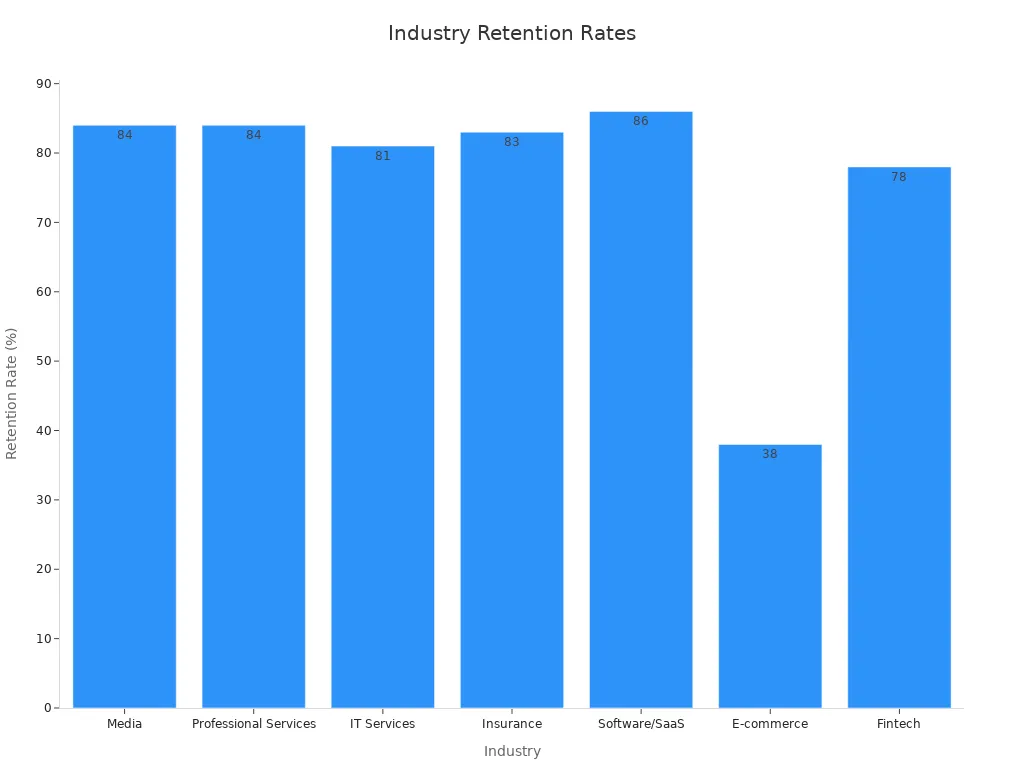
For industries like Software/SaaS, a CRR of 86% is considered excellent, while E-commerce businesses typically see lower rates due to higher competition. Aim to exceed your industry benchmark to stay ahead.
Churn Rate
What is Churn Rate and Why It Matters
Churn rate measures the percentage of customers who stop doing business with you over a specific period. It’s a critical metric for understanding customer retention because it directly reflects how well you’re meeting customer expectations. A high churn rate signals dissatisfaction, poor engagement, or unmet needs, which can harm your business growth.
Customer churn impacts your revenue significantly. For example:
- High churn rates increase customer acquisition costs and reduce customer lifetime value.
- Netflix experienced a 4% subscriber loss in the U.S. after a price hike, costing them $8 million monthly.
By tracking your customer churn rate, you can identify patterns, forecast revenue, and take proactive steps to improve retention. This is especially vital for subscription-based businesses, where even a small increase in churn can disrupt revenue projections.
Formula for Calculating Churn Rate
Calculating churn rate is simple. Use this formula:
Churn Rate = (Customers Lost During Period / Total Customers at Start of Period) x 100
For instance, if you started with 1,000 customers and lost 50 during the month, your churn rate would be:
Churn Rate = (50 / 1,000) x 100 = 5%
Tools like Sobot can help you track this metric effortlessly. Sobot’s analytics platform provides real-time insights into customer churn, enabling you to act quickly and reduce losses.
Industry Standards for Churn Rate
Churn rates vary across industries. Comparing your rate to industry benchmarks helps you gauge your performance. Here’s a breakdown:
| Industry | Average Churn Rate |
|---|---|
| Subscriptions | Under 5% monthly |
| Startups | 5–10% monthly |
| Mature Companies | Under 2% monthly |
| Professional Services | 10–15% annually |
| Utilities and Energy | Below 10% annually |
| Financial Services | 15–25% annually |
| Telecom | 31% |
| Manufacturing | 35% |
| Logistics and Transportation | 40% |
| CPG | 40% |
| Wholesale | 56% |
To reduce churn, focus on improving onboarding, personalizing communication, and addressing at-risk customers. Enhancing customer experience through faster support and intuitive tools like Sobot can also make a significant difference.
Customer Lifetime Value (CLV)

Understanding Customer Lifetime Value
Customer Lifetime Value (CLV) measures the total revenue you can expect from a customer throughout their relationship with your business. It’s a vital metric for understanding the long-term impact of customer retention on your bottom line. By focusing on CLV, you can identify your most valuable customers and allocate resources to nurture these relationships effectively.
Businesses calculate CLV using historical data and statistical models. These models analyze factors such as:
- How long customers stay engaged with your brand
- How often they make purchases
- The average value of their transactions
This analysis helps you predict future revenue and optimize marketing strategies. For example, if a customer has a high CLV, you might prioritize personalized offers or loyalty rewards to keep them engaged.
Steps to Calculate CLV
Calculating CLV involves a few straightforward steps. Start by determining the average purchase value and frequency for a customer. Multiply these two figures to find the customer’s annual revenue. Then, multiply the annual revenue by the average customer lifespan.
Here’s a simple formula:
CLV = (Average Purchase Value) x (Purchase Frequency) x (Customer Lifespan)
For instance, if a customer spends $50 per purchase, buys twice a month, and stays loyal for three years, their CLV would be:
CLV = $50 x 2 x 12 x 3 = $3,600
Keep in mind that CLV is an estimate. It uses assumptions like constant costs and retention rates. Many businesses apply a discounted cash flow approach to adjust future revenue to its present value, similar to net present value (NPV) calculations.
Best Practices for Maximizing CLV
To maximize CLV, focus on strategies that enhance customer retention. Start by improving the customer experience. Offer exceptional support, personalized communication, and loyalty programs. For example, a rewards program that provides discounts or exclusive perks can encourage repeat purchases.
Segment your customers based on their CLV. High-value customers deserve tailored marketing efforts, while lower-value segments may benefit from automated campaigns. Tools like Sobot can help you track CLV and segment customers effectively. Sobot’s analytics platform provides actionable insights, enabling you to refine your retention strategies and boost long-term revenue.
By prioritizing CLV, you not only improve customer retention but also create a sustainable growth model for your business.
Net Promoter Score (NPS)

What NPS Measures and Its Role in Retention
Net Promoter Score (NPS) measures customer loyalty by asking a simple question: "How likely are you to recommend our product or service to others?" Customers respond on a scale from 0 to 10, and their answers classify them into three groups:
- Promoters (9–10): Loyal customers who actively recommend your brand.
- Passives (7–8): Satisfied but unenthusiastic customers who may switch to competitors.
- Detractors (0–6): Unhappy customers likely to share negative feedback.
NPS plays a vital role in customer retention. It identifies detractors, allowing you to address their concerns and potentially turn them into promoters. Passives, who are at risk of becoming detractors, can be targeted with personalized campaigns to boost engagement. While NPS doesn’t always outperform traditional satisfaction metrics, it strongly correlates with retention and provides actionable insights to improve loyalty.
How to Calculate Net Promoter Score
Calculating NPS involves a straightforward formula:
NPS = (% of Promoters) - (% of Detractors)
For example, if 60% of your customers are promoters, 30% are passives, and 10% are detractors, your NPS would be:
NPS = 60% - 10% = 50
A positive NPS indicates more promoters than detractors, which is a good sign for customer retention. Tools like Sobot simplify this process by automating NPS surveys and providing real-time analytics. These insights help you monitor loyalty trends and take timely action.
Interpreting NPS for Customer Retention Strategies
NPS segmentation helps you understand customer behavior and refine your retention strategies. Promoters can be encouraged to refer others through loyalty programs. Passives need engagement strategies, such as exclusive offers, to increase their loyalty. Addressing detractors’ pain points can prevent churn and improve satisfaction.
High NPS scores often correlate with increased referrals, retention, and brand loyalty. Actively using NPS feedback allows you to identify issues and implement improvements. For example, if detractors frequently mention slow customer support, you can enhance response times using tools like Sobot’s AI-powered chatbots. This proactive approach strengthens customer relationships and fosters long-term growth.
Repeat Purchase Rate (RPR)
Definition and Importance of Repeat Purchase Rate
Repeat Purchase Rate (RPR) measures the percentage of customers who make more than one purchase within a given timeframe. It serves as a direct indicator of customer loyalty and satisfaction. A high RPR shows that customers trust your brand and find value in your products or services. On the other hand, a low RPR may suggest that customers are not fully satisfied or engaged.
In e-commerce, RPR is particularly significant. It reflects how well your business retains customers and encourages them to return. Loyal customers contribute to stable income, reduce marketing costs, and enhance your brand’s reputation. By tracking RPR, you can identify patterns in customer behavior and refine your strategies to improve customer retention.
Formula for Calculating RPR
Calculating RPR is straightforward. Use this formula:
Repeat Purchase Rate = (Number of Repeat Customers / Total Number of Customers) * 100
For example, if your business has 500 unique customers and 100 of them made more than one purchase, the calculation would be:
Repeat Purchase Rate = (100 / 500) * 100 = 20%
This metric helps you understand how effectively your business fosters repeat purchases. Tools like Sobot simplify this process by providing real-time analytics on customer retention metrics, including RPR. With Sobot, you can track repeat customers and identify opportunities to boost loyalty.
Benchmarks for a Strong Repeat Purchase Rate
Benchmarks for RPR vary by industry. In e-commerce, a strong RPR typically ranges between 20% and 40%. Businesses with higher rates often excel in customer experience, product quality, and loyalty programs.
Here are some general benchmarks:
- E-commerce: 20–40%
- Subscription services: 50–70%
- Retail: 25–35%
To improve your RPR, focus on strategies that encourage repeat purchases. Offer personalized discounts, loyalty rewards, or exclusive perks. For example, a loyalty program that provides points for every purchase can motivate customers to return. Using Sobot’s customer engagement tools, you can create targeted campaigns to boost repeat purchases and strengthen customer retention.
Time Between Purchases
What Time Between Purchases Reveals About Loyalty
The time between purchases is a powerful indicator of customer loyalty. It measures how often customers return to buy from your business. Shorter intervals suggest strong engagement and satisfaction, while longer gaps may indicate declining interest or unmet needs. For example, a coffee shop might expect customers to return weekly, while a furniture store might see repeat purchases every few years.
Tracking this metric helps you understand purchasing patterns and identify opportunities to improve customer retention. If customers take longer than expected to return, it could signal issues like poor product quality, lack of engagement, or better offers from competitors. By addressing these concerns, you can encourage more frequent purchases and strengthen loyalty.
How to Measure and Analyze This Metric
To calculate the time between purchases, follow these steps:
- Identify the purchase dates for each customer.
- Calculate the time (in days, weeks, or months) between consecutive purchases.
- Average these intervals across all customers.
For example, if a customer buys on January 1st and again on January 15th, the time between purchases is 14 days. Tools like Sobot can automate this process, providing real-time insights into customer behavior. Sobot’s analytics platform helps you track this metric and identify trends, making it easier to refine your customer retention strategies.
Analyzing this data allows you to segment customers based on their purchasing frequency. Frequent buyers might benefit from loyalty programs, while less active customers could receive targeted promotions to re-engage them.
Ideal Benchmarks for Time Between Purchases
Benchmarks for this metric vary by industry. In fast-moving consumer goods (FMCG), shorter intervals (e.g., weekly or monthly) are common. In contrast, industries like automotive or real estate may see intervals spanning years.
Here’s a general guide:
| Industry | Average Time Between Purchases |
|---------------------------|-------------------------------|
| Grocery | 1–2 weeks |
| Apparel | 2–3 months |
| Electronics | 1–2 years |
| Furniture | 5–10 years |
Understanding your industry’s benchmarks helps you set realistic goals. If your intervals exceed these averages, consider strategies like personalized offers or email reminders to encourage repeat purchases. Sobot’s customer engagement tools can help you implement these strategies effectively, ensuring you stay ahead in customer retention.
Customer Engagement Score (CES)
What is Customer Engagement Score?
Customer Engagement Score (CES) measures how actively your customers interact with your brand. It evaluates their participation in activities like using your product, engaging with your content, or attending events. A high CES indicates that customers find value in your offerings and are likely to stay loyal. This metric is one of the most insightful user retention metrics because it highlights the strength of your relationship with your audience.
You can calculate CES by assigning scores to specific engagement activities. For example, logging into your platform daily might score higher than occasional visits. Tools like Sobot simplify this process by tracking customer interactions and providing real-time CES insights. These insights help you identify which customers need more attention to improve their engagement levels.
How CES Reflects Retention Health
CES directly correlates with customer retention. Engaged customers are more likely to renew subscriptions, make repeat purchases, and recommend your brand to others. A low CES often signals disengagement, which can lead to churn.
Consider the following data:
| Engagement Activity | Adoption Score | Renewal Rate |
|--------------------|----------------|--------------|
| XYZ Activities | Green | Higher |
| ABC Activities | Red | Lower |
This table shows that customers with higher adoption scores tend to renew at greater rates. By focusing on improving CES, you can enhance your overall retention health. For instance, offering personalized onboarding or interactive tutorials can boost engagement and reduce churn. Sobot’s analytics platform helps you monitor CES trends and take proactive steps to retain customers.
Examples of High CES and Its Impact
High CES often leads to tangible benefits for your business. For example, a SaaS company noticed that users who completed three onboarding tasks within the first week had a 90% renewal rate. By encouraging similar behaviors, they improved their customer retention significantly.
Another example comes from e-commerce. Customers who engage with loyalty programs or leave product reviews often have higher CES. These customers not only return to shop but also influence others to try your brand. Sobot’s engagement tools can help you identify such high-value customers and create targeted campaigns to nurture their loyalty.
Focusing on CES allows you to build stronger relationships with your audience. This metric ensures that your user retention metrics align with long-term growth goals.
Active Customer Rate
Definition and Importance of Active Customer Rate
Active Customer Rate measures the percentage of customers actively engaging with your business during a specific period. This metric highlights how well you maintain customer interest and loyalty. A high Active Customer Rate indicates strong customer retention, as it shows that customers consistently find value in your products or services.
Tracking this metric helps you identify trends in customer behavior. For example, if your Active Customer Rate declines, it may signal dissatisfaction or reduced engagement. By addressing these issues, you can improve customer retention and foster long-term loyalty. Businesses that prioritize this metric often see higher revenue and stronger customer relationships.
How to Calculate Active Customer Rate
Calculating Active Customer Rate is straightforward. Use the following formula:
Active Customer Rate = (Number of Active Customers / Total Customers) x 100
For instance, if you have 1,000 customers and 600 of them are active during a month, your Active Customer Rate would be:
Active Customer Rate = (600 / 1,000) x 100 = 60%
Tools like Sobot simplify this process by providing real-time analytics. Sobot’s platform tracks customer activity, helping you monitor this metric and take timely action to improve engagement.
Benchmarks for Active Customer Rate
Benchmarks for Active Customer Rate vary by industry. Comparing your rate to these benchmarks helps you evaluate your performance. Here’s a breakdown:
| Metric Type | Description |
|---|---|
| Investment-weighted figure | Reflects the normalized impact result associated with investment capital, calculated using a normalization ratio. |
| Scale of change (volume) | Indicates the year-on-year volume change in active clients, showing growth or decline over time. |
| Pace of change (percent) | Represents the year-on-year percent change in active clients, providing a percentage growth rate. |
For example, a subscription-based business might aim for an Active Customer Rate above 70%, while retail businesses may target 50–60%. If your rate falls below these benchmarks, consider strategies like personalized offers or loyalty programs to re-engage inactive customers. Sobot’s customer engagement tools can help you implement these strategies effectively, ensuring consistent growth in customer retention.
Customer Satisfaction Score (CSAT)
What is Customer Satisfaction Score?
Customer Satisfaction Score (CSAT) measures how happy your customers are with your products or services. It is one of the simplest and most effective ways to gauge customer satisfaction. Businesses typically collect CSAT data by asking customers to rate their experience on a scale, such as 1 to 5 or 1 to 10. Higher scores indicate greater satisfaction.
This metric helps you understand how well your business meets customer expectations. For example, if your CSAT scores are consistently high, it shows that your customers are satisfied and likely to stay loyal. On the other hand, low scores may signal dissatisfaction, which could lead to a decline in customer retention.
How CSAT Influences Retention
CSAT plays a crucial role in customer retention. Satisfied customers are more likely to return, make repeat purchases, and recommend your brand to others. Companies with high customer satisfaction scores report 35% higher retention rates. They also see 28% more sales from repeat customers.
When you focus on improving CSAT, you create a positive experience for your customers. This builds trust and loyalty, which are essential for long-term growth. For instance, offering quick support or personalized solutions can significantly boost satisfaction. Tools like Sobot can help you track CSAT in real time, allowing you to address issues promptly and enhance customer retention.
Interpreting CSAT Results for Improvement
Interpreting CSAT results requires careful analysis. Start by identifying trends in your scores. Are they improving, declining, or staying consistent? Look for patterns in customer feedback to pinpoint areas for improvement.
For example, if customers frequently mention slow response times, you can invest in faster support solutions. Sobot’s AI-powered tools can help you streamline customer interactions and improve satisfaction. Additionally, segment your customers based on their CSAT scores. High scorers may appreciate loyalty rewards, while low scorers might need targeted campaigns to re-engage them.
Despite its importance, only 12% of companies effectively use CSAT data to enhance sales and loyalty. By leveraging this metric, you can gain a competitive edge and strengthen your customer retention strategies.
Revenue Retention Rate
What is Revenue Retention Rate?
Revenue Retention Rate measures how much recurring revenue your business retains over a specific period, accounting for upgrades, downgrades, and cancellations. Unlike customer retention, which focuses on the number of customers, this metric emphasizes the financial health of your customer base. It provides a clear picture of how well your business retains and grows revenue from existing customers.
A high Revenue Retention Rate indicates strong customer engagement and satisfaction. It shows that your customers not only stay but also contribute more through upsells or additional purchases. For example, companies with high rates often experience predictable growth, making them attractive to investors. This metric is especially critical for subscription-based businesses, where revenue churn can significantly impact profitability.
Formula for Calculating Revenue Retention Rate
To calculate Revenue Retention Rate, use this formula:
Revenue Retention Rate = [(MRR at Start + Expansion Revenue - Revenue Churn) / MRR at Start] x 100
Here’s what each component means:
- MRR (Monthly Recurring Revenue): The baseline revenue from your customers at the start of the period.
- Expansion Revenue: Additional income from upsells or price increases.
- Revenue Churn: Revenue lost due to cancellations or downgrades.
For example, if your MRR at the start is $50,000, you gain $10,000 from upsells, and lose $5,000 due to cancellations, your Revenue Retention Rate would be:
Revenue Retention Rate = [($50,000 + $10,000 - $5,000) / $50,000] x 100 = 110%
This result shows that your business not only retained its revenue but also grew it by 10%. Tools like Sobot can automate this calculation, providing real-time insights into revenue churn and retention trends.
Industry Standards for Revenue Retention Rate
Revenue Retention Rate benchmarks vary across industries. Companies with rates above 100% demonstrate exceptional customer retention and revenue growth. Here are some examples of top-performing companies:
- Snowflake – 158%
- Twilio – 155%
- Elastic – 142%
- PagerDuty – 139%
- AppDynamics – 123%
These companies excel in reducing revenue churn and increasing expansion revenue. For most businesses, aiming for a rate above 90% is a good starting point. Subscription-based models, in particular, should prioritize strategies like personalized offers and loyalty programs to boost this metric. Sobot’s analytics platform can help you track and improve your Revenue Retention Rate by identifying opportunities for upselling and reducing churn.
Tracking the 10 essential customer retention metrics is crucial for sustainable business growth. These metrics, such as churn rate, customer lifetime value, and satisfaction scores, provide actionable insights into customer behavior and loyalty. By monitoring them, you can identify areas for improvement and refine your strategies to retain customers effectively.
Consider the following data-driven summary of key metrics and their impact on growth:
| Metric | Description | Impact on Growth |
|---|---|---|
| Customer Acquisition Cost (CAC) | Measures the cost of acquiring a new customer. A lower CAC indicates efficient marketing spending. | Helps balance spending and revenue generation, leading to sustainable growth. |
| Customer Lifetime Value (LTV) | Represents total revenue expected from a customer over their relationship with the company. | Balancing LTV with CAC ensures optimal marketing spend and enhances customer retention strategies. |
| Churn Rate | Measures the percentage of customers lost over a period. A lower churn rate indicates higher loyalty. | Monitoring churn rates helps identify dissatisfaction areas and improve retention strategies. |
| Customer Satisfaction Score (CSAT) | Captures customer perceptions of products/services, typically measured via surveys. | High CSAT scores correlate with improved loyalty, repeat business, and referrals, driving growth. |
Integrating these metrics into your strategy ensures you stay competitive and foster long-term loyalty. Tools like Sobot can simplify this process by providing real-time analytics and actionable insights. By prioritizing customer retention, you create a foundation for consistent growth and success.
FAQ
What is the most important metric for customer retention?
The most important metric depends on your business goals. However, customer retention rate (CRR) is often considered vital. It shows how well you retain customers over time. A high CRR indicates strong loyalty and satisfaction, which directly impacts revenue growth.
How often should you track customer retention metrics?
You should track customer retention metrics regularly, such as monthly or quarterly. Frequent tracking helps you identify trends and address issues promptly. For subscription-based businesses, monthly tracking is especially crucial to reduce churn and improve retention strategies.
Can small businesses benefit from tracking customer retention metrics?
Yes, small businesses can greatly benefit. Tracking these metrics helps you understand customer behavior, improve satisfaction, and build loyalty. Even with limited resources, tools like Sobot provide affordable solutions to monitor and enhance retention effectively.
How does customer retention impact profitability?
Customer retention directly affects profitability. Retaining customers costs less than acquiring new ones. Loyal customers also tend to spend more over time. For example, increasing retention by 5% can boost profits by 25% to 95%, according to research by Bain & Company.
What tools can help track customer retention metrics?
Tools like Sobot offer comprehensive analytics for tracking customer retention metrics. They provide real-time insights into key indicators like churn rate, lifetime value, and satisfaction scores. These insights help you refine strategies and improve customer loyalty.
See Also
Best Customer Service Software Options for 2024 Revealed
Enhance Customer Satisfaction with These Live Chat Tips
Leading Voice of the Customer Tools to Use in 2024
Essential Call Center Analytics Software Solutions for 2024
Guidelines for Selecting Social Media Customer Service Tools
